
Post-Earnings Dip in India: No Significant Recovery vs Sensex
India beat-and-dip events on NSE: 317 events, mostly 2022–2025. T+63 CAR is +1.01% (t=1.11, not significant) vs Sensex. The earlier +2.54%** result was vs INDA ETF, a different benchmark that included USD/INR movements. Measured locally, the edge disappears.

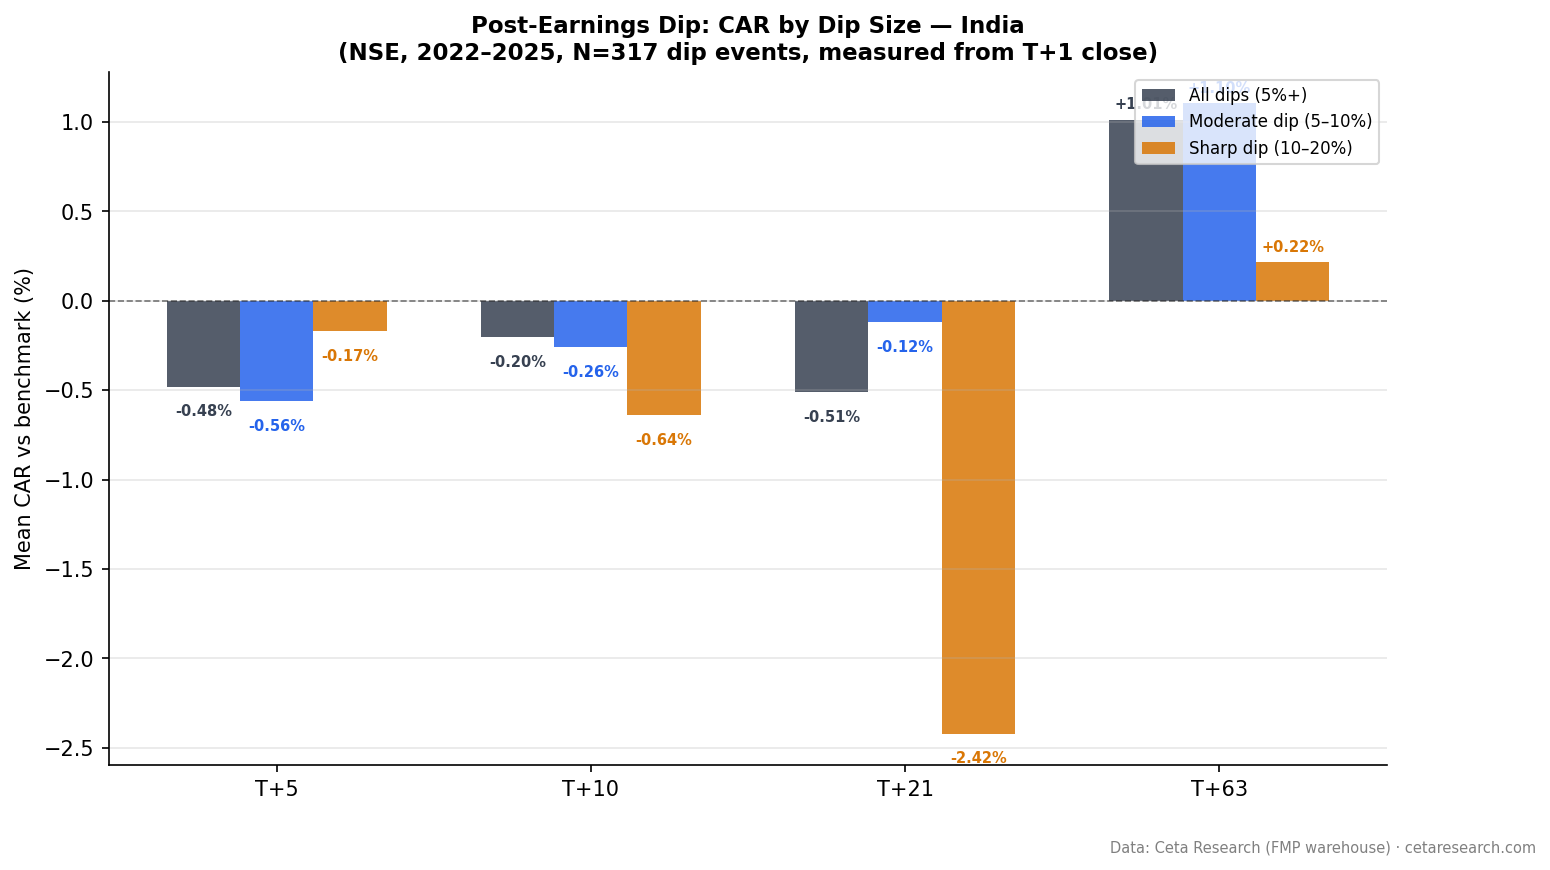
India beats earnings and drops 5%+. At three months, stocks are up +1.01% vs Sensex. That's not statistically significant (t=1.11). The earlier result of +2.54%** was measured against INDA, a USD-denominated ETF. Measured against the local Sensex, the edge disappears.
Contents
- The Signal
- What We Found
- The Dip Size Breakdown
- The Data Caveat
- Why the Delay?
- Practical Implications
- Limitations
- Takeaway
The Signal
Same setup as the global study: a company beats earnings estimates (epsActual > epsEstimated), and the stock drops ≥ 5% from T-1 close to T+1 close. We measure CAR from T+1 close at T+5, T+10, T+21, and T+63 windows.
Universe: NSE-listed stocks with market cap above ₹20B. BSE removed due to 38% dual-listing overlap with NSE. Data from FMP, 2000–2025, with 94% of events from 2022 or later. 317 total events.
Benchmark: Sensex (^BSESN), a local INR-denominated index. CAR = stock return minus Sensex return. This is the honest comparison for an Indian investor.
Data quality: A price-oscillation filter removes FMP phantom holiday rows and broken split adjustments before any return is computed. Single-window returns above 200% are treated as price artifacts and dropped.
Data: FMP financial data warehouse, 2000–2025. Updated June 2026.
What We Found
The pattern is flat at all short windows, with a positive direction at T+63 that doesn't clear the significance threshold.
| Window | Mean CAR | t-stat | N | Hit Rate |
|---|---|---|---|---|
| T+5 | -0.48% | -1.77 | 317 | 40.7% |
| T+10 | -0.20% | -0.57 | 311 | 44.1% |
| T+21 | -0.51% | -0.98 | 315 | 45.4% |
| T+63 | +1.01% | +1.11 | 316 | 46.8% |
Significance threshold: |t| ≥ 1.96. No window meets it.
The T+63 direction is positive, but t=1.11 is well below the conventional significance threshold of 1.96. Nothing at T+5, T+10, or T+21 shows any pattern. The hit rate of 46.8% at T+63 is below 50%.
The Dip Size Breakdown
| Dip Category | N | T+21 CAR | t-stat | T+63 CAR | t-stat |
|---|---|---|---|---|---|
| All dips (5%+) | 317 | -0.51% | -0.98 | +1.01% | +1.11 |
| Moderate (5–10%) | 264 | -0.12% | -0.22 | +1.10% | +1.12 |
| Sharp (10–20%) | 48 | -2.42% | -1.59 | +0.22% | +0.08 |
| Severe (20%+) | 5 | - | - | - | - |
The moderate dip group (n=264) shows positive T+63 direction but no significance (t=1.12). The sharp dip group has only 48 events, too few for reliable conclusions. The severe dip category has 5 events and is not interpretable.
None of these subgroups reach significance.
The Data Caveat
India's data is heavily concentrated in recent years. The yearly breakdown:
| Year | Events |
|---|---|
| 2000–2020 | 16 (combined) |
| 2021 | 3 |
| 2022 | 13 |
| 2023 | 65 |
| 2024 | 110 |
| 2025 | 110 |
94% of events are from 2022 or later. 69% come from 2024 and 2025 alone. This is a feature of FMP's India coverage expanding around 2022–2023, not a property of India's market history.
Two additional changes from the earlier analysis: BSE was removed to eliminate 38% dual-listing overlap with NSE. The benchmark was changed from INDA (a USD ETF tracking MSCI India) to the Sensex (local INR index). The INDA-based result of +2.54%** partly reflected USD/INR movements and the construction of a foreign ETF, not the return an Indian investor would have experienced.
Why the Delay?
The T+63 direction is positive, and these explanations are consistent with that pattern:
Institutional re-evaluation cycles. Indian institutional investors may re-analyze quarterly results more slowly than US counterparts, especially for mid-cap names that get initial sell pressure from retail traders.
Earnings quality reassessment. Many beat events in India involve companies where the sell-off is driven by non-EPS concerns (guidance, revenue mix, promoter pledging news) that are later re-evaluated as the quarter's data is absorbed.
Market structure. India has a significant retail trading base that reacts quickly to post-earnings price moves and may reverse that initial reaction over 40–60 days once fundamental data is more broadly digested.
These are consistent with the data direction, but the statistical signal is weak enough that we can't draw firm conclusions. A t-stat of 1.11 with 94% of data from one bull-market period doesn't support structural claims.
Practical Implications
Without statistical significance, there's no statistical basis for trading this pattern. A T+63 CAR of +1.01% with t=1.11 could easily be noise, particularly when the sample is this concentrated in a bull-market window.
The T+63 direction is positive across the full sample and the moderate dip subgroup. If the India data pipeline continues to grow and the signal persists across a full market cycle, it may eventually reach significance. At 317 events concentrated in 2022–2025, it doesn't get there. The signal has actually weakened as the sample grew: the March 2026 run showed +1.57% (t=1.68) on 284 events, and adding new events plus stricter data-quality filters pulled it down to +1.01%.
Limitations
Data recency. 94% of events from 2022 or later (69% from 2024–2025). The period was a strong bull phase for Indian equities. The result can't be separated from that backdrop.
Benchmark change. The earlier study used INDA, a USD-denominated ETF tracking MSCI India. The current study uses the Sensex, which is the appropriate benchmark for an Indian investor measuring local-currency returns. The earlier significance (t=3.55) was partly driven by the INDA comparison, which incorporates USD/INR movements and index construction differences.
Small sample for dip_10. 48 events in the sharp dip category is too few for reliable conclusions.
BSE removed. The original 467-event sample included BSE and NSE. Removing BSE to eliminate dual-listing overlap leaves 317 NSE-only events. The two sets aren't comparable.
Takeaway
The previous finding of +2.54%** at T+63 was measured vs INDA, a USD-denominated ETF. Measured vs the local Sensex, the result drops to +1.01% (t=1.11), well below significance. The data is too concentrated in one bull-market period (2023–2025) to draw structural conclusions.
India is now in the same category as Canada, Germany, Hong Kong, and Korea: a market where the beat-and-dip pattern shows positive direction at T+63 but doesn't cross the significance threshold. Taiwan, by contrast, shows a stronger and more significant result under local-benchmark measurement. The India/Taiwan split is now clearer.
Check back as the India pipeline data matures. If the signal holds across a full market cycle including a downturn, it becomes more credible. It doesn't hold yet.
Part of a series: Post-earnings dip mean reversion tested across 11 exchanges. See US, Taiwan, and the global comparison.
Data: FMP earnings surprises + adjusted prices, 2000–2025 (94% of events 2022 or later). NSE only. Market cap > ₹20B. 317 beat-and-dip events. CAR vs Sensex (^BSESN), measured from T+1 close.
Past performance does not guarantee future results. This is educational content, not investment advice.

