
Hard Assets, Bigger Returns: P/TBV in India (2000-2025)
India's listed companies are built on physical capital: steel, cement, chemicals, engineering. A P/TBV screen on NSE large-caps returned 14.64% CAGR over 25 years versus 12.06% for the Sensex, with a down capture of 37.2%, meaning the strategy absorbed about a third of the benchmark's downside.

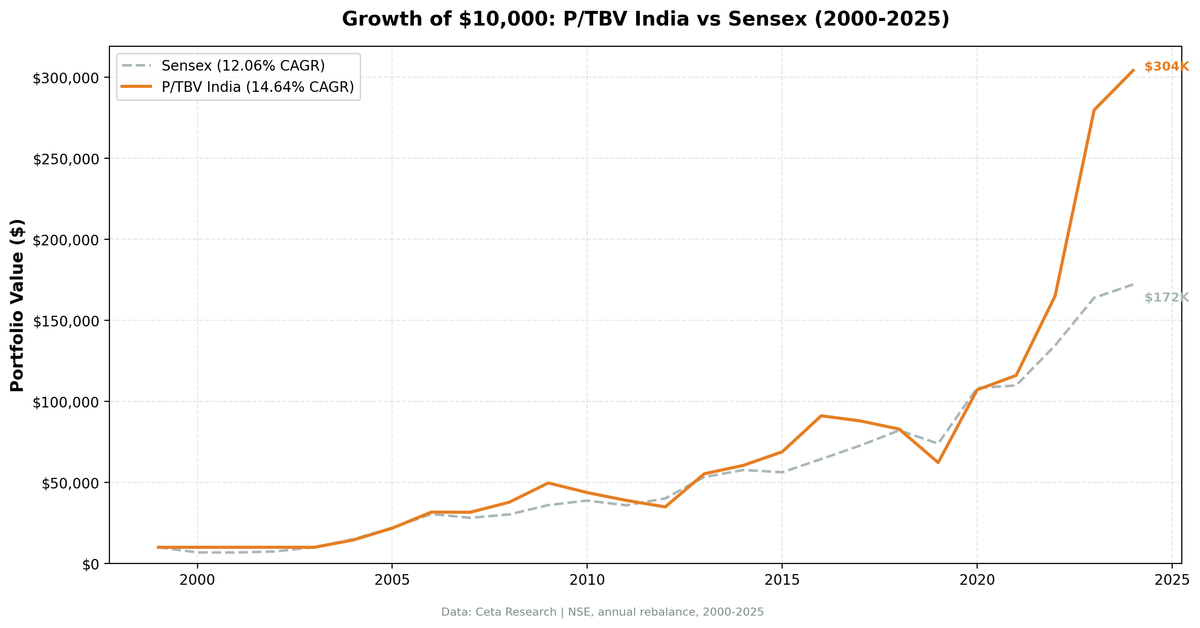
India's equity market is built on physical capital. Steel, cement, chemicals, engineering, infrastructure. The companies that dominate the NSE have accumulated decades of tangible assets on their balance sheets, and markets have persistently underpriced them relative to book. A P/TBV screen on Indian large-caps returned 14.64% CAGR over 25 years, beating the Sensex's 12.06% by 2.58 percentage points annually. The down-capture ratio of 37.2% vs the Sensex means the strategy absorbed about a third of the benchmark's losses during down years.
Contents
- Part of a Series
- The Strategy
- Why India and P/TBV Fit
- What We Found
- Annual Returns
- The Current Screen
- Limitations
Data: FMP financial data warehouse, 2000–2025. Updated June 2026.
Part of a Series
This post covers the India results. For full methodology, parameter rationale, and the US results (11.31% CAGR, 3.9% down capture), see the US backtest.
The Strategy
P/TBV strips goodwill and intangibles from book value, leaving only physical assets net of liabilities:
P/TBV = Market Cap / (Total Stockholders' Equity − Goodwill − Intangible Assets)
The quality filters prevent buying distressed or capital-destroying companies:
| Parameter | Value |
|---|---|
| Signal | P/TBV ascending (lowest = cheapest) |
| Quality filters | ROE > 8%, ROA > 3%, OPM > 10% |
| Rebalance | Annual, July (45-day filing lag) |
| Selection | Top 30 by P/TBV, equal weight |
| Minimum stocks | 10 (else hold cash) |
| Market cap floor | ₹20B (~$240M USD) |
| Universe | NSE |
| Period | 2000-2025 (25 years) |
| Benchmark | Sensex |
Why India and P/TBV Fit
In the US, the largest companies by market cap are software, platforms, and pharma. Their value is in brand, code, and IP. Intangibles dominate. P/TBV works in the US, but the universe is naturally constrained because many of the biggest companies fail the tangible equity screen.
India's public company universe is different. Listed companies are concentrated in banking, manufacturing, industrials, materials, and energy. These sectors carry large physical asset bases on their balance sheets. A steel company that built capacity twenty years ago has a balance sheet value for that plant that reflects depreciated historical cost. Current replacement cost may be three times higher. P/TBV finds these gaps.
This structural difference explains why P/TBV generates the highest absolute CAGR of any exchange in our 15-market study. The 14.64% compound return reflects both India's secular growth and the factor premium from selecting cheap, quality hard-asset companies.
What We Found
The headline number is $10,000 growing to $304,000. The Sensex over the same 25 years grew $10,000 to $172,000. The compounding gap between 14.64% and 12.06% is modest on a per-year basis, but over 25 years that 2.58 percentage point edge compounds into a meaningful difference. It's driven by the factor premium from selecting cheap, quality hard-asset companies on top of India's already strong secular growth.
The down capture of 37.2% vs the Sensex means the strategy absorbed about a third of the benchmark's losses during down years. When the Sensex fell, the P/TBV portfolio took roughly 37 cents of damage for every dollar the index lost. 2008 is a clear example: the strategy returned +19.61% while the Sensex gained +7.27%. The quality filters and hard-asset focus provide a buffer, though not immunity, during market stress.
2004-2006 was the early payoff: +45.33%, +50.21%, +45.24% in three consecutive years. India was mid-manufacturing boom, with a large pool of qualifying cheap, profitable, asset-heavy companies that had been ignored through the 1990s. The strategy captured all of that.
2020-2023 tells a different story. After COVID, India's position as an alternative manufacturing hub to China accelerated. Supply chain relocation drove industrial investment. The 2020 return was +72.10%, the 2023 return was +69.40%. These aren't random. Tangible-asset companies in India were the direct beneficiaries of the structural shift in global manufacturing.
Cash in 2000-2003 avoided early volatility. The Indian market had fewer than 10 qualifying stocks at the ₹20B threshold in those years, so the strategy sat in cash for four consecutive years. The Sensex fell -31.63% in 2000 and -0.82% in 2001, then recovered with +9.63% in 2002 and +35.24% in 2003. The cash position helped in the early crash years but missed the 2003 recovery. That's the tradeoff with the minimum-stocks filter: it avoids concentrated bets when the qualifying universe is thin, but it can also leave returns on the table.
2019 was a global P/TBV underperformance year. The strategy fell -24.92% in India while the Sensex fell -9.98%. The same year, P/TBV strategies fell -32.67% in the US, -20.66% in Canada, -6.45% in the UK. This was the peak of the growth-vs-value divergence worldwide, driven by tech and platform companies with minimal tangible assets dominating index returns. India wasn't uniquely affected. The factor itself was being punished globally. The reversal that followed in 2020-2023 was also global.
The win rate of 64% against the Sensex reflects the strategy's consistency. The strategy beats the Sensex in nearly two-thirds of years. The wins tend to cluster in recovery and expansion years (2004-2006, 2008-2009, 2020, 2022-2023) when cheap hard-asset companies get repriced upward.
Annual Returns
| Year | Strategy | Sensex | Vs. Benchmark |
|---|---|---|---|
| 2000 | 0% (Cash) | -31.63% | +31.63% |
| 2001 | 0% (Cash) | -0.82% | +0.82% |
| 2002 | 0% (Cash) | +9.63% | -9.63% |
| 2003 | 0% (Cash) | +35.24% | -35.24% |
| 2004 | +45.33% | +49.41% | -4.08% |
| 2005 | +50.21% | +46.51% | +3.69% |
| 2006 | +45.24% | +38.87% | +6.37% |
| 2007 | -0.27% | -7.71% | +7.44% |
| 2008 | +19.61% | +7.27% | +12.34% |
| 2009 | +31.42% | +19.12% | +12.31% |
| 2010 | -11.94% | +7.75% | -19.69% |
| 2011 | -11.03% | -7.52% | -3.50% |
| 2012 | -10.34% | +11.87% | -22.21% |
| 2013 | +58.62% | +32.77% | +25.86% |
| 2014 | +9.29% | +8.14% | +1.15% |
| 2015 | +13.88% | -2.39% | +16.27% |
| 2016 | +32.22% | +14.45% | +17.77% |
| 2017 | -3.45% | +12.95% | -16.39% |
| 2018 | -5.74% | +12.91% | -18.65% |
| 2019 | -24.92% | -9.98% | -14.94% |
| 2020 | +72.10% | +46.43% | +25.67% |
| 2021 | +8.30% | +1.43% | +6.87% |
| 2022 | +42.31% | +22.49% | +19.82% |
| 2023 | +69.40% | +21.83% | +47.57% |
| 2024 | +8.73% | +5.00% | +3.74% |
Cash years (2000-2003) show 0% return as the strategy held cash due to fewer than 10 qualifying stocks at the ₹20B threshold.
The Current Screen
The live screen for US markets uses the same logic adapted for Indian exchanges. For India, swap the exchange filter to p.exchange = 'NSE' and set the market cap threshold to k.marketCap > 20000000000 (₹20B; market caps are stored in local currency per exchange).
Live India screen: cetaresearch.com/data-explorer?q=Z1gWp8ikAJ
Full SQL and live results for the US universe: cetaresearch.com/data-explorer?q=5GCSAfLr-m
Limitations
The 14.64% CAGR includes India's exceptional growth decades. The Indian economy grew at 6-8% real GDP through much of this period, with favorable demographics and a manufacturing sector catching up to global standards. That tailwind won't repeat identically. The Sensex itself returned 12.06% over this period, so the strategy's edge is 2.58 percentage points, not the full 14.64%.
The Sharpe ratio of 0.297 is lower than the US result (0.48). The strategy is more volatile in India: the +72% and +69% years also come with -25% years. Investors who couldn't hold through 2019's -24.92% would have sold at the bottom before the 2020-2023 run.
The 2010-2012 stretch (consecutive negative or flat years) reflects a period of Indian macro tightening and global risk-off. P/TBV strategies can underperform for 2-3 year stretches even when the 25-year thesis is valid.
Minimum 10 stocks rule means the strategy sits in cash for four years (2000-2003). The cash position was favorable in 2000-2001 when the Sensex fell, but costly in 2003 when the Sensex surged +35.24%. A longer data series or a lower threshold might change the early-period dynamics.
Survivorship bias applies: companies that were delisted or failed during the period aren't fully captured in the exit returns.
Data: Ceta Research (FMP financial data warehouse), 2000-2025. Full methodology: backtests/METHODOLOGY.md
Past performance does not guarantee future results. This is educational content, not investment advice.


