
P/TBV Strategy in Sweden: How Hard Assets Outran the S&P 500 Over 25

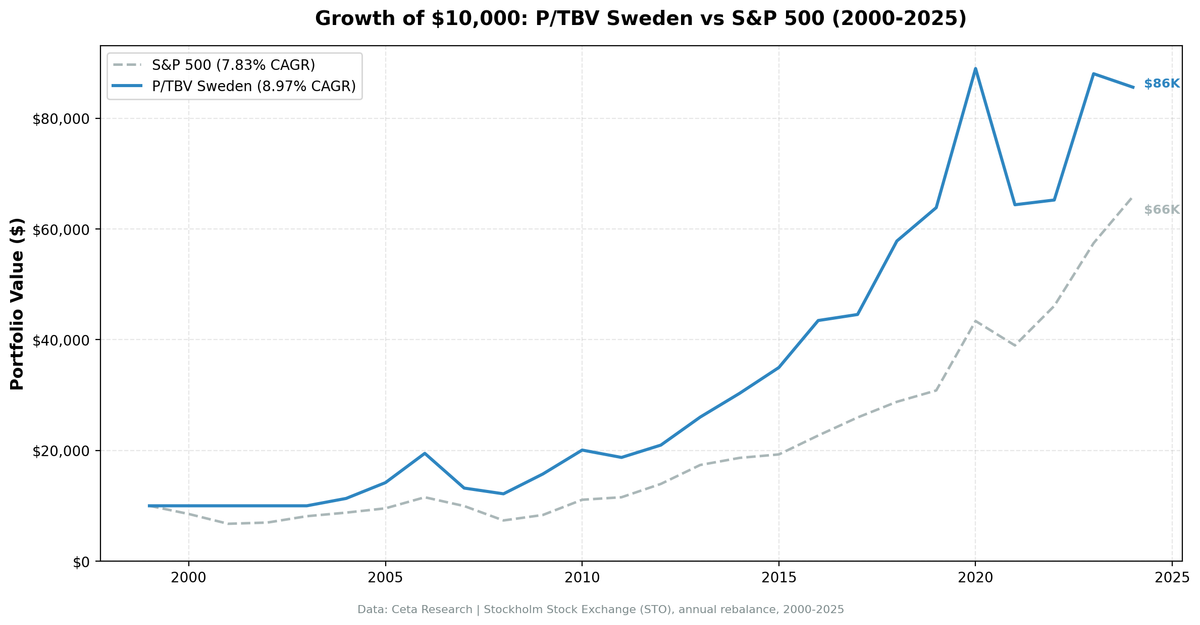
Swedish industrial companies, sorted by the ratio of market cap to tangible book value, returned 8.97% annually from 2000 to 2024, beating the S&P 500 by 1.14 percentage points. The strategy spent four years in cash at the start, which accidentally sidestepped the dot-com crash, and then compounded steadily on the back of Nordic industrials. The down capture of 79% means this isn't a hedge against US downturns, but the excess return and crisis performance in 2008 make it a legitimate diversifier.
Contents
- What the Strategy Does
- The Cash Years (2000-2003)
- Annual Returns
- The 2008 Story
- The Problem Years
- 2018: Swedish Industrials in a Capex Cycle
- Full Backtest Statistics
- Why Sweden Works for P/TBV
- What This Means for a Portfolio
- Current Screen
- Limitations
What the Strategy Does
We screen the Stockholm Stock Exchange for companies with a P/TBV (price to tangible book value) below the market median, apply three quality filters (ROE > 8%, ROA > 3%, operating margin > 10%), then hold the 30 cheapest qualifying stocks by P/TBV, rebalancing each July. The market cap floor is 5 billion SEK (roughly $460M USD). P/TBV strips goodwill and intangibles from the denominator, leaving only physical and financial assets, which suits a market dominated by manufacturers, banks, and engineering companies.
The academic basis comes from Fama and French (1992), who found that book-to-market ratio is one of the most reliable long-run predictors of equity returns. Tangible book goes further: it avoids the distortions that goodwill and acquired intangibles create in standard P/B ratios.
The Cash Years (2000-2003)
The strategy held no position from 2000 through 2003. The qualifying universe on the Stockholm exchange didn't reach 10 stocks at the 5B SEK threshold until 2004, when Swedish industrials had accumulated enough FY reporting history in the FMP database to pass the quality filters.
That turned out to be a windfall. The S&P 500 fell 14.78% in 2000, 20.77% in 2001, and 3.29% in 2002. Sweden's market wasn't immune either, but the strategy was entirely in cash. When the universe finally hit the minimum threshold in 2004, it entered on clean footing.
This isn't a repeatable advantage. It's path-dependent luck from the data coverage timeline. We're noting it because it explains why the cumulative chart looks unusually strong in the early years.
Annual Returns
| Year | Sweden P/TBV | SPY | Difference |
|---|---|---|---|
| 2000 | 0% (cash) | -14.78% | +14.78% |
| 2001 | 0% (cash) | -20.77% | +20.77% |
| 2002 | 0% (cash) | +3.29% | -3.29% |
| 2003 | 0% (cash) | +16.44% | -16.44% |
| 2004 | +13.29% | +7.94% | +5.35% |
| 2005 | +25.21% | +8.86% | +16.35% |
| 2006 | +37.27% | +20.95% | +16.32% |
| 2007 | -32.20% | -13.71% | -18.49% |
| 2008 | -7.86% | -26.14% | +18.28% |
| 2009 | +29.40% | +13.42% | +15.98% |
| 2010 | +27.48% | +32.94% | -5.46% |
| 2011 | -6.64% | +4.10% | -10.74% |
| 2012 | +11.89% | +20.85% | -8.96% |
| 2013 | +24.14% | +24.50% | -0.36% |
| 2014 | +16.47% | +7.38% | +9.09% |
| 2015 | +15.41% | +3.36% | +12.05% |
| 2016 | +24.27% | +17.73% | +6.54% |
| 2017 | +2.50% | +14.34% | -11.84% |
| 2018 | +29.80% | +10.91% | +18.89% |
| 2019 | +10.42% | +7.12% | +3.30% |
| 2020 | +39.34% | +40.68% | -1.34% |
| 2021 | -27.65% | -10.17% | -17.48% |
| 2022 | +1.33% | +18.31% | -16.98% |
| 2023 | +34.97% | +24.60% | +10.37% |
| 2024 | -2.77% | +14.67% | -17.44% |
The 2008 Story
This year stands out. While the S&P 500 fell 26.14%, Swedish P/TBV stocks lost only 7.86%. That's a 18-point swing in favor of the strategy during the worst financial crisis in decades.
The reason is structural. Swedish industrials like SSAB, Atlas Copco, and SKF held hard assets: steel mills, machine tools, precision manufacturing equipment. When markets panicked in 2008, these businesses kept generating cash. They weren't leveraged to US mortgage exposure. Their book values didn't evaporate. The P/TBV screen had selected the cheapest among already-tangible companies, so there was limited valuation air to let out.
This wasn't luck. Industries with physical asset bases, conservatively priced relative to those assets, held up. It's what the P/TBV signal is supposed to do.
The Problem Years
2007 was brutal: -32.20% vs SPY -13.71%. The year before the crisis, global risk appetite pushed growth stocks higher while value companies lagged. Sweden's manufacturing sector didn't benefit from the same momentum, and some holdings started repricing early as credit conditions tightened in Europe.
2021 was the worst relative year: -27.65% vs SPY -10.17%. This is the mirror image of 2008. Peak QE, meme stocks, high-multiple tech dominating returns. Low-P/TBV industrials and materials companies were exactly what the market didn't want that year. Growth-at-any-price won. Value lost badly across most markets, not just Sweden.
2024 showed -2.77% vs SPY +14.67%, a 17-point gap. Nordic industrials faced headwinds from slowing European manufacturing activity and a strong dollar. The screen still had 25+ stocks, the quality filters still worked, but the macro environment just didn't favor the holdings.
These three years reflect an honest weakness: when global sentiment strongly favors growth over value, the strategy underperforms. That's not a flaw in the construction. It's the nature of any value-tilted approach.
2018: Swedish Industrials in a Capex Cycle
One more year worth examining. In 2018, the strategy returned +29.80% vs SPY +10.91%. The global capital expenditure cycle was running hot. Companies like Volvo, Sandvik, and Atlas Copco, all candidates for a low-P/TBV industrial screen, benefited from strong equipment orders from Asia and Europe. The tangible book screen captured the cheap end of this cycle, and those holdings delivered.
This is the positive version of the commodity trap that hurts Canada (discussed separately). When the real economy is spending on hard infrastructure, low-P/TBV industrials outperform. The 2018 year is a clean example.
Full Backtest Statistics
| Metric | Value |
|---|---|
| CAGR (2000-2024) | 8.97% |
| SPY CAGR | 7.83% |
| Excess return | +1.14% |
| Sharpe ratio | 0.370 |
| Max drawdown | -37.53% |
| Up capture | 106.84% |
| Down capture | 79.14% |
| Beta | 0.827 |
| Alpha | 2.14% |
| Invested periods | 21 of 25 years |
| Avg stocks held | 25.3 |
| Cash periods | 4 (2000-2003) |
The up capture of 106.84% means the strategy captures more than 100% of SPY's positive years. That's unusual for a value strategy and reflects Swedish industrials' sensitivity to global growth cycles. The 79.14% down capture is the trade-off. This isn't a defensive posture.
Why Sweden Works for P/TBV
Sweden's economy is built on industrials, materials, and financials. Ericsson is the outlier, but the market's weight is in Volvo, SSAB, Sandvik, Hexagon, SKF, SEB, Handelsbanken. These companies hold real assets: factories, equipment, loan books with collateral. Stripping goodwill from book value doesn't destroy their balance sheets the way it would for a pharmaceutical company or a consumer brand.
The quality filters matter here. Without ROE > 8% and ROA > 3%, the screen would include distressed industrials with cheap book values for bad reasons. The filters ensure we're buying cheap-relative-to-assets companies that are still generating returns, not just buying the cheapest balance sheets in the market.
What This Means for a Portfolio
Sweden adds 1.14% annual excess return vs SPY with a beta of 0.827. It's not perfectly correlated with US markets, which provides some diversification value. But the 79% down capture means you shouldn't hold it as protection against US drawdowns. You hold it for the compound return over time, not for the downside insulation.
The 2000-2003 cash period was fortuitous but not structural. If you'd started this strategy in 2001 with a universe that cleared 10 stocks, the early years would look different. Treat the cash period as historical artifact, not repeatable design.
Over 25 years, $100K grows to roughly $856K at 8.97% CAGR vs $653K at SPY's 7.83%. The 1.14% difference adds up.
Current Screen
The live P/TBV screen for Stockholm-listed companies is available at cetaresearch.com/data-explorer. Run the query yourself: which Swedish industrials currently trade below the median tangible book multiple while clearing the quality filters.
Limitations
The 4-year cash period from 2000-2003 is the largest data artifact in this backtest. It inflates cumulative returns because it happened to coincide with the dot-com crash. We can't replicate that coincidence.
Mktcap threshold of 5B SEK is modest. Some microcap distortion is possible in thin years when the universe sits at 10-15 stocks. The avg of 25.3 stocks per invested period mitigates this, but the early invested years (2004-2006) had thinner coverage.
Currency: all returns are local currency (SEK). For USD-based investors, SEK/USD fluctuations add a layer of variance not captured here.
Part of a Series: Global | US | UK | India | Germany | China | Canada
Data: Ceta Research (FMP financial data warehouse), 2000-2024. Universe: Stockholm Stock Exchange, mktcap > 5B SEK. Annual rebalance, July. Equal weight, top 30 by P/TBV ascending.


