
Small-Cap Growth in Germany: Slightly Below DAX (-0.25%/yr), Well Below SPY (-3.06%/yr)
German small-cap growth stocks returned 4.79% CAGR over 25 years, slightly trailing DAX by -0.25%/yr and SPY by -3.06%/yr. With 47% down capture and 74% up capture versus DAX, the strategy had correct asymmetry but a weak benchmark.

CAGR: 4.79% | Excess: -0.25%/yr vs DAX, -3.06%/yr vs SPY | Sharpe: 0.125 | Max Drawdown: -44.68% | Win Rate: 52% vs both
Contents
- The Method
- What We Found
- Annual Returns
- Why Germany Underperforms
- The 2004-2016 Case for the Strategy
- When It Fails
- Limitations
- Run It Yourself
- Takeaway
- References
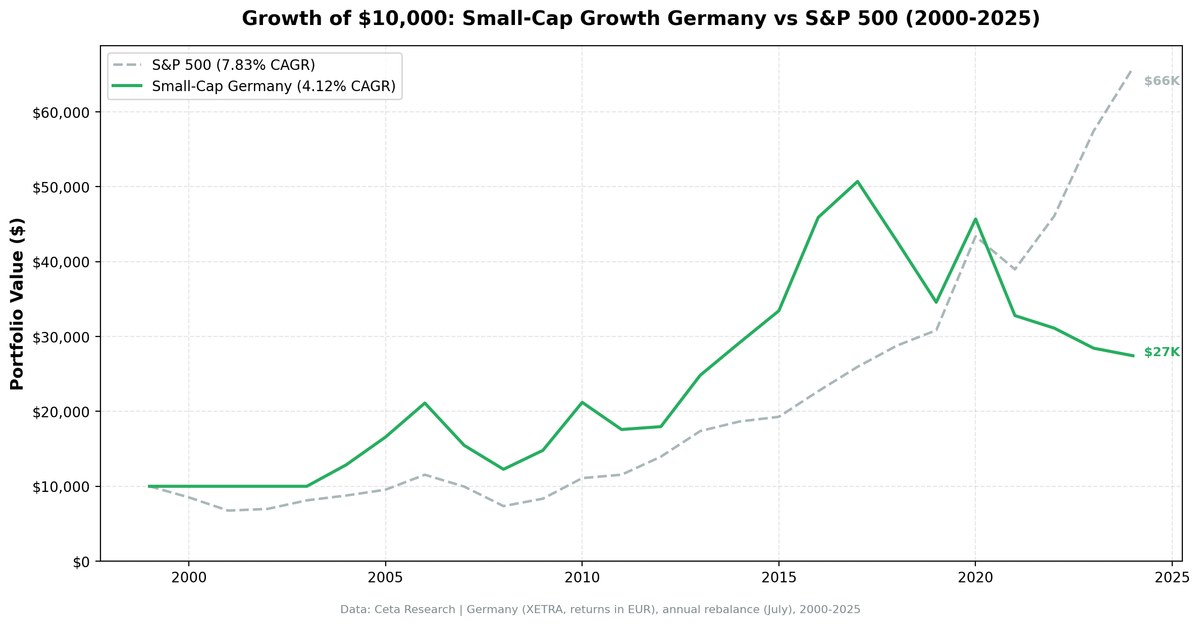
Germany's result is the developed-market underperformance story. The strategy returned 4.79% CAGR over 25 years, slightly trailing the DAX at 5.04% (-0.25%/yr) and meaningfully trailing SPY (-3.06%/yr). $10,000 became $32,203. The DAX turned it into $34,186. SPY turned it into roughly $78,500.
The Sharpe ratio of 0.125 is barely positive. The DAX returned 0.144, and SPY returned 0.360. Risk-adjusted, the strategy added almost no value.
What makes Germany particularly instructive is the return structure. 74% up capture and 47% down capture versus DAX. The strategy earns roughly three-quarters of the bull market gains but loses only half of the bear market losses. That's the correct asymmetry. But the DAX itself was weak (5.04% CAGR), so beating it on risk-adjusted terms doesn't produce meaningful absolute returns.
Data: FMP financial data warehouse, 2000–2025. Updated March 2026.
The Method
We screened XETRA-listed stocks each July for:
- Market cap between €25M and €1B
- Revenue growth >15% year-over-year (most recent fiscal year)
- Positive net income
- Debt/equity ratio below 2.0
Top 30 by revenue growth, equal-weight, rebalanced annually in July with a 45-day filing lag. The portfolio had four cash years (2000-2003) when the qualifying universe was too thin. Active years: 21 (2004-2024).
What We Found
47% down capture versus DAX is the defining number. When German equities fell, this portfolio lost less than half as much. When they rose, it captured 74%. That's the right asymmetry for a defensive small-cap strategy. But the DAX itself was weak at 5.04% CAGR, so the asymmetry doesn't produce alpha in absolute terms.
52% win rate: a coin flip with near-zero expectation. The strategy beat the DAX in 11 of 21 active years. The years it lost, it typically lost by more than the years it won. 2022 was the worst excess year versus DAX: -30.57 percentage points. The strategy returned -4.68% while the DAX returned +25.89%. That's the worst excess return year in the sample.
Four cash years (2000-2003). The XETRA universe didn't have enough qualifying small-cap growth companies in the early 2000s to run the strategy. That period covered the dot-com bust, and Germany's small-cap sector was thin. The strategy only began investing in 2004. The DAX comparison also starts in 2004 for apples-to-apples matching.
Post-2017 collapse. Five of the last seven years (2018-2024) produced negative absolute returns: 2018 (-16.04%), 2019 (-11.28%), 2021 (-29.38%), 2023 (-9.18%), 2024 (-1.39%). That's not noise. It's a structural shift in how German small-cap growth companies have performed in the post-peak manufacturing era.
Annual Returns
| Year | Strategy | DAX | Excess vs DAX |
|---|---|---|---|
| 2000 | 0.00% | -12.21% | +12.21% |
| 2001 | 0.00% | -31.32% | +31.32% |
| 2002 | 0.00% | -22.76% | +22.76% |
| 2003 | 0.00% | +23.38% | -23.38% |
| 2004 | +30.59% | +15.62% | +14.97% |
| 2005 | +30.94% | +23.56% | +7.38% |
| 2006 | +30.25% | +39.31% | -9.06% |
| 2007 | -26.38% | -20.77% | -5.61% |
| 2008 | -24.86% | -25.17% | +0.31% |
| 2009 | +22.69% | +23.64% | -0.95% |
| 2010 | +44.11% | +27.58% | +16.53% |
| 2011 | -17.25% | -12.72% | -4.53% |
| 2012 | +1.94% | +21.78% | -19.84% |
| 2013 | +38.95% | +25.29% | +13.66% |
| 2014 | +20.10% | +11.99% | +8.11% |
| 2015 | +14.11% | -12.53% | +26.63% |
| 2016 | +38.98% | +28.49% | +10.49% |
| 2017 | +10.08% | -1.90% | +11.98% |
| 2018 | -16.04% | +2.36% | -18.40% |
| 2019 | -11.28% | +0.65% | -11.94% |
| 2020 | +33.96% | +24.12% | +9.84% |
| 2021 | -29.38% | -18.38% | -11.00% |
| 2022 | -4.68% | +25.89% | -30.57% |
| 2023 | -9.18% | +14.26% | -23.44% |
| 2024 | -1.39% | +29.47% | -30.86% |
Best year: 2010 (+44.11%). Worst year: 2021 (-29.38%). Best excess return vs DAX: 2001 (+31.32%, cash year). Worst excess return vs DAX: 2024 (-30.86%).
Why Germany Underperforms
Germany's small-cap growth underperformance has specific structural explanations. It isn't random variance.
Germany's manufacturing economy creates the wrong small-cap composition. The German economy is built around industrial manufacturing, automotive supply chains, and precision engineering. Small-cap XETRA companies growing revenues >15% are often mid-tier industrial suppliers benefiting from cyclical demand spikes. That's not durable growth. It's cyclical revenue that reverses when the cycle turns. The profitability screen catches some of this, but not all.
Post-Ukraine energy costs. Since 2022, Germany has faced structurally higher energy costs following the severing of Russian gas supply. Energy-intensive small manufacturers, already running on tight margins, faced cost inflation that didn't show up in the revenue growth screen but did show up in subsequent earnings. The 2021 (-29.38%), 2022 (-4.68%), 2023 (-9.18%), and 2024 (-1.39%) results reflect this transition.
The small-cap premium has been arbitraged. Germany has a sophisticated institutional investor base and deep integration with European capital markets. Van Dijk (2011) documented the declining size premium in developed markets specifically: institutional arbitrage over the past two decades has compressed the premium that Banz (1981) found in 1970s data. Germany, as one of Europe's most liquid markets, has experienced more of this compression than emerging markets.
Sector concentration without commodity cycle support. Unlike Canada, where small-cap growth is tied to commodity cycles that can deliver outsized returns in the right environment, German small-cap growth is tied to European industrial cycles. European industrial output has been structurally weaker than US growth post-2010. The strategy concentrates into a sector without a natural secular tailwind.
The 2004-2016 window was the exception, not the rule. The early active years were strong: 2004 (+30.59%), 2005 (+30.94%), 2006 (+30.25%), 2010 (+44.11%), 2013 (+38.95%), 2016 (+38.98%). That 12-year window looked like a working strategy. The post-2017 deterioration reflects a structural shift, not bad luck.
The 2004-2016 Case for the Strategy
It's worth documenting what worked, because the 2004-2016 period looked compelling at the time.
Germany's post-reunification economy finally found its footing in the mid-2000s. The Hartz labor reforms (2003-2005) reduced structural unemployment and made German manufacturing more competitive. Small industrial companies growing revenues at >15% in that environment were genuine growth stories tied to German export strength.
2010 (+44.11%) and 2013 (+38.95%) were particularly strong, capturing the post-GFC recovery and the European recovery from sovereign debt crisis. 2016 (+38.98%) caught the global reflation trade.
In that window, the small-cap growth screen was identifying companies at the right point in Germany's industrial recovery. The screen worked because the underlying economic conditions were right: export-driven growth, improving margins, and cheap financing.
Those conditions haven't returned. Germany's export machine has faced headwinds from China slowdown, energy cost shocks, and structural transition away from combustion-engine automotive production (a core German industry).
When It Fails
Supply chain disruption and energy shocks. 2021 and 2022-2024 directly reflect how Germany's small industrial sector absorbs macro shocks. Small manufacturers can't pass through input cost increases the way large integrated companies can. Revenue growth >15% doesn't insulate against margin collapse.
European macro weakness. The post-2017 period has seen European GDP growth consistently lag the US. In a slower-growth environment, revenue growth >15% becomes harder to sustain, and the companies that pass the screen in a given year often fail the screen (and post negative returns) the following year.
2019 (-11.28%). Global trade tensions and slowing German auto production hit small XETRA manufacturers hard. The year before the COVID shock, the strategy was already in decline. The DAX returned +0.65% that year, so the strategy underperformed by -11.94%.
Limitations
The 4.79% CAGR isn't zero, but against a 5.04% DAX and 7.85% SPY benchmark, it's a shortfall. Four cash years (2000-2003) reduce the sample, but even in 21 active years the underperformance versus SPY is consistent. Versus DAX, the strategy is statistically a wash.
The -44.68% maximum drawdown is among the deeper drawdowns in our 14-exchange study. The DAX's max drawdown was -53.43%, so the strategy did protect on the downside, but investors deploying capital into German small-cap growth would have faced a significant sustained loss period.
The XETRA universe has specific liquidity characteristics. Small German companies in the €25M-€200M range can have limited trading volume and wide spreads. The backtest uses end-of-day prices without modeling transaction costs.
Run It Yourself
The full screen definition and SQL are in our US flagship post. The Germany version applies the same screen to XETRA with €25M-€1B market cap bounds.
Query the underlying data at Ceta Research.
Takeaway
Germany and the UK share a pattern: developed European markets where the small-cap growth premium has eroded. Germany slightly underperformed the DAX (-0.25%/yr) but beat it on risk-adjusted terms (47% down capture). The UK beat the FTSE 100 more decisively (+4.04%/yr). Germany has deeper drawdowns (-44.68% vs UK's -23.15%) and 5 negative years in the last 7.
The 2004-2016 window showed the strategy can work when Germany's industrial economy is in an expansion phase. That phase ended. Post-2017 Germany has faced energy shocks, trade disruption, auto sector transition, and structurally weaker growth, and the small-cap screen reflects all of it.
The factor premia documented in the academic literature assume conditions that Germany's current economic environment doesn't consistently provide. Small-cap growth companies growing revenues at >15% in Germany today are rare, often cyclical, and face a different set of macro headwinds than in 2004-2016.
The honest conclusion: German small-cap growth matched the DAX on a risk-adjusted basis but didn't add meaningful alpha. The historical data shows why, and the recent years confirm the trend.
References
- Banz, R. (1981). "The Relationship Between Return and Market Value of Common Stocks." Journal of Financial Economics, 9(1), 3-18.
- Fama, E. & French, K. (1992). "The Cross-Section of Expected Stock Returns." Journal of Finance, 47(2), 427-465.
- Fama, E. & French, K. (1993). "Common Risk Factors in the Returns on Stocks and Bonds." Journal of Financial Economics, 33(1), 3-56.
- Van Dijk, M. (2011). "Is size dead? A review of the size effect in equity returns." Journal of Banking & Finance, 35(12), 3263-3274.
Data: Ceta Research (FMP financial data warehouse), 2000-2025. Full methodology: METHODOLOGY.md. Past performance does not guarantee future results. This is educational content, not investment advice.


