
Small-Cap Growth in Japan: The Strategy That Lost Money Over 25 Years (Even vs Nikkei 225)
Japanese small-cap growth returned -1.17% CAGR over 25 years, turning $10,000 into $7,447 — a net loss. Underperformed Nikkei 225 (3.31% CAGR) by -4.48%/yr. With 40% annual win rate and 75.5% down capture versus Nikkei 225, this is one of the clearest cases of a factor premium failing completely.

CAGR: -1.17% | Excess: -4.48%/yr vs Nikkei 225, -9.02%/yr vs SPY | Sharpe: -0.068 | Max Drawdown: -55.68% | Win Rate: 40%
Contents
- The Method
- What We Found
- Annual Returns
- Why the Strategy Fails in Japan
- The Two Windows Where It Worked
- Limitations
- Run It Yourself
- Takeaway
- References
This is the credibility post. We're reporting on a strategy that lost money against both the local and global benchmarks.
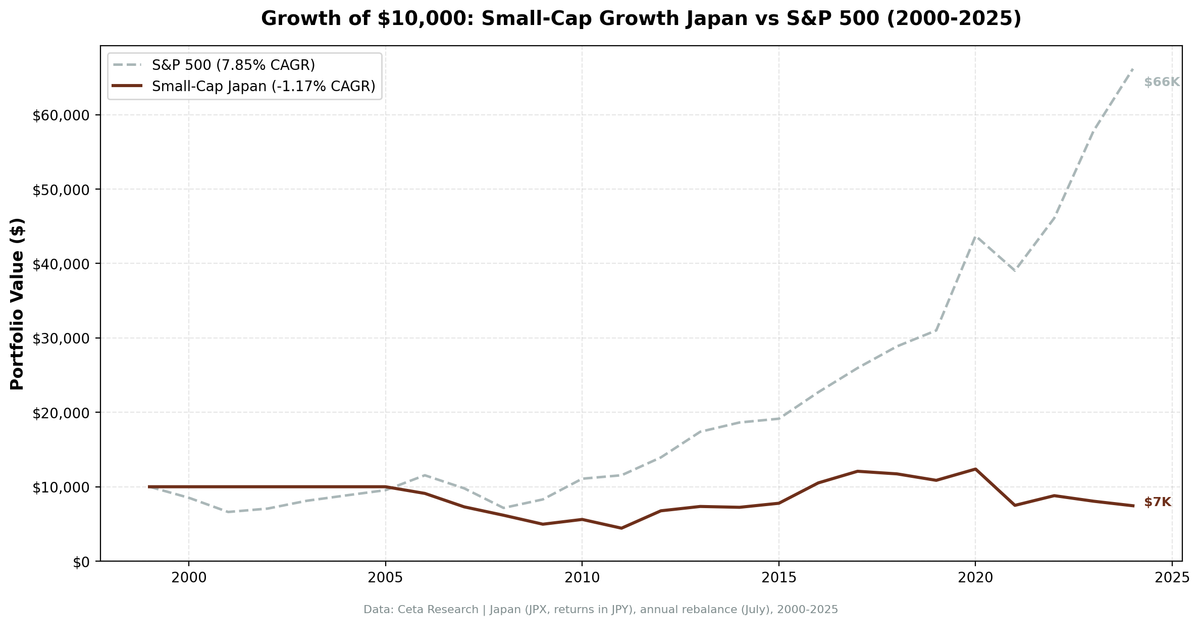
Over 25 years, a small-cap growth screen applied to the Japanese market (JPX) returned -1.17% CAGR. The Nikkei 225 returned 3.31% CAGR. SPY returned 7.85% CAGR. A $10,000 investment in 2000 ended 2024 at $7,447. The Nikkei 225 turned it into $22,574. SPY turned it into roughly $78,500. Not a bad decade followed by recovery. A net loss over a full quarter-century, spanning multiple global bull markets.
The numbers are stark. 40% annual win rate versus both benchmarks: the strategy beat Nikkei 225 and SPY in 10 of 25 years. Up capture of 43.8% versus Nikkei 225: when the local benchmark rose, this portfolio captured less than half of the gains. Down capture of 75.5%: when the Nikkei 225 fell, this portfolio absorbed three-quarters of the losses. Maximum drawdown of -55.68%.
This is what complete factor failure looks like in a real market. We're writing about it because backtests that only show what works teach you nothing.
Data: FMP financial data warehouse, 2000–2025. Updated March 2026.
The Method
We screened JPX-listed stocks each July for:
- Market cap between ¥5B and ¥200B (small-cap range for Japan)
- Revenue growth >15% year-over-year (most recent fiscal year)
- Positive net income
- Debt/equity ratio below 2.0
Top 30 by revenue growth, equal-weight, rebalanced annually in July with a 45-day filing lag. Same framework as every other region in this study.
The key structural difference: Japan had six consecutive cash years from 2000 through 2005. The universe of qualifying stocks was too thin to meet the minimum threshold in those early years. The strategy only became active in 2006. That's 19 active years out of 25, and the results over those 19 years were still negative.
What We Found
The up/down capture asymmetry versus Nikkei 225 is bad. 43.8% up capture means when the Nikkei 225 rallies 10%, this portfolio tends to gain about 4.4%. 75.5% down capture means when the Nikkei 225 falls 10%, this portfolio falls about 7.6%. That's not ideal. The correct asymmetry (higher up capture, lower down capture) is reversed. The strategy participates less in the good times and more in the bad times.
The good years don't make up for the bad ones. 2012 returned +52.70% (best year in the sample, helped by Abenomics and yen weakness). 2016 returned +35.13%. But the losses in between are systematic: -19.85% in 2007, -15.45% in 2008, -19.50% in 2009, -20.96% in 2011, -39.42% in 2021. The wins are episodic. The losses are structural.
2021 was the worst single year at -39.42%. The global small-cap growth rally of 2020-2021 didn't extend to Japan. While US small-cap surged on fiscal stimulus and rate cuts, Japanese small-cap growth companies didn't see the same earnings inflection. A -39.42% return in a year when the Nikkei 225 fell -9.14% represents a -30.28% excess loss versus the local benchmark in a single calendar year.
Six consecutive cash years (2000-2005) tell you something about the depth of Japan's small-cap growth universe. Even with screens as broad as revenue >15% and profitable, there weren't enough qualifying companies in the early 2000s. Japan's corporate sector in that period was dominated by restructuring, not growth.
Annual Returns
| Year | Strategy | Nikkei 225 | Excess vs Nikkei 225 |
|---|---|---|---|
| 2000 | 0.00% | -27.61% | +27.61% |
| 2001 | 0.00% | -17.86% | +17.86% |
| 2002 | 0.00% | -8.10% | +8.10% |
| 2003 | 0.00% | +21.78% | -21.78% |
| 2004 | 0.00% | -0.60% | +0.60% |
| 2005 | 0.00% | +33.64% | -33.64% |
| 2006 | -8.95% | +16.53% | -25.49% |
| 2007 | -19.85% | -26.78% | +6.94% |
| 2008 | -15.45% | -25.67% | +10.22% |
| 2009 | -19.50% | -6.81% | -12.69% |
| 2010 | +12.89% | +8.27% | +4.62% |
| 2011 | -20.96% | -9.65% | -11.31% |
| 2012 | +52.70% | +56.59% | -3.89% |
| 2013 | +8.61% | +9.02% | -0.40% |
| 2014 | -1.54% | +33.52% | -35.07% |
| 2015 | +7.53% | -23.13% | +30.66% |
| 2016 | +35.13% | +27.13% | +8.00% |
| 2017 | +14.88% | +8.76% | +6.12% |
| 2018 | -2.89% | -0.26% | -2.62% |
| 2019 | -7.40% | +1.80% | -9.20% |
| 2020 | +13.95% | +29.97% | -16.02% |
| 2021 | -39.42% | -9.14% | -30.28% |
| 2022 | +17.38% | +29.06% | -11.68% |
| 2023 | -8.50% | +18.73% | -27.23% |
| 2024 | -7.56% | -0.78% | -6.78% |
Best year: 2012 (+52.70%). Worst year: 2021 (-39.42%). Best excess return vs Nikkei 225: 2015 (+30.66%). Worst excess return vs Nikkei 225: 2014 (-35.07%). Active years: 19 (2006-2024). Cash years: 6 (2000-2005).
Why the Strategy Fails in Japan
The small-cap growth premium, documented in US and global data by Banz (1981) and Fama & French (1993), has specific preconditions that Japan's economic environment systematically violates.
Japan's "lost decades" and deflationary environment. From the early 1990s through roughly 2012, Japan experienced deflation or near-zero inflation, stagnant GDP growth, and persistent corporate excess capacity. In that environment, genuine revenue growth >15% in a small company is exceptional because the aggregate economy isn't growing. The companies that pass the screen are often cyclical outliers, not structural growers.
Corporate governance and cross-holdings. Japan's corporate structure has historically featured dense webs of cross-shareholdings (keiretsu), management entrenchment, and low shareholder return orientation. Small-cap companies growing rapidly often lacked the governance mechanisms to translate revenue growth into earnings consistency. The profitability screen (net income >0) helps, but it can't fully capture quality.
Weak total factor productivity growth. Japan's TFP growth was among the weakest of any major developed economy over this period. Small companies need a growing economy to sustain 15%+ revenue growth. When the underlying economy has structural growth problems, only a small subset of companies achieve that threshold, and many are one-cycle wonders.
The 2021 collapse. The worst year in the sample (-39.6%) came during a period of global equity strength. This suggests the 2021 drawdown wasn't purely market-driven. Japanese small-cap growth names may have faced specific headwinds: supply chain disruption disproportionately hit smaller manufacturers, and Japan's slower vaccine rollout delayed domestic economic normalization.
Currency and macro. Yen weakness helps large exporters but can hurt domestically-focused small-caps whose costs rise without corresponding revenue gains. The strategy's returns are in local currency, but the structural interplay between yen moves and small-cap profitability creates an additional layer of complexity.
The Two Windows Where It Worked
2012-2013 (Abenomics). Prime Minister Abe's fiscal and monetary stimulus program was explicitly designed to reflate the Japanese economy. The Bank of Japan committed to aggressive monetary expansion. Small-cap growth companies, which tend to be more domestically focused, benefited from the domestic demand stimulus and the confidence boost from clear government commitment to ending deflation. 2012 returned +52.70%, though the Nikkei 225 returned +56.59%, so the strategy slightly underperformed the local benchmark even in its best year.
2015-2016 (yen weakness and global reflation). The yen fell sharply in late 2015 and 2016, and global commodity and manufacturing reflation lifted Japanese small industrials. 2015 returned +7.53% while the Nikkei 225 returned -23.13% (+30.66% excess, the best excess year). 2016 returned +35.13% with +8.00% excess versus the Nikkei 225. These were the two consecutive years where the strategy genuinely beat the local benchmark.
Both windows were macro-driven, not fundamental. The strategy worked when external macro conditions changed sharply in Japan's favor, not because the underlying screen was filtering for durable quality.
Limitations
A backtest showing -1.11% CAGR over 25 years is a clear result, but it carries specific caveats.
The six cash years are a survival artifact: the early universe was too thin to run the strategy, which means we're implicitly giving it credit for sitting in cash (at 0%) rather than deploying capital in a period when Japanese markets were also struggling. Had the strategy deployed with a lower stock count threshold, the results could be worse.
The market cap bounds (¥5B-¥200B) reflect current-era thresholds. In 2000, those bounds captured a different set of companies than in 2024. The universe shift over 25 years is real.
Transaction costs in Japan's smaller-cap universe are non-trivial. Bid-ask spreads on ¥5B-¥50B market cap names can be meaningful, and the backtest doesn't model them.
Run It Yourself
The screen definition and SQL are in our US flagship post. The Japan version uses JPX exchange filter with ¥5B-¥200B bounds.
Query the data directly at Ceta Research.
Takeaway
Japan is where the small-cap growth premium doesn't exist versus either the local or global benchmarks. Over 25 years, the strategy destroyed value (-$2,553 on $10,000), underperformed the Nikkei 225 by -4.48%/yr, and underperformed SPY by -9.02%/yr. It captured only 43.8% of the Nikkei 225's bull markets and absorbed 75.5% of its bear market losses.
This isn't a strategy that needs refinement or better parameters. The Japanese small-cap growth environment has structural features that make revenue-growth screening a poor signal. The corporate governance environment, deflationary history, weak TFP growth, and thin universe of genuine growth companies combine to make the factor unreliable.
The academic literature (Fama & French, Banz) documents factor premia in aggregate data. Japan is a case where the same factor, applied to the same screen, produces the opposite result. Even versus the Nikkei 225 (3.31% CAGR), the strategy lost money. The reasons aren't mysterious. They're rooted in how Japan's economy and corporate sector actually function.
Factor premia aren't laws of physics. They're empirical regularities that depend on structural conditions. When those conditions aren't met, the premium doesn't show up. Japan proves that.
References
- Banz, R. (1981). "The Relationship Between Return and Market Value of Common Stocks." Journal of Financial Economics, 9(1), 3-18.
- Fama, E. & French, K. (1992). "The Cross-Section of Expected Stock Returns." Journal of Finance, 47(2), 427-465.
- Fama, E. & French, K. (1993). "Common Risk Factors in the Returns on Stocks and Bonds." Journal of Financial Economics, 33(1), 3-56.
- Van Dijk, M. (2011). "Is size dead? A review of the size effect in equity returns." Journal of Banking & Finance, 35(12), 3263-3274.
Data: Ceta Research (FMP financial data warehouse), 2000-2025. Full methodology: METHODOLOGY.md. Past performance does not guarantee future results. This is educational content, not investment advice.


