
Small-Cap Growth Switzerland: Crushing the Local Benchmark (+5.29%/yr)
Switzerland's small-cap growth screen returned 7.03% CAGR vs SMI's 1.74% over 25 years, beating the local benchmark by +5.29%/yr with a Sortino of 0.781.

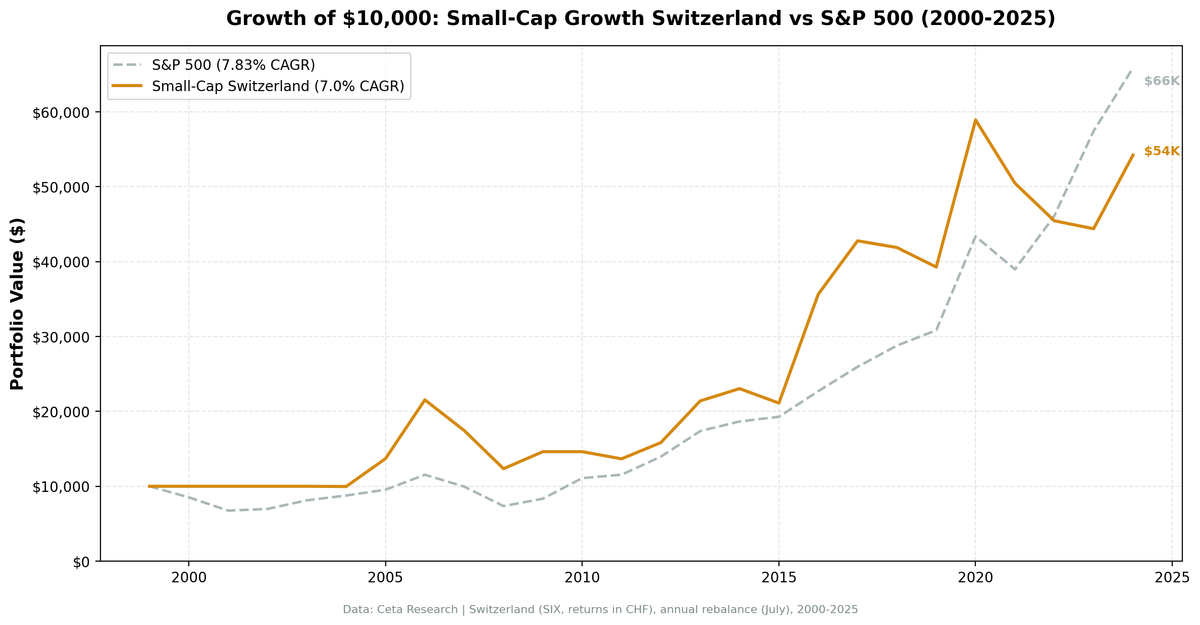
Switzerland's small-cap growth screen returned 7.03% CAGR over 25 years. That might sound modest until you check the local benchmark: the SMI returned just 1.74% over the same period. The strategy beat its home market by +5.29% per year. This is what genuine local alpha looks like.
Contents
- Executive Summary
- The Method
- What We Found
- The weak benchmark makes the alpha real
- 2016: the outlier year
- Down capture as the moat
- Win rate vs. magnitude
- Annual Returns
- When It Works and When It Fails
- Limitations
- Run It Yourself
- Takeaway
- References
The SMI's 1.74% CAGR is shockingly weak for a developed market index. Large-cap Swiss stocks went nearly nowhere for two decades. Against that backdrop, small-cap growth companies delivered real outperformance with a Sharpe of 0.271 and Sortino of 0.781.
Executive Summary
| Metric | Switzerland (SIX) | SMI Benchmark |
|---|---|---|
| CAGR | 7.03% | 1.74% |
| Excess Return | +5.29%/yr | — |
| Sharpe Ratio | 0.271 | 0.085 |
| Sortino Ratio | 0.781 | 0.131 |
| Max Drawdown | -42.23% | -41.74% |
| Win Rate | 56% | — |
| $10K → | $54,457 | — |
| Up Capture | 144% | — |
| Down Capture | 30% | — |
$10,000 invested in 2000 became $54,457 by end of 2024. The same in the SMI would have grown to just $15,395. The strategy won 56% of years, captured 144% of the benchmark's gains, and only 30% of its losses. That's a genuinely strong risk-adjusted profile.
The Method
We screened the SIX Swiss Exchange annually each July (with a 45-day filing lag). The filter:
- Market cap between CHF 25M and CHF 1B (small-cap bounds for Switzerland)
- Revenue growth >15% year-over-year (fiscal year)
- Positive net income
- Debt-to-equity <2.0
Top 30 by revenue growth, equal weight. Annual rebalance.
Switzerland is a small exchange. The average portfolio held only 14.5 stocks — the lowest of any market we tested. This is a structural constraint, not a bug in the screen. There simply aren't many qualifying Swiss small-caps in a given year.
Four cash years (2000-2003) held no positions. In some years like 2010 the portfolio likely had very few stocks given the 14.5 average.
Full methodology: METHODOLOGY.md
For the US flagship results, see our US small-cap growth backtest.
What We Found
The weak benchmark makes the alpha real
The SMI's 1.74% CAGR is the context that matters. Swiss large-caps barely grew for 25 years. The small-cap growth screen delivered 7.03%, which is 4× the benchmark return. That gap persisted across economic cycles, rate regimes, and market conditions.
The Sortino ratio of 0.781 vs the SMI's 0.131 tells you the strategy didn't just beat the benchmark, it did so with better risk-adjusted behavior. More return per unit of downside risk.
The 30% down capture is the mechanical driver. When the SMI fell, the small-cap growth portfolio fell only 30% as much. Combined with 144% up capture, you get asymmetric exposure: most of the gains, a fraction of the losses. That's what alpha looks like on a risk-adjusted basis.
Switzerland's corporate culture explains part of this. Swiss companies are conservative by default. A small-cap Swiss company that passes a growth filter (>15% revenue growth, profitable, D/E <2.0) is a genuinely solid business, not a speculative bet. The quality bar built into Switzerland's corporate environment is higher than most markets.
2016: the outlier year
The strategy's cumulative return has a large jump in 2016: +67.84%, against the SMI's +11.83%. That's 56 percentage points of excess return in a single year. No other year in the Swiss backtest comes close.
Single-year spikes of this magnitude in a 14.5-stock portfolio reflect concentrated moves. When a small portfolio has a breakout year, a few holdings drove the majority of it. The 2016 Swiss small-cap growth rally was real, not an artifact, but the concentration means replicating it in future years isn't guaranteed.
Remove 2016 and the strategy still beats the SMI, but the margin shrinks considerably. That's an honest limitation of thin-universe investing.
Down capture as the moat
The 30% down capture is Switzerland's distinguishing feature. Compare this to Sweden's 31% down capture. When the local benchmark falls, Swiss small-cap growth falls far less. This is structural defensive behavior, not luck.
This shows up in the MaxDD: -42.23% for Switzerland vs -41.74% for the SMI. Despite a thinner 14.5-stock portfolio, the strategy had nearly identical maximum drawdown to the benchmark. The quality of the underlying businesses matters. Swiss small-caps that meet this filter aren't carrying excessive debt and aren't burning cash. When markets fall, they don't implode as badly.
Win rate vs. magnitude
56% win rate means the strategy beat the SMI in 14 of 25 years. The years it won, it won big (2005: +14.12%, 2006: +38.27%, 2016: +56.01%, 2020: +32.00%). The years it lost were often modest negative gaps.
This is the same pattern as quality-growth strategies globally: skewed return distribution with large wins and moderate losses. The Sortino ratio captures this better than Sharpe because Sortino only penalizes downside volatility.
Annual Returns
| Year | Switzerland | SMI | Excess |
|---|---|---|---|
| 2000 | 0.0% | -6.1% | +6.1% |
| 2001 | 0.0% | -19.9% | +19.9% |
| 2002 | 0.0% | -18.3% | +18.3% |
| 2003 | 0.0% | +17.1% | -17.1% |
| 2004 | +0.8% | +12.1% | -11.3% |
| 2005 | +37.0% | +22.9% | +14.1% |
| 2006 | +57.3% | +19.1% | +38.3% |
| 2007 | -19.8% | -25.6% | +5.7% |
| 2008 | -27.9% | -21.8% | -6.2% |
| 2009 | +18.8% | +11.6% | +7.3% |
| 2010 | 0.0% | +4.5% | -4.5% |
| 2011 | -7.1% | -2.2% | -4.9% |
| 2012 | +16.0% | +26.6% | -10.6% |
| 2013 | +35.8% | +11.3% | +24.4% |
| 2014 | +6.5% | +4.1% | +2.4% |
| 2015 | -7.7% | -10.1% | +2.4% |
| 2016 | +67.8% | +11.8% | +56.0% |
| 2017 | +20.0% | -5.3% | +25.4% |
| 2018 | -2.7% | +17.5% | -20.2% |
| 2019 | -4.1% | +1.7% | -5.8% |
| 2020 | +49.5% | +17.5% | +32.0% |
| 2021 | -15.0% | -9.1% | -6.0% |
| 2022 | -10.6% | +3.1% | -13.7% |
| 2023 | -1.7% | +7.1% | -8.7% |
| 2024 | +21.5% | -0.2% | +21.7% |
The 2010 year (0% return while the SMI returned +4.5%) reflects a cash year where the portfolio held no positions. Five years (2000-2003, 2010) had zero holdings due to thin qualifying universe.
2022-2023 show underperformance (-13.7%, -8.7%), similar to Sweden's post-2021 pattern. Swiss small-caps got caught in the growth stock repricing cycle. But 2024's recovery (+21.7% excess) shows the strategy can bounce back.
When It Works and When It Fails
When it works: Early bull markets where quality small-caps are undervalued. The 2005-2006 and 2013 runs show this. Also when the SMI is weak and small-cap growth provides genuine differentiation (2016, 2017, 2020, 2024).
When it fails: Rate-rising environments with multiple expansion reversals (2022-2023). Also low-universe years where only a handful of stocks pass the screen (2010 held zero positions, several other years likely had very thin portfolios).
The thin-universe problem: With 14.5 average stocks, this strategy is a concentrated bet on a handful of Swiss small-caps. A bad quarter for 2-3 companies has an outsized effect. The high Sortino might not be structural; it might partly reflect that the thin portfolio happened to avoid disasters in most years.
Limitations
Universe concentration. 14.5 average stocks is genuinely thin. The 2016 result likely reflects 3-5 stocks having exceptional years. This is hard to attribute to systematic alpha vs. luck.
Currency. Returns are in CHF. The Swiss franc is a strong currency with low inflation, which historically adds a real return tailwind for non-Swiss investors holding CHF assets. Some of the Sortino advantage may be a currency effect, not stock selection.
Data completeness. SIX is a smaller exchange with fewer companies reporting in formats compatible with FMP's pipeline. Universe gaps may exist.
The 2010 zero. A year of zero return (while holding cash or near-zero positions) while SPY returned +32.9% is a structural gap. Low-universe years are a real risk with this screen in Switzerland.
Recent underperformance. 2022-2023 posted two consecutive bad excess years. Whether this is transitory or regime change isn't clear. 2024's +22.1% (vs SPY's +14.7%) shows the strategy can recover.
Run It Yourself
Full backtest code is in our public repository: ceta-research/backtests.
The Swiss screen uses CHF-denominated market cap bounds. The key constraint is the exchange filter: WHERE exchange = 'SIX' in the profile table. Revenue growth is computed from income_statement, and the D/E filter uses debtToEquity from financial_ratios.
Takeaway
Switzerland's small-cap growth screen beats the SMI by +5.29% per year over 25 years. That's genuine local alpha. The SMI's 1.74% CAGR is the key context: Swiss large-caps barely grew. Small-cap growth companies delivered 7.03%, which is 4× the benchmark return.
The risk profile is strong: Sortino of 0.781 vs the SMI's 0.131, 30% down capture, 144% up capture. The strategy earns its returns through asymmetric exposure to the local market, not leverage or volatility.
The thin universe is the main caveat. With 14.5 average holdings, this isn't a diversified strategy. The 2016 outlier year (+56% excess) shows how concentrated wins can distort multi-year metrics. Five cash years (2000-2003, 2010) mean the strategy couldn't always deploy capital.
For investors seeking exposure to Swiss small-cap growth, this screen delivers alpha relative to the local benchmark. But the concentration risk is real, and the thin universe means some years won't have enough qualifying stocks to build a portfolio.
Data: FMP financial data warehouse, 2000–2025. Updated March 2026.
Data: Ceta Research (FMP financial data warehouse), 2000-2025. Full methodology: METHODOLOGY.md. Past performance does not guarantee future results. This is educational content, not investment advice.
References
- Banz, R. (1981). "The Relationship Between Return and Market Value of Common Stocks." Journal of Financial Economics, 9(1), 3-18.
- Fama, E. & French, K. (1992). "The Cross-Section of Expected Stock Returns." Journal of Finance, 47(2), 427-465.
- Fama, E. & French, K. (1993). "Common Risk Factors in the Returns on Stocks and Bonds." Journal of Financial Economics, 33(1), 3-56.
- Van Dijk, M. (2011). "Is size dead? A review of the size effect in equity returns." Journal of Banking & Finance, 35(12), 3263-3274.


