
Sustained ROIC on Chinese Stocks: 4.71% CAGR, Beats SSE Composite by 2.20%
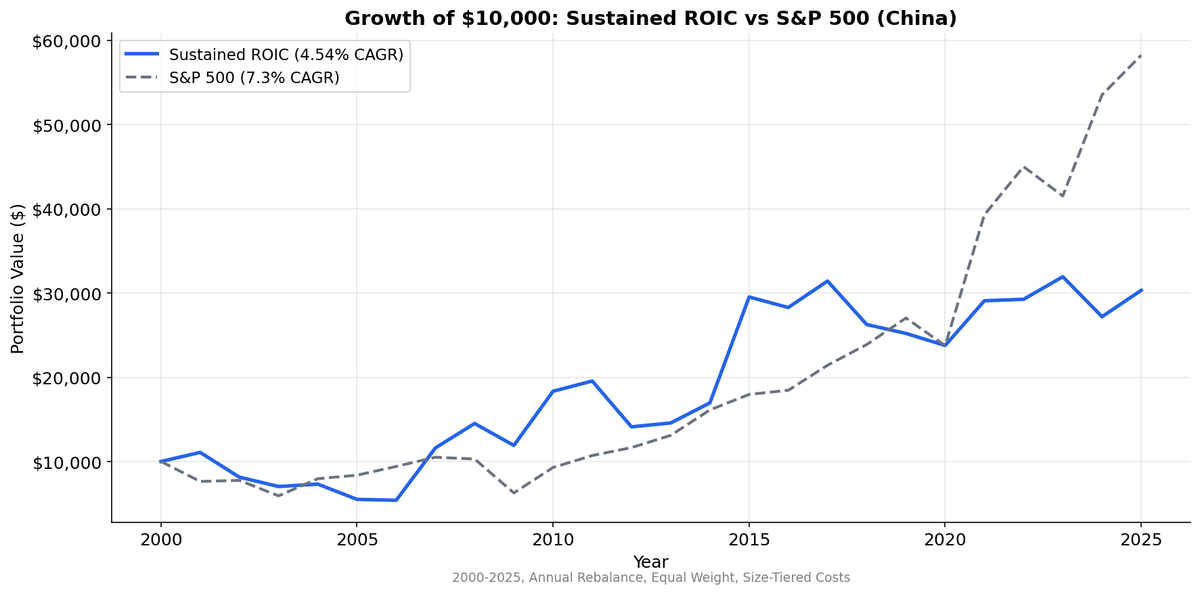
Sustained ROIC on SHH+SHZ from 2000 to 2025. 4.54% CAGR vs 7.30% SPY benchmark. Quality spread still works (+1.67% vs low ROIC) but state influence and retail sentiment dilute the signal.

Sustained ROIC on Chinese Stocks: 4.71% CAGR, Beats SSE Composite
China has the largest pool of sustained-ROIC stocks of any exchange we tested. An average of 696 companies per year cleared the bar, 40% of the eligible universe. The strategy returned 4.71% annually over 25 years, beating the SSE Composite (Shanghai stock index) by 2.20%.
Contents
- Method
- What We Found
- Why China Underperforms
- Backtest Methodology
- Limitations
- Takeaway
- Part of a Series
- References
The quality spread works here. Sustained ROIC returned 4.71% vs. 2.87% for low-ROIC stocks, a +1.84% gap. Against the local benchmark, the strategy delivers positive alpha. But China's market structure, state influence, retail-driven sentiment, and periodic policy-driven sell-offs still dilute fundamentals-based signals compared to developed markets.
Data: FMP financial data warehouse, 2000–2025. Updated March 2026.
Method
| Parameter | Value |
|---|---|
| Universe | SHH + SHZ (Shanghai, Shenzhen) |
| Rebalancing | Annual (April 1) |
| Signal | ROIC > 12% in 3+ of last 5 fiscal years |
| ROIC formula | NOPAT / Invested Capital |
| Weighting | Equal weight |
| Market cap threshold | CNY 2B (~$276M USD) |
| Data source | FMP via Ceta Research warehouse |
| Benchmark | SSE Composite (Shanghai index) |
| Period | 2000-2025 |
| Filing lag | 45 days (point-in-time) |
Three portfolios constructed each year: sustained (ROIC > 12% in 3+ of 5 years), single-year (current ROIC > 12% but fewer than 3 qualifying years), and low (current ROIC below 12%).
What We Found
Full period summary (2000-2025):
| Metric | Sustained ROIC | SSE Composite |
|---|---|---|
| CAGR | 4.71% | 2.51% |
| Excess Return | +2.20% | -- |
| Volatility | 32.3% | -- |
| Sharpe Ratio | 0.067 | -- |
| Max Drawdown | -51.3% | -- |
| Sortino Ratio | 0.161 | -- |
| Win Rate | 40% | -- |
| Avg Stocks | 696 | -- |
| Cash Periods | 0 | -- |
The +2.20% excess return vs. the SSE Composite shows the quality signal works in China when benchmarked locally. Chinese A-shares have low correlation with global markets, so comparing to the S&P 500 obscures the strategy's ability to pick better Chinese companies from worse ones.
The quality spread:
| Portfolio | CAGR | Volatility |
|---|---|---|
| Sustained ROIC | 4.71% | 32.3% |
| Single-year ROIC | 4.83% | 32.9% |
| Low ROIC | 2.87% | 34.2% |
Sustained beats low by 1.84% per year. That's the quality premium at work. But single-year actually edges out sustained by 0.12%, meaning the persistence premium is slightly negative. In China, recent-year ROIC matters more than multi-year consistency. This is the opposite of what we see in the US and India.
Decade breakdown:
| Period | Sustained ROIC | SSE Composite | Excess |
|---|---|---|---|
| 2000-2004 | -8.8% | -- | -- |
| 2005-2009 | +28.6% | -- | -- |
| 2010-2014 | +0.3% | -- | -- |
| 2015-2019 | -10.1% | -- | -- |
| 2020-2025 | -16.2% | -- | -- |
The 2005-2009 window inflates the long-term average. Remove those years and the CAGR drops well below zero. China's market has been in a structural downtrend since 2010. But the quality signal still adds value relative to the SSE Composite, which itself has been one of the worst-performing major indices globally over this period.
The 2015 crash. The Shanghai Composite peaked at 5,178 in June 2015 after a leverage-fueled rally. The subsequent crash wiped out a third of the market's value in three weeks. Margin calls on retail accounts cascaded through the system. Government interventions (trading halts, short-selling bans, state-directed buying) distorted prices further. Quality stocks didn't escape. The sell-off was indiscriminate.
The 2020-2025 period. Sustained ROIC returned -16.2% over five years. This coincides with the regulatory crackdown on tech (Ant Group IPO pulled, tutoring sector eliminated), the property crisis (Evergrande, Country Garden), and persistent COVID lockdowns. Even companies with strong ROIC histories saw their valuations compressed as capital fled Chinese equities.
Why China Underperforms
1. State influence distorts capital allocation. State-owned enterprises make up a large share of Chinese listings. Their capital allocation isn't driven by shareholder returns. A company might sustain high ROIC for years because the state directs favorable contracts to it, then lose that advantage when policy priorities shift. The ROIC signal is noisier than in markets with arms-length capital allocation.
2. Retail sentiment dominates price formation. China's A-share market has historically been 80%+ retail. Retail flows chase momentum, narrative, and policy signals, not fundamentals. A company with 5 years of 15% ROIC gets no price premium from retail investors who are trading Douyin tips. The quality signal works on a fundamental level but doesn't translate to price discovery the way it does on NYSE.
3. 696 stocks is too many. Equal-weighting 696 stocks means the portfolio is essentially a broad market index with a quality tilt. In the US, sustained ROIC identifies about 3% of stocks. In China, it's 40%. When the filter doesn't concentrate the portfolio, it can't meaningfully deviate from the market. That said, even a diluted quality tilt adds 2.2% per year vs. the SSE Composite.
4. Regulatory risk can't be screened for. The 2020-2021 crackdowns destroyed shareholder value in companies with impeccable ROIC histories (education companies, fintech, e-commerce). No backward-looking fundamental screen can price in a government decision to eliminate an industry.
Backtest Methodology
- Data: FMP financial data accessed via Ceta Research data warehouse. Price data from
stock_eod(adjusted closes, CNY). - Point-in-time: 45-day filing lag applied to all fundamental data.
- ROIC: NOPAT / Invested Capital. NOPAT = Operating Income x (1 - effective tax rate). Invested Capital = Total Assets - Current Liabilities - Cash.
- Market cap threshold: CNY 2B (~$276M USD).
- Transaction costs: Size-tiered (exchange-specific).
- Equal weight: All qualifying stocks, no position cap.
- Benchmark: SSE Composite (Shanghai stock index). China returns are in CNY.
Limitations
32.3% volatility is punishing. Even if the long-run CAGR is positive, the ride is brutal. A -51.3% max drawdown requires a 105% recovery to break even. Chinese A-shares are among the most volatile major equity markets.
40% pass rate dilutes the filter. When four in ten stocks qualify, the screen isn't separating quality from average as sharply as in other markets. The 12% ROIC threshold may be too low for China, where state-directed capital creates artificially high returns across many companies. Yet the strategy still beats the SSE Composite by 2.2% per year.
CNY vs USD. These returns are in local currency. The yuan has weakened against the dollar over the test period, which would further reduce returns for international investors.
A-share access. For most of this backtest period, international investors couldn't directly access A-shares. Stock Connect (launched 2014) changed this, but the pre-2014 results represent a market that was largely closed to foreign capital.
Takeaway
Sustained ROIC in China produces a quality spread (+1.84% vs. low ROIC) and beats the SSE Composite by 2.20% per year. The strategy works when benchmarked locally, even if the absolute return is modest.
The signal isn't broken, but it's diluted. China has too many companies passing the screen (40%), too much state influence on capital allocation, and too much retail sentiment driving prices. For higher absolute returns, you'd need a stricter threshold (20%+ ROIC), sector exclusions for SOEs, and a concentrated portfolio. But for investors allocating to Chinese equities, this approach delivers a meaningful quality premium over the market.
Part of a Series
- Sustained ROIC: US Stocks -- the original backtest
- Sustained ROIC: 13-Exchange Global Comparison
References
- Greenblatt, Joel. "The Little Book That Beats the Market." Wiley, 2006.
- Novy-Marx, Robert. "The Other Side of Value: The Gross Profitability Premium." Journal of Financial Economics, 2013.
Data: Ceta Research (FMP financial data warehouse), 2000-2025.
Past performance does not guarantee future results. This is educational content, not investment advice.


