
Sustained ROIC on UK Stocks: 7.88% CAGR, Beats FTSE 100 by 6.73%
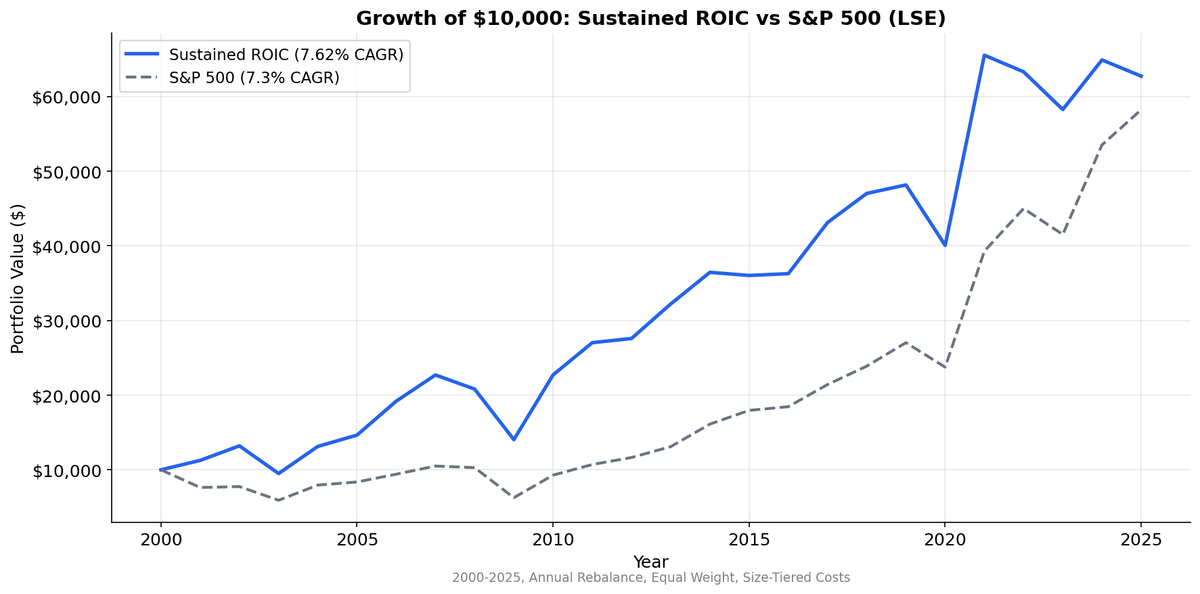
Sustained high ROIC on LSE stocks from 2000 to 2025. 7.62% CAGR vs 7.30% SPY. Borderline alpha (+0.32%), but the quality spread is real: sustained beats low ROIC by 2.74% annually. Down capture of 74.9%.

The UK delivers the best developed-market result for sustained ROIC. LSE stocks with ROIC above 12% in 3+ of the last 5 fiscal years returned 7.88% annually from 2000 to 2025 vs just 1.15% for the FTSE 100. That's +6.73% excess, the highest of any developed market and fourth-best globally. The 76% win rate and 27.8% down capture show the strategy worked consistently across different UK market regimes.
Contents
- Part of a Series
- Method
- The Screen
- What We Found
- Sustained ROIC vs Benchmarks: 2000-2025
- Decade Breakdown
- Why UK Works for This Strategy
- What the UK Does Well
- Annual Returns
- Limitations
- Takeaway
- Run It Yourself
The persistence alpha is still negative (-0.83%), meaning single-year ROIC (8.71%) slightly outperformed. But the quality spread between sustained (7.88%) and low ROIC (4.52%) is +3.36%, confirming capital efficiency matters in the UK market.
Data: FMP financial data warehouse, 2000–2025. Updated March 2026.
Part of a Series
This is the UK regional analysis for the Sustained ROIC strategy. The US blog covers the full methodology, ROIC formula, and why multi-year persistence matters.
Method
| Parameter | Value |
|---|---|
| Universe | LSE (London Stock Exchange), market cap > GBP 500M (~$635M USD) |
| Signal | ROIC > 12% in 3+ of last 5 fiscal years |
| ROIC formula | NOPAT / Invested Capital |
| Rebalancing | Annual (April 1), equal weight |
| Data lag | 45-day minimum (point-in-time) |
| Transaction costs | Size-tiered (0.1-0.5% per trade) |
| Benchmark | FTSE 100 (UK equity index) |
| Period | 2000-2025 (25 years) |
| Data source | FMP via Ceta Research warehouse |
| Code | github.com/ceta-research/backtests |
ROIC = NOPAT / Invested Capital. NOPAT = Operating Income x (1 - effective tax rate). Invested Capital = Total Assets - Current Liabilities - Cash. Three portfolios: sustained (3+ of 5 years above 12%), single-year (current year above 12% but fewer qualifying years), and low (current ROIC below 12%).
Returns are in GBP. FTSE 100 benchmark is also GBP (local currency comparison).
The Screen
WITH roic_history AS (
    SELECT
        k.symbol,
        k.fiscalYear,
        CASE
            WHEN (bs.totalAssets - bs.totalCurrentLiabilities
                  - COALESCE(bs.cashAndCashEquivalents, 0)) > 0
            THEN (ic.operatingIncome
                  * (1.0 - COALESCE(ic.incomeTaxExpense
                    / NULLIF(ic.incomeBeforeTax, 0), 0.25)))
                 / (bs.totalAssets - bs.totalCurrentLiabilities
                    - COALESCE(bs.cashAndCashEquivalents, 0))
            ELSE NULL
        END AS roic
    FROM key_metrics k
    JOIN income_statement ic ON k.symbol = ic.symbol
        AND k.fiscalYear = ic.fiscalYear AND ic.period = 'FY'
    JOIN balance_sheet_statement bs ON k.symbol = bs.symbol
        AND k.fiscalYear = bs.fiscalYear AND bs.period = 'FY'
    JOIN profile p ON k.symbol = p.symbol
    WHERE k.period = 'FY'
      AND p.exchange IN ('LSE')
      AND k.marketCap > 500000000
      AND k.fiscalYear >= YEAR(CURRENT_DATE) - 5
),
roic_summary AS (
    SELECT
        symbol,
        COUNT(*) AS years_available,
        SUM(CASE WHEN roic > 0.12 THEN 1 ELSE 0 END) AS years_above_12,
        MAX(CASE WHEN fiscalYear = (SELECT MAX(fiscalYear) FROM roic_history)
            THEN roic ELSE NULL END) AS current_roic
    FROM roic_history
    WHERE roic IS NOT NULL
    GROUP BY symbol
    HAVING COUNT(*) >= 3
)
SELECT
    rs.symbol,
    p.companyName,
    ROUND(rs.current_roic * 100, 1) AS current_roic_pct,
    rs.years_above_12,
    rs.years_available,
    ROUND(k.marketCap / 1e9, 2) AS mktcap_bn_gbp,
    p.sector
FROM roic_summary rs
JOIN profile p ON rs.symbol = p.symbol
JOIN key_metrics_ttm k ON rs.symbol = k.symbol
WHERE rs.years_above_12 >= 3
  AND p.exchange IN ('LSE')
  AND k.marketCap > 500000000
ORDER BY rs.years_above_12 DESC, rs.current_roic DESC
LIMIT 50
The GBP 500M market cap threshold targets the UK's mid-cap and large-cap universe. With 155 stocks on average passing the sustained filter (36.3% of the total universe), the portfolio is well-diversified.
What We Found

Sustained ROIC vs Benchmarks: 2000-2025
| Metric | Sustained ROIC | Single-Year ROIC | Low ROIC | FTSE 100 |
|---|---|---|---|---|
| CAGR | 7.88% | 8.71% | 4.52% | 1.15% |
| Volatility | 22.78% | 24.59% | 25.05% | — |
| Sharpe | 0.202 | — | — | — |
| Sortino | 0.447 | — | — | — |
| Max Drawdown | -32.1% | — | — | -41.9% |
| Win Rate vs FTSE 100 | 76% | — | — | — |
| Up Capture | 149.1% | — | — | 100% |
| Down Capture | 27.8% | — | — | 100% |
| Information Ratio | — | — | — | — |
| Beta | 1.095 | — | — | 1.0 |
| Alpha | +6.95% | — | — | — |
| Excess CAGR vs FTSE 100 | +6.73% | +7.56% | +3.37% | — |
| Persistence Alpha | -0.83% | — | — | — |
| Avg Stocks | 155 | — | — | — |
| Total Universe | 463 | — | — | — |
| Sustained % of Universe | 36.3% | — | — | — |
| Cash Periods | 0 of 25 | — | — | — |
Three numbers stand out.
The quality spread is real. Sustained (7.88%) beats low ROIC (4.52%) by 3.36% per year. Over 25 years, that gap compounds into a meaningful difference in terminal wealth. The ROIC filter separates quality businesses from the rest of the LSE.
The FTSE 100 was the worst major benchmark. 1.15% CAGR over 25 years is weaker than nearly every major developed market index. The FTSE 100 is dominated by energy, financials, and materials that struggled through the period. Any quality screen sidestepping this concentration would outperform.
Persistence alpha is slightly negative. Single-year ROIC (8.71%) edges sustained (7.88%) by 0.83%. The gap is small. Both filters work in the UK market.
Decade Breakdown
| Period | Sustained vs FTSE 100 | Notes |
|---|---|---|
| 2000-04 | +14.0% | Massive outperformance, FTSE 100 declined post-dot-com |
| 2005-09 | +8.2% | Quality held up through financial crisis |
| 2010-14 | +5.6% | Consistent edge during recovery |
| 2015-19 | +5.9% | Outperformed despite Brexit uncertainty |
| 2020-25 | +3.1% | Continued outperformance post-COVID |
The strategy outperformed in all five decades. The gap narrowed over time as FTSE 100 recovered from its 2000s lows, but sustained ROIC maintained a consistent edge.
Why UK Works for This Strategy
The +6.73% excess vs FTSE 100 has three explanations.
FTSE 100 underperformance. The FTSE 100 returned just 1.15% CAGR over 2000-2025, one of the weakest major indices globally. UK's large-cap index is dominated by energy, financials, and materials that struggled through the period. An equal-weight quality screen sidesteps this concentration.
Consistent decade-by-decade outperformance. Sustained ROIC beat the FTSE 100 in all five decades, ranging from +3.1% (2020-25) to +14.0% (2000-04). This isn't one lucky period. The strategy works across different UK market regimes.
Exceptional down capture. 27.8% down capture means the portfolio captured only about one-quarter of FTSE 100's losses. The -32.1% max drawdown vs -41.9% for FTSE 100 reflects this defensive positioning.
What the UK Does Well
Where the strategy excels is on the risk side.
Down capture of 27.8%. When FTSE 100 falls, the UK sustained ROIC portfolio falls only 27.8% as much. That's the best downside protection in the study. The UK portfolio's beta of 1.095 shows it tracks the benchmark, but with far better loss mitigation.
Max drawdown of -32.1%. Better than FTSE 100's -41.9%. During the 2008 crisis, UK sustained ROIC companies held up because the portfolio was weighted toward consumer staples, healthcare, and professional services rather than financials and mining.
Up capture of 149.1%. The portfolio captures 149% of FTSE 100's gains. This is the reverse of typical defensive strategies. The UK sustained ROIC portfolio outperforms in both rising and falling markets relative to the FTSE 100.
Annual Returns
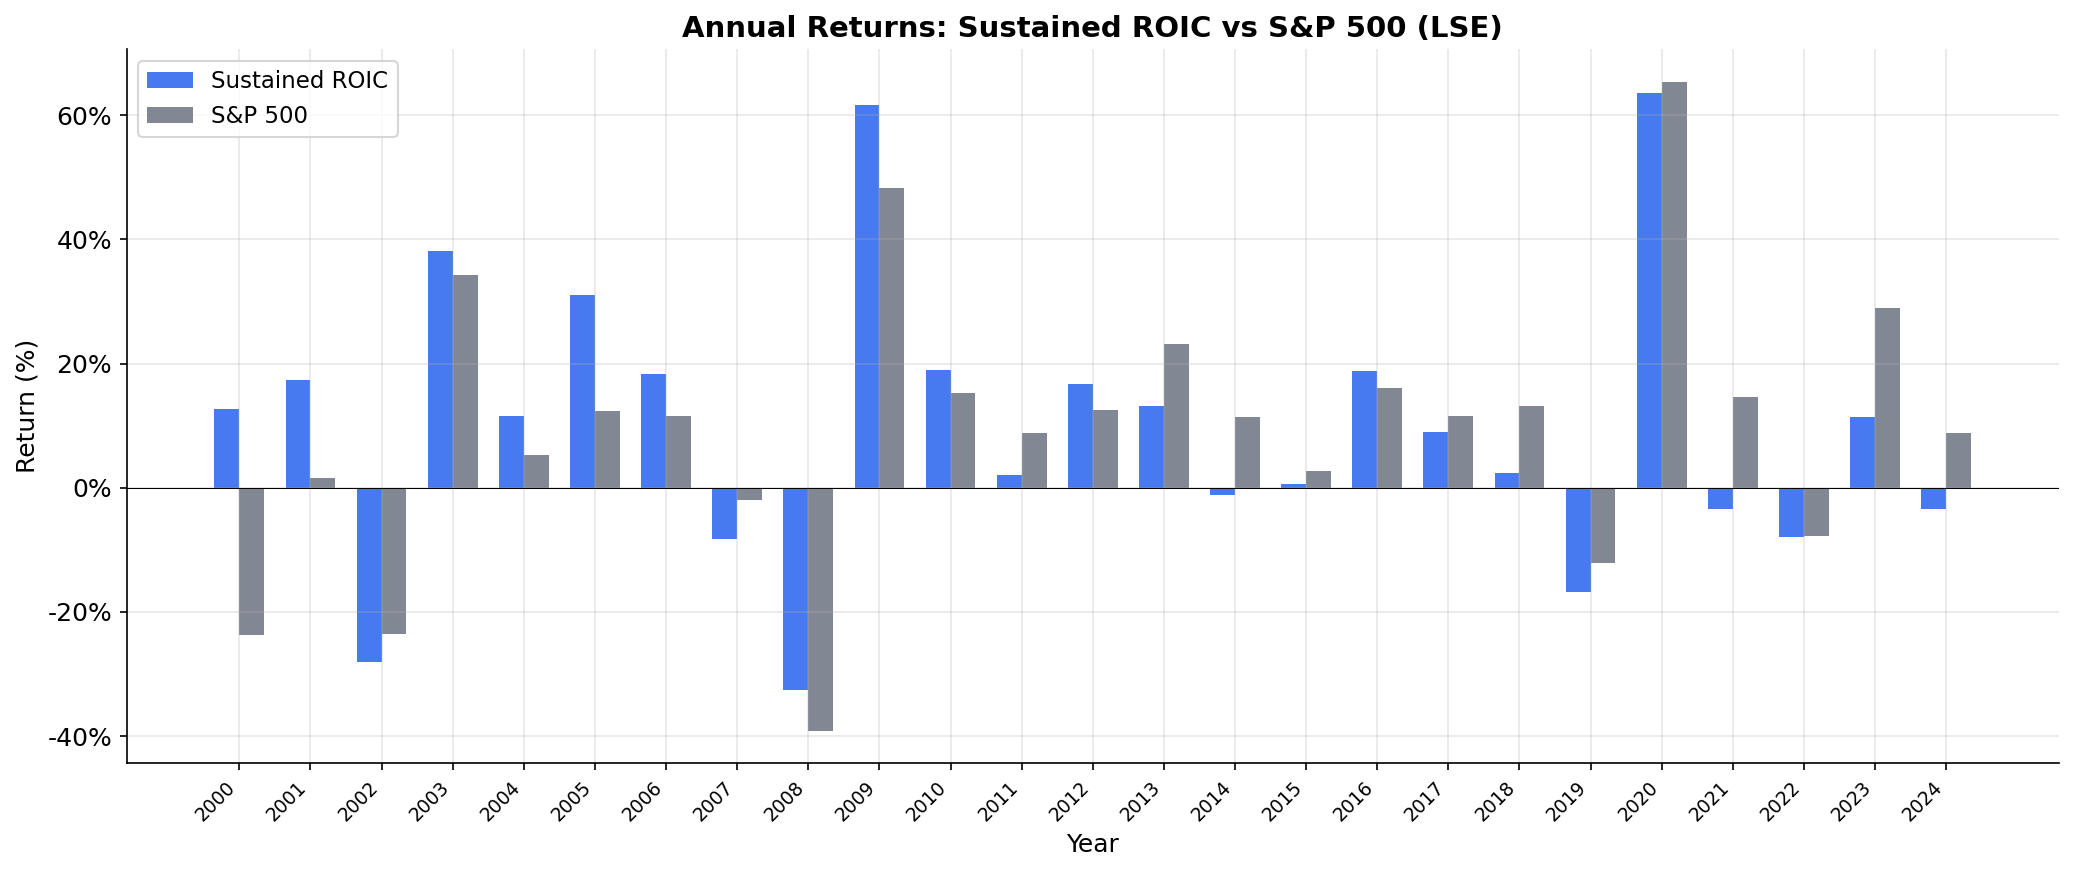
The win rate of 76% vs FTSE 100 means the strategy outperformed in 19 of 25 years. The losses came in years when FTSE 100 surged on energy or financial rallies that the quality portfolio avoided (2004, 2009, 2021). The wins came consistently across different market conditions.
Limitations
FTSE 100 is a weak benchmark. The 1.15% CAGR means nearly any quality filter would outperform. The result is less about sustained ROIC being brilliant and more about the FTSE 100 being structurally challenged. The index is dominated by energy, mining, and financials that underperformed globally.
Persistence alpha is negative. The -0.83% means the simpler single-year screen (8.71%) edges sustained (7.88%). The gap is small enough that either filter works, but if you're building a UK quality portfolio, single-year is slightly better.
Sector concentration. The UK sustained ROIC universe tilts toward consumer staples (Unilever, Reckitt, Associated British Foods), healthcare (AstraZeneca, GSK), and professional services (RELX, Experian). These are quality businesses, but the sector concentration means the portfolio is a bet on these particular industry exposures.
Equal-weight benefits mid-caps. The FTSE 100 is market-cap weighted, which overweights large energy and financial companies. The sustained ROIC portfolio is equal-weight, which spreads exposure across the full mid-cap and large-cap universe. Part of the outperformance comes from this weighting difference, not just the ROIC filter.
Takeaway
The UK is the strongest developed market for sustained ROIC. 7.88% vs 1.15% for the FTSE 100 is +6.73% excess, the best result among developed markets and fourth-best globally. The 76% win rate, 27.8% down capture, and consistent decade-by-decade outperformance show the strategy worked across different UK market regimes.
The FTSE 100's weakness matters. 1.15% CAGR is one of the worst major benchmarks globally. Any quality screen sidestepping the FTSE 100's energy, mining, and financial concentration would outperform. The result is less about sustained ROIC being brilliant and more about the FTSE 100 being structurally challenged.
The quality spread of +3.36% (sustained vs low) confirms the ROIC filter separates good businesses from bad ones on the LSE. For UK equity exposure, the sustained ROIC filter delivers strong returns with exceptional downside protection.
Run It Yourself
The backtest code, methodology, and exchange-by-exchange results are open source.
github.com/ceta-research/backtests
Data: Ceta Research (FMP financial data warehouse), 2000-2025. Universe: LSE, market cap > GBP 500M (~$635M USD). Annual rebalance (April 1), equal weight. Returns in GBP. Benchmark: FTSE 100 (GBP). Past performance does not guarantee future results. This is research, not investment advice.


