
Analyst Upgrades in Germany: Drift Grows to +2.6% Over 3 Months

Analyst Upgrades in Germany: Drift Grows to +2.6% Over 3 Months
We measured 12,585 individual analyst upgrades on XETRA-listed German stocks from 2012 to 2025 and found something different from the US: the drift doesn't fade. It keeps growing for three months.
Contents
- Method
- What We Found
- Upgrade drift keeps growing for three months
- Downgrades reverse completely
- Clustered upgrades: 2x single-analyst events
- Magnitude effect
- The Data
- Why Does Germany Look Different?
- Limitations
- Takeaway
Method
- Data source: Ceta Research (FMP stock_grade table, individual analyst grade changes)
- Universe: XETRA (Frankfurt Stock Exchange), market cap above €200M EUR
- Period: 2012–2025 (14 years, 24,887 events including downgrades)
- Study type: Event study. Each event measured independently.
- Benchmark: EWG (iShares MSCI Germany ETF)
- Windows: T+1, T+5, T+21, T+63 trading days after the event
- Abnormal return: Stock return minus EWG return at each window
What We Found
Upgrade drift keeps growing for three months
In the US, analyst upgrade drift peaks around T+5 and gradually fades. Germany behaves differently.
| Window | Upgrade CAR | t-stat | Downgrade CAR | t-stat |
|---|---|---|---|---|
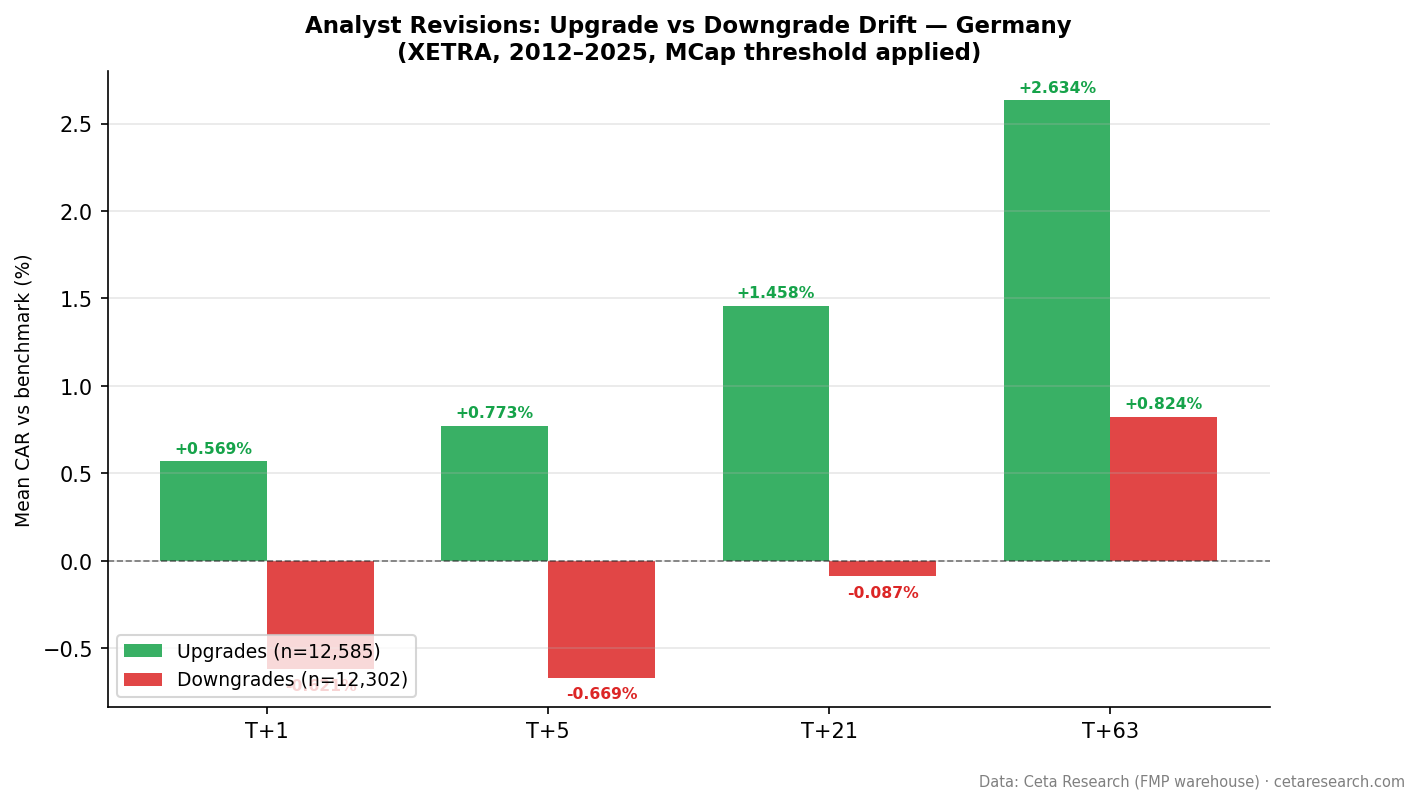
| T+1 | +0.569% | 22.3 | -0.621% | -23.2 |
| T+5 | +0.773% | 16.2 | -0.669% | -13.9 |
| T+21 | +1.458% | 16.7 | -0.087% | -1.0 (ns) |
| T+63 | +2.634% | 16.0 | +0.824% | +5.1 |
n=12,585 upgrades, n=12,302 downgrades. Winsorized mean.
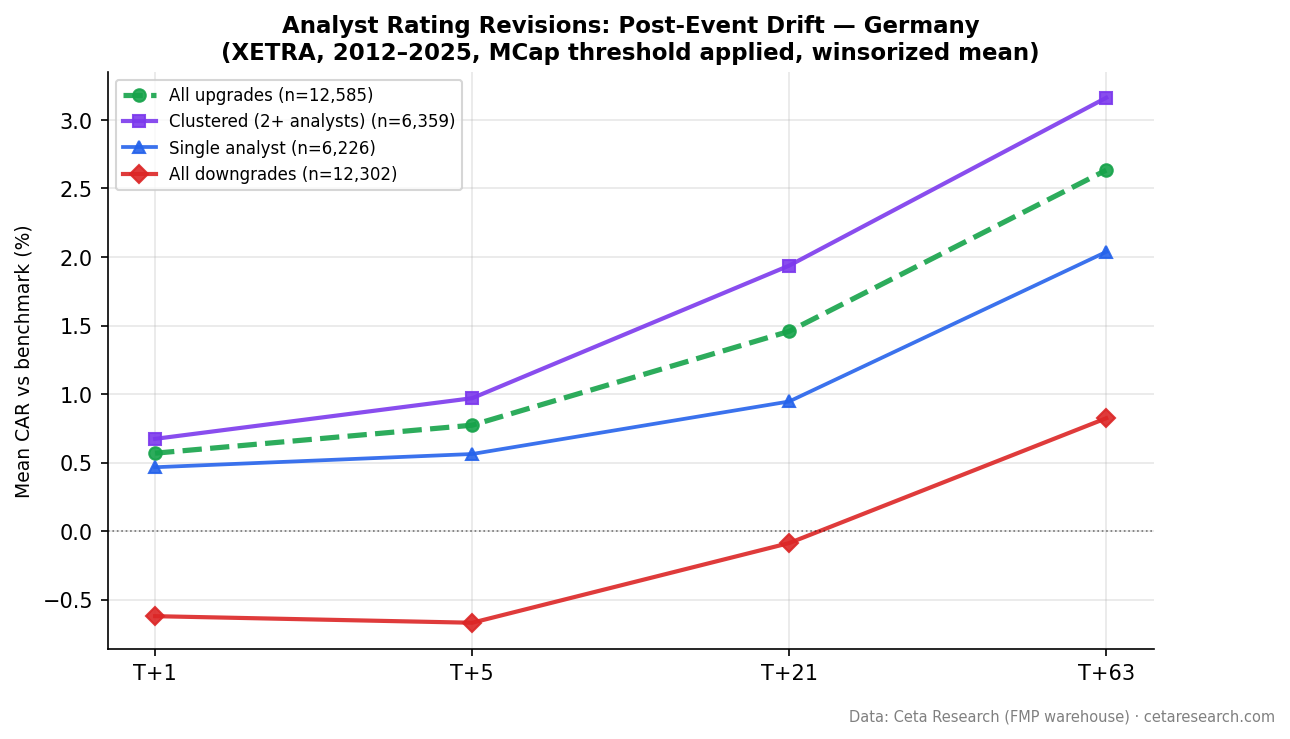
Every upgrade window is statistically significant (t>16). The drift isn't fading, it's accelerating. A stock upgraded by a German analyst underperforms EWG by 2.6% three months later. That's a meaningful, persistent, and robust signal.
Downgrades reverse completely
The downgrade pattern is the mirror of the US, but inverted. German downgrades start negative (−0.62% at T+1) but fade to statistical noise by T+21 (−0.09%, not significant). By T+63, downgraded stocks have fully reversed and are actually outperforming EWG by +0.82%.
This is the opposite of US downgrades, which accumulate to −1.48% at T+63.
Why? One interpretation: German downgrades are over-reactions. Analysts downgrade aggressively, the stock drops immediately, then rebounds as the market reassesses. German upgrades, by contrast, are under-reactions, analysts are slow to upgrade, and when they do, the positive information keeps flowing into price for months.
Another interpretation: the German market is more prone to information delay. Analyst coverage of mid-cap German companies is thinner than US coverage. When an analyst upgrades, it takes longer for that information to reach a broad set of investors.
Clustered upgrades: 2x single-analyst events
| Category | n | T+1 | T+21 | T+63 |
|---|---|---|---|---|
| Clustered (2+ analysts) | 6,359 | +0.673% | +1.937% | +3.162% |
| Single analyst | 6,226 | +0.466% | +0.946% | +2.038% |
Even the single-analyst baseline (+2.04% at T+63) is large by global standards. The cluster premium is an additional +1.1% at T+63 on top of that.
Germany has 50% of its upgrades classified as clustered, the highest concentration among the five markets we studied. This reflects the tighter analyst coverage ecosystem: when one firm upgrades a German stock, others often follow within 30 days.
Magnitude effect
| Category | n | T+21 CAR |
|---|---|---|
| Large (+4, Sell→Buy) | 259 | +1.596% |
| Small (+2, Hold→Buy) | 12,326 | +1.454% |
Unlike the US where large-magnitude upgrades are 3.5x the small-magnitude signal, Germany shows almost no magnitude premium. The baseline small-upgrade signal (+1.45% at T+21) is already high enough that there's little differentiation by grade jump size.
The Data

Why Does Germany Look Different?
The persistent upgrade drift in Germany likely reflects a combination of factors:
Thinner analyst coverage. German mid-caps have fewer analysts covering them. A single upgrade from a major house moves the stock, but many potential buyers take weeks to act on the information.
Retail investor base. German retail investors are more conservative and slower to act on analyst recommendations than US institutional investors. Information diffuses more slowly.
Infrequent trading. XETRA stocks outside the DAX trade less frequently. Less liquidity means price adjustments happen over longer time horizons.
None of this is a reliable trading edge, by the time you see the upgrade, you're buying into an already-moved stock. But the pattern suggests German stocks are systematically slower to price analyst information than US stocks.
Limitations
This covers one extended period. 2012–2025 includes Germany's recovery from the eurozone crisis, a COVID shock, and post-zero-rate adjustment. The pattern may differ across regimes.
EWG as benchmark. EWG tracks a specific slice of German stocks. Mid-cap companies on XETRA may have different systematic risk than EWG implies.
Transaction costs. XETRA has reasonable liquidity for mid-cap stocks, but bid-ask spreads on smaller companies can be wide. Event study returns don't account for execution costs.
Causation vs correlation. The drift after upgrades could reflect genuine information in the upgrade, or it could reflect that analysts upgrade stocks that are improving. The event study can't separate these.
Takeaway
Germany shows the strongest persistent upgrade drift of the five markets we studied. Analyst upgrades produce +1.46% abnormal return at one month and +2.63% at three months, with t-statistics above 16 at every window.
The downgrade pattern is the opposite: initial drops fully reverse by three months.
The most likely explanation is information diffusion speed. The German market is slower to price analyst revisions than the US. Whether that's actionable depends on your execution infrastructure, but the signal is real and large by the standards of liquid markets.
Part of a Series: S Global Comparison Event Study | Global | S Uk Lse Event Study | US | US
Run It Yourself
Explore the data behind this analysis on Ceta Research. Query our financial data warehouse with SQL, build custom screens, and run your own backtests across 70,000+ stocks on 20 exchanges.
Data: FMP warehouse via Ceta Research, 2012–2025. XETRA stocks, market cap >€200M. Benchmark: EWG.
The backtest code is available on GitHub. Run the live screen: python3 analyst-revision/screen.py --preset germany


