DCF Discount on Brazilian Stocks: 18% CAGR on the SAO Over 25 Years


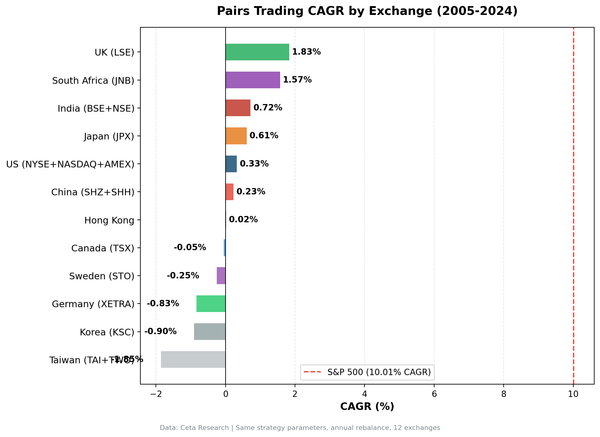
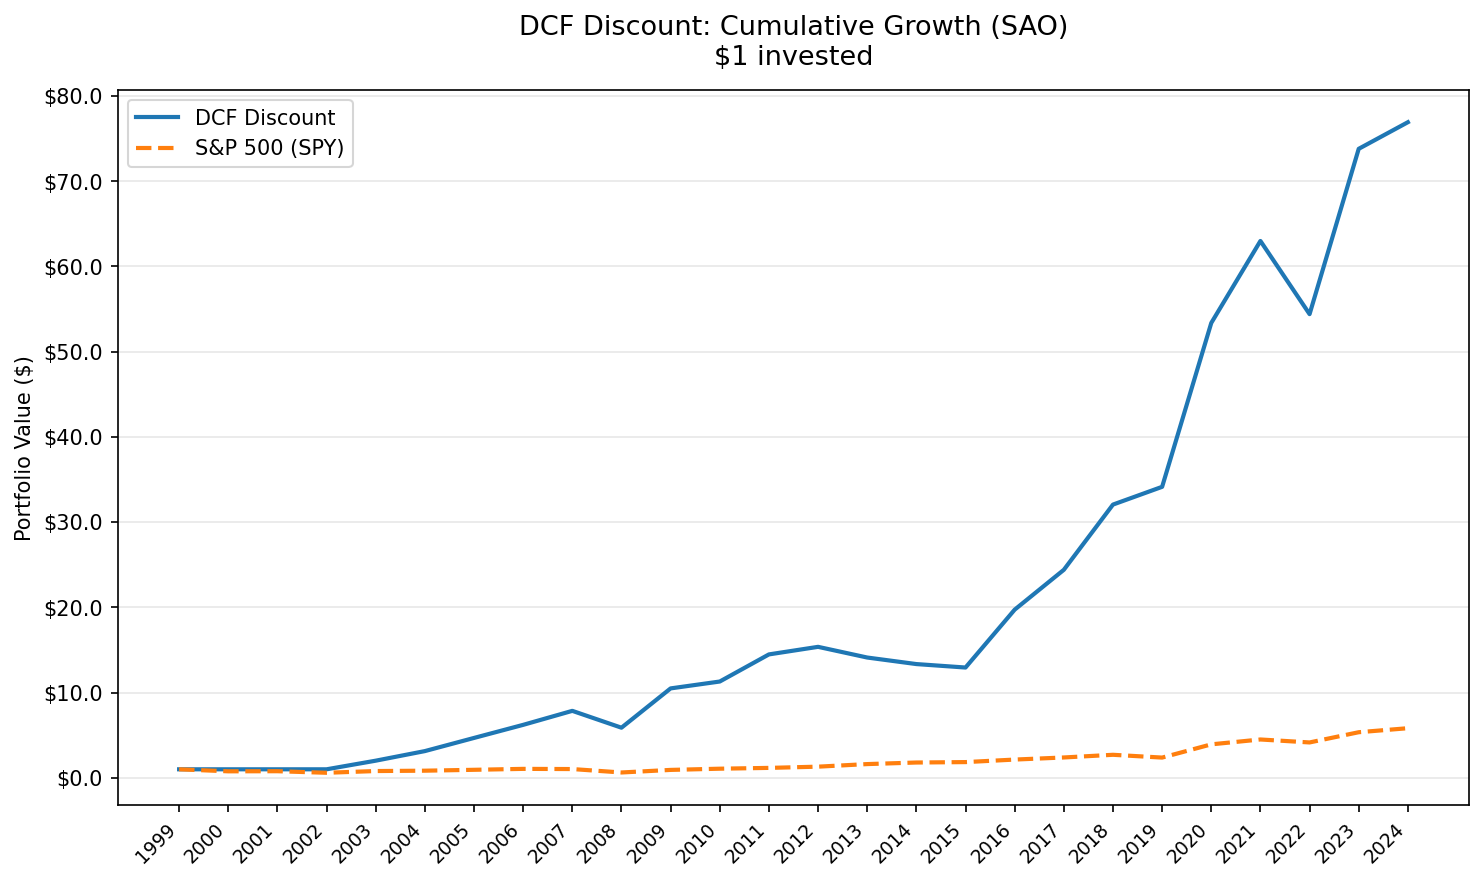
Brazil produced the highest CAGR of any market we tested for the DCF Discount strategy. Over 25 years, a portfolio of SAO-listed stocks trading below computed intrinsic value returned 18.05% CAGR, turning $10,000 into $716,099. The Bovespa returned 8.58% over the same period. That's a +9.47% annual excess, the widest gap across all exchanges.
Contents
- Method
- The Screen
- What We Found
- Year-by-Year
- Key Observations
- 2000-2001: Cash years
- 2003-2005: The breakout (+86%, +53%, +43%)
- 2006-2009: Commodity supercycle, then crisis (+33%, +27%, -25%, +75%)
- 2013-2015: The Petrobras era (-8%, -5%, -3%)
- 2016-2019: Political reset and recovery (+58%, +24%, +37%, -2%)
- 2020: COVID and the stimulus bounce (+54.2%)
- Currency Warning
- Limitations
- Takeaway
- Part of a Series
- Run This Screen Yourself
The risk profile is what makes it unusual. The max drawdown was just -24.87%. For context, India delivered 11.67% CAGR but suffered a -63.98% drawdown. The Bovespa itself had a deeper max drawdown (-31.0%) than this Brazilian value portfolio. The Calmar ratio of 0.726 is the best of any market we tested.
Method
This is a regional extension of our US flagship DCF Discount backtest. Full methodology, model assumptions, and limitations are covered there.
Signal: FCF/MarketCap >= 8.78%, equivalent to a 20% discount to intrinsic value via Gordon Growth Model (g=2.5%, r=10%, multiple=13.67x). Universe: SAO (B3, formerly BM&F Bovespa). Market cap > R$1B (~$200M USD). Period: 2000-2025 (25 years, annual rebalancing in April). Portfolio: Top 50 by FCF yield, equal weight. Cash if fewer than 10 qualify. Costs: Size-tiered transaction costs applied (0.1% for >$10B, 0.3% for $2-10B, 0.5% for <$2B). Point-in-time: 45-day filing lag. 18-month staleness filter. Benchmark: Bovespa (^BVSP), the local Brazilian benchmark. Data: Ceta Research (FMP financial data warehouse).
The Screen
WITH fcf_data AS (
    SELECT symbol, freeCashFlow,
        CAST(date AS DATE) AS filing_date,
        ROW_NUMBER() OVER (
            PARTITION BY symbol ORDER BY CAST(date AS DATE) DESC
        ) AS rn
    FROM cash_flow_statement
    WHERE period = 'FY'
      AND freeCashFlow > 0
      AND CAST(date AS DATE) <= CURRENT_DATE - INTERVAL '45' DAY
      AND CAST(date AS DATE) >= CURRENT_DATE - INTERVAL '540' DAY
),
mktcap_data AS (
    SELECT symbol, marketCap,
        ROW_NUMBER() OVER (
            PARTITION BY symbol ORDER BY CAST(date AS DATE) DESC
        ) AS rn
    FROM key_metrics
    WHERE period = 'FY'
      AND marketCap > 0
      AND CAST(date AS DATE) <= CURRENT_DATE - INTERVAL '45' DAY
      AND CAST(date AS DATE) >= CURRENT_DATE - INTERVAL '540' DAY
)
SELECT
    f.symbol,
    p.companyName,
    p.exchange,
    ROUND(f.freeCashFlow / 1e6, 0) AS fcf_mm,
    ROUND(m.marketCap / 1e9, 2) AS mktcap_bn,
    ROUND(f.freeCashFlow / m.marketCap * 100, 2) AS fcf_yield_pct,
    ROUND(f.freeCashFlow * 13.67 / m.marketCap * 100, 1) AS dcf_vs_price_pct
FROM fcf_data f
JOIN mktcap_data m ON f.symbol = m.symbol AND m.rn = 1
JOIN profile p ON f.symbol = p.symbol
WHERE f.rn = 1
  AND m.marketCap > 1000000000
  AND f.freeCashFlow / m.marketCap >= 0.0878
  AND p.exchange = 'SAO'
QUALIFY ROW_NUMBER() OVER (PARTITION BY f.symbol
    ORDER BY f.freeCashFlow / m.marketCap DESC) = 1
ORDER BY fcf_yield_pct DESC
LIMIT 50
Run this screen on Ceta Research →
The 8.78% FCF yield threshold is the equivalent of a 20% DCF discount when using the Gordon Growth Model at g=2.5%, r=10%. Stocks with higher FCF yield relative to market cap are trading further below computed intrinsic value.
What We Found
The headline numbers are the best of any market we tested, and it's not close. The 18.05% CAGR beats India (11.67%). But the real story is how the portfolio managed downside. The max drawdown of -24.87% is shallower than the Bovespa's -31.0%. Down capture of 20.25% means the portfolio captured only a fifth of the Bovespa's losses. That's extraordinary.
| Metric | DCF Discount Brazil | Bovespa |
|---|---|---|
| CAGR | 18.05% | 8.58% |
| Total Return | 7,060.99% | 682.90% |
| Excess CAGR | +9.47% | -- |
| Max Drawdown | -24.87% | -31.0% |
| Annualized Volatility | 30.89% | 30.80% |
| Sharpe Ratio | 0.263 | -0.062 |
| Sortino Ratio | 0.698 | -- |
| Calmar Ratio | 0.726 | 0.277 |
| Win Rate (years > Bovespa) | 64% | -- |
| Beta vs Bovespa | 0.844 | 1.0 |
| Alpha (annualized) | +9.87% | -- |
| Up Capture | 150.5% | -- |
| Down Capture | 20.25% | -- |
| Information Ratio | 0.630 | -- |
| Tracking Error | 14.14% | -- |
| Cash Periods | 2 of 25 | -- |
| Avg Stocks When Invested | 36.2 | -- |
The Information Ratio of 0.630 is the highest of any market tested. The Calmar Ratio of 0.726 is more than 2.5x the Bovespa's 0.277. The Sortino (0.698) strongly favors the portfolio. Every risk-adjusted metric favors the Brazilian portfolio.
The up/down capture ratio tells the cleanest version of the story. The portfolio captured 150.5% of the Bovespa's gains and only 20.25% of its losses. That 7.4:1 asymmetry is unlike anything we saw in other markets.
Year-by-Year
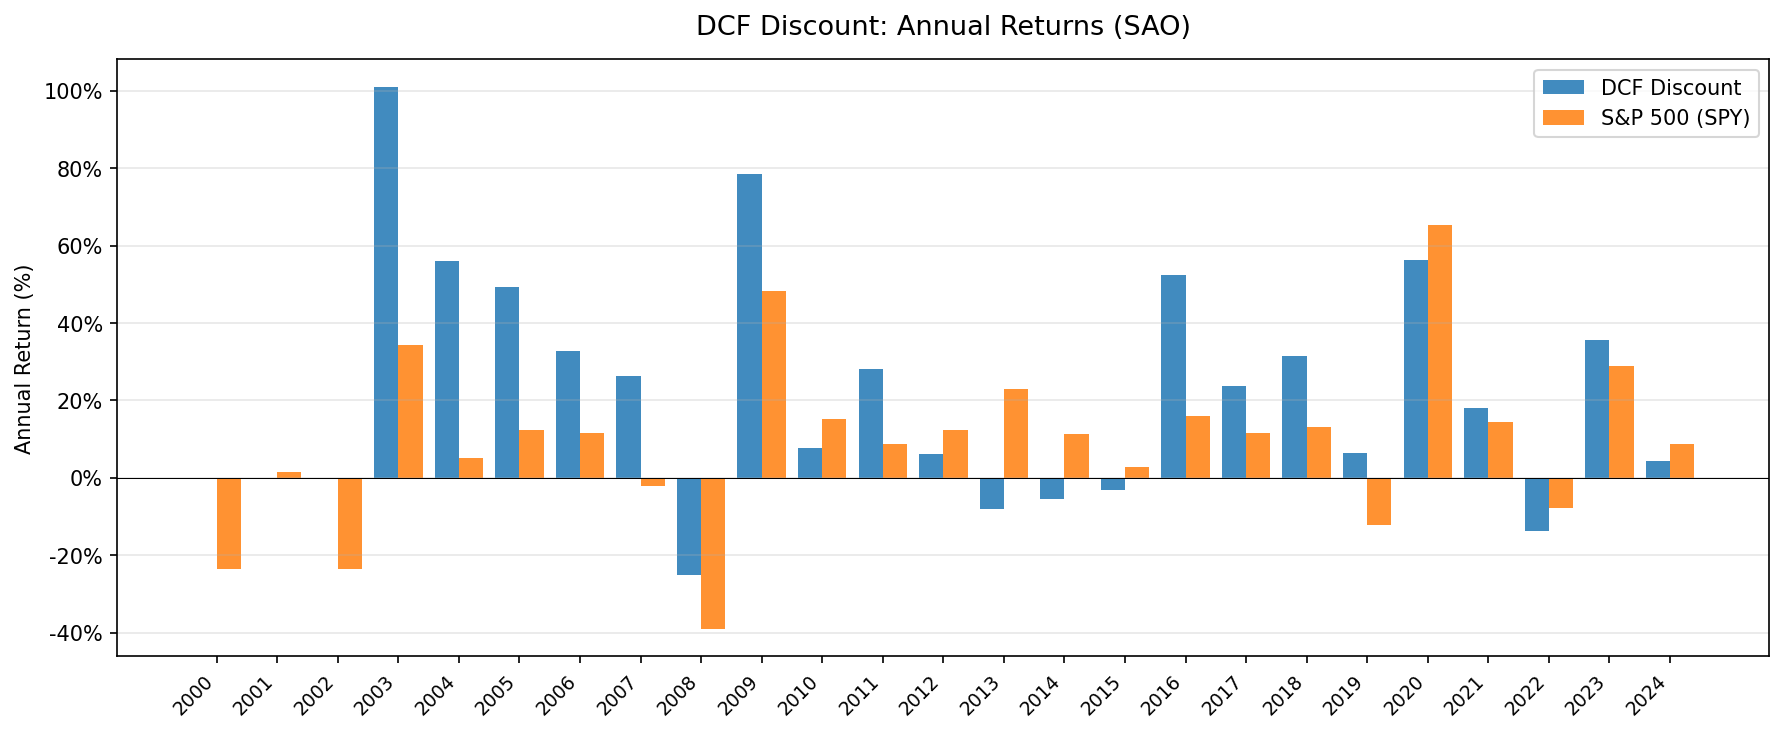
The annual returns show a portfolio that went big in up years and limited damage in bad ones. Sixteen of 22 invested years were positive. The median invested year returned roughly +26%. Only one year broke -25%, and that was the max drawdown year (2008).
| Year | DCF Brazil (BRL) | Bovespa | Excess |
|---|---|---|---|
| 2000 | +0.0% | -18.0% | +18.0% |
| 2001 | +0.0% | -4.8% | +4.8% |
| 2002 | -1.5% | -8.3% | +6.7% |
| 2003 | +86.0% | +91.2% | -5.1% |
| 2004 | +53.0% | +13.5% | +39.6% |
| 2005 | +42.7% | +49.0% | -6.3% |
| 2006 | +33.4% | +19.3% | +14.1% |
| 2007 | +26.9% | +38.6% | -11.8% |
| 2008 | -24.9% | -30.8% | +6.0% |
| 2009 | +75.2% | +60.2% | +15.0% |
| 2010 | +6.5% | -1.8% | +8.3% |
| 2011 | +22.6% | -8.0% | +30.5% |
| 2012 | +3.6% | -13.6% | +17.1% |
| 2013 | +3.0% | -7.5% | +10.5% |
| 2014 | -9.2% | +3.3% | -12.6% |
| 2015 | -5.4% | -7.7% | +2.3% |
| 2016 | +57.6% | +34.1% | +23.5% |
| 2017 | +23.9% | +28.7% | -4.7% |
| 2018 | +37.4% | +11.7% | +25.8% |
| 2019 | -1.6% | -26.4% | +24.8% |
| 2020 | +54.2% | +69.0% | -14.7% |
| 2021 | +21.9% | +1.2% | +20.7% |
| 2022 | -14.4% | -14.3% | -0.1% |
| 2023 | +34.7% | +25.0% | +9.8% |
| 2024 | +3.8% | +3.0% | +0.7% |
Key Observations
2000-2001: Cash years
The portfolio held cash for the first two years. FMP's coverage of Brazilian financial statements in the early 2000s is thin. Not enough SAO-listed companies with R$1B+ market cap had reliable free cash flow data to form a portfolio of 10 stocks. This isn't a model call. It's a data constraint. All performance metrics include these dead years. The effective invested-only CAGR is higher than the reported 18.05%.
2003-2005: The breakout (+86%, +53%, +43%)
This three-year stretch drove most of the compounding. The 2003 result deserves context. Lula da Silva won the presidency in October 2002 on a left-wing platform. Markets panicked. Brazilian assets sold off hard through late 2002, with the Real hitting 4.0 per dollar and bond spreads blowing out. Then Lula surprised everyone. He kept orthodox fiscal and monetary policy, appointed a conservative central bank governor, and maintained IMF commitments. The relief rally was massive. The screen captured the full rebound.
2004 and 2005 continued the trend. Brazilian GDP growth accelerated. Commodity prices surged. Iron ore, soybeans, and oil, Brazil's key exports, all rallied as Chinese demand exploded. Cash-flow-positive Brazilian companies were cheap on every metric, and the market re-rated them quickly.
2006-2009: Commodity supercycle, then crisis (+33%, +27%, -25%, +75%)
The mid-2000s commodity boom continued to lift Brazilian equities through 2006 and 2007. The Bovespa became a darling of emerging market investors. Then 2008 hit.
The portfolio's -24.87% loss in 2008 was its worst year. But the Bovespa fell -30.8%. The screen outperformed the benchmark by 6 points during the crisis. Stocks already priced at deep cash flow discounts didn't have as far to fall. Then 2009 delivered +75.2% as commodity prices recovered and global liquidity returned to emerging markets. The two-year net from 2008-2009 was strongly positive.
2013-2015: The Petrobras era (-8%, -5%, -3%)
Three consecutive negative years. Not catastrophic individually, but they represent the longest losing streak in the dataset. The backdrop: Operation Car Wash (Lava Jato) exposed massive corruption at Petrobras and across Brazil's political establishment. Investment collapsed. GDP contracted. Dilma Rousseff's government lost credibility on fiscal policy.
The losses were mild compared to India's -36% and -63% during its equivalent bad stretch (2018-2019). The DCF discount screen provided a floor. Cash-flow-positive companies at cheap valuations don't fall as hard when the broader market craters. The total damage across all three years was roughly -16% cumulative, which the portfolio recovered in the first half of 2016 alone.
2016-2019: Political reset and recovery (+58%, +24%, +37%, -2%)
The Temer government (2016-2018) brought austerity, labor reform, and renewed investor confidence. Bolsonaro's election in late 2018 triggered another re-rating on expectations of pension reform and privatization. The 2016 return of +57.6% was the sharpest single-year recovery in the dataset.
The 2018 result is notable. The Bovespa returned +11.7% that year, and Brazilian DCF stocks returned +37.4%. This was a year when most emerging market value strategies struggled. Brazilian equities decoupled from the EM selloff on reform optimism.
2020: COVID and the stimulus bounce (+54.2%)
The Bovespa crashed in March 2020. Brazilian equities dropped roughly 45% in weeks. Then global stimulus hit, commodity prices recovered, and the Real's weakness made Brazilian exports more competitive. The portfolio gained 54.2%, trailing the Bovespa's 69.0% for one of the years where the screen underperformed the benchmark.
Currency Warning
All returns are in Brazilian Reais (BRL). This is the most important caveat for Brazil.
The BRL depreciated from roughly 1.8 per USD in 2000 to roughly 6.0 per USD in 2024. That's cumulative depreciation of about 70%, or roughly 4-5% annual drag. This is the largest currency headwind of any market we tested. India's INR depreciation was about 2.5% per year. Korea's KRW was about 1.4% per year. Brazil's is nearly double India's.
| Metric | SAO (BRL) | SAO (est. USD) | Bovespa (BRL) |
|---|---|---|---|
| CAGR | 18.05% | ~13% | 8.58% |
| Excess CAGR | +9.47% | ~5% | -- |
Even after subtracting the full currency drag, the estimated USD-adjusted CAGR is roughly 13%. That still leaves about 5% annual excess over SPY. The alpha survives currency adjustment. It's smaller than the headline, but still the highest USD-adjusted figure across all markets.
For a USD-based investor, the real-world returns would depend on hedging costs, ADR availability, and the specific entry/exit timing on currency. BRL hedging costs have historically been high (4-6% annually) due to Brazil's elevated interest rates. An unhedged position captures the full BRL return but bears the currency risk. A hedged position sacrifices much of the excess return to lock in dollar terms.
Limitations
Currency drag is severe. The 4-5% annual BRL depreciation is the largest of any market we tested. The headline 18.05% CAGR overstates returns for anyone not denominated in Reais. USD-adjusted returns are roughly 13%, which is still strong but tells a different story than the raw number.
Two cash years. 2000-2001 were cash. The strategy didn't invest until data coverage improved in 2002. All performance metrics include these dead periods. The 2003 breakout (+86%) falls near the start of the active period, which flatters the overall numbers.
Small universe. The SAO exchange with a R$1B floor produces a narrower universe than the US, India, or Korea. Average stocks when invested was 36.2, and many of these names are resource-heavy. Sector concentration in commodities, mining, and financials is structural to the Brazilian market.
Down capture context. The 20.25% down capture is strong. Two of the benchmark's worst years (2000-2001) overlap with cash periods, which count as 0% returns against the Bovespa's losses. Strip those out and the down capture is still good, but not as extreme as the headline suggests.
Survivorship risk. Exchange membership uses current SAO profiles, not historical. Companies that delisted, restructured, or were acquired during the period aren't captured.
No local taxes. Brazilian capital gains tax for foreign investors (15-22.5% depending on holding period) and IOF (tax on financial operations) aren't modeled. These would reduce realized returns.
Takeaway
Over 25 years, buying Brazilian stocks trading below computed DCF fair value produced 18.05% CAGR in BRL terms and an estimated 13% in USD terms. Both figures are the highest of any market we tested. The 7,061% total return in Reais turned $10,000 into $716,099.
The risk profile is what sets Brazil apart. A max drawdown of just -24.87%. A Calmar ratio of 0.726. Down capture of 20.25%. The portfolio caught the big moves up (2003, 2009, 2016, 2020) and limited the damage during crises (2008, 2013-2015, 2022). That combination of high returns and shallow drawdowns is rare in single-country value strategies.
The currency is the complication. A 4-5% annual BRL depreciation cuts into real returns for non-BRL investors. Hedging is expensive. For domestic Brazilian investors, the numbers stand as reported and they're exceptional. For international investors, the ~13% USD-adjusted CAGR still makes this the strongest market in the dataset, just not as dominant as the headline suggests.
Part of a Series
This analysis is part of our DCF Discount global exchange comparison:
- DCF Discount on US Stocks (NYSE + NASDAQ + AMEX)
- DCF Discount on Indian Stocks (BSE + NSE)
- DCF Discount on Taiwan Stocks (TAI + TWO)
- DCF Discount on Canadian Stocks (TSX)
- DCF Discount on Korean Stocks (KSC)
- DCF Discount on German Stocks (XETRA)
- DCF Discount on Brazilian Stocks (SAO)
- DCF Discount on Australian Stocks (ASX)
- DCF Discount on Swedish Stocks (STO)
- DCF Discount: Global Exchange Comparison
Run This Screen Yourself
Query Brazilian stocks trading below DCF fair value on Ceta Research Data Explorer. Filter by exchange = 'SAO', set FCF yield >= 8.78%, and sort by yield descending. The screen updates daily with the latest filings.
The full backtest code (Python + DuckDB) is available in our GitHub repository.
Data: Ceta Research, FMP financial data warehouse. Universe: SAO. Annual rebalance (April), equal weight, 2000-2025. Returns in BRL unless noted. DCF computed via Gordon Growth Model (g=2.5%, r=10%, multiple=13.67x).