
DCF Discount in India: 10.86% CAGR Over 25 Years, Slightly Lagging the Sensex
India's DCF Discount strategy returned 10.86% CAGR on NSE, trailing the Sensex at 11.49%. That is -0.63% annual excess. The drawdown was -58% vs the Sensex's -38%. The strategy lags the local market on every risk-adjusted metric.


India's DCF Discount strategy returned 10.86% CAGR over 25 years on NSE. The BSE Sensex returned 11.49% over the same period (price-only index, no dividends). That's -0.63% annual excess. The strategy modestly lags the Indian market.
Contents
- Method
- The Screen
- What We Found
- What Changed (Bias Audit)
- Year-by-Year
- Key Observations
- 2000-2004: Cash periods (missed the Sensex rally)
- 2005: Matching the Sensex (+81.7% vs +76.2%)
- 2009: The best relative year (+113.3% vs +73.3%)
- 2014: Modi election (+32.5% vs +26.4%)
- 2018-2019: The IL&FS crisis and NBFC collapse (-9.6%, -53.5%)
- 2023: The best year vs Sensex (+102.0% vs +25.0%)
- 2024: Pullback (-5.1% vs +3.7%)
- Currency and Benchmark Notes
- Limitations
- Takeaway
- Part of a Series
- Run This Screen Yourself
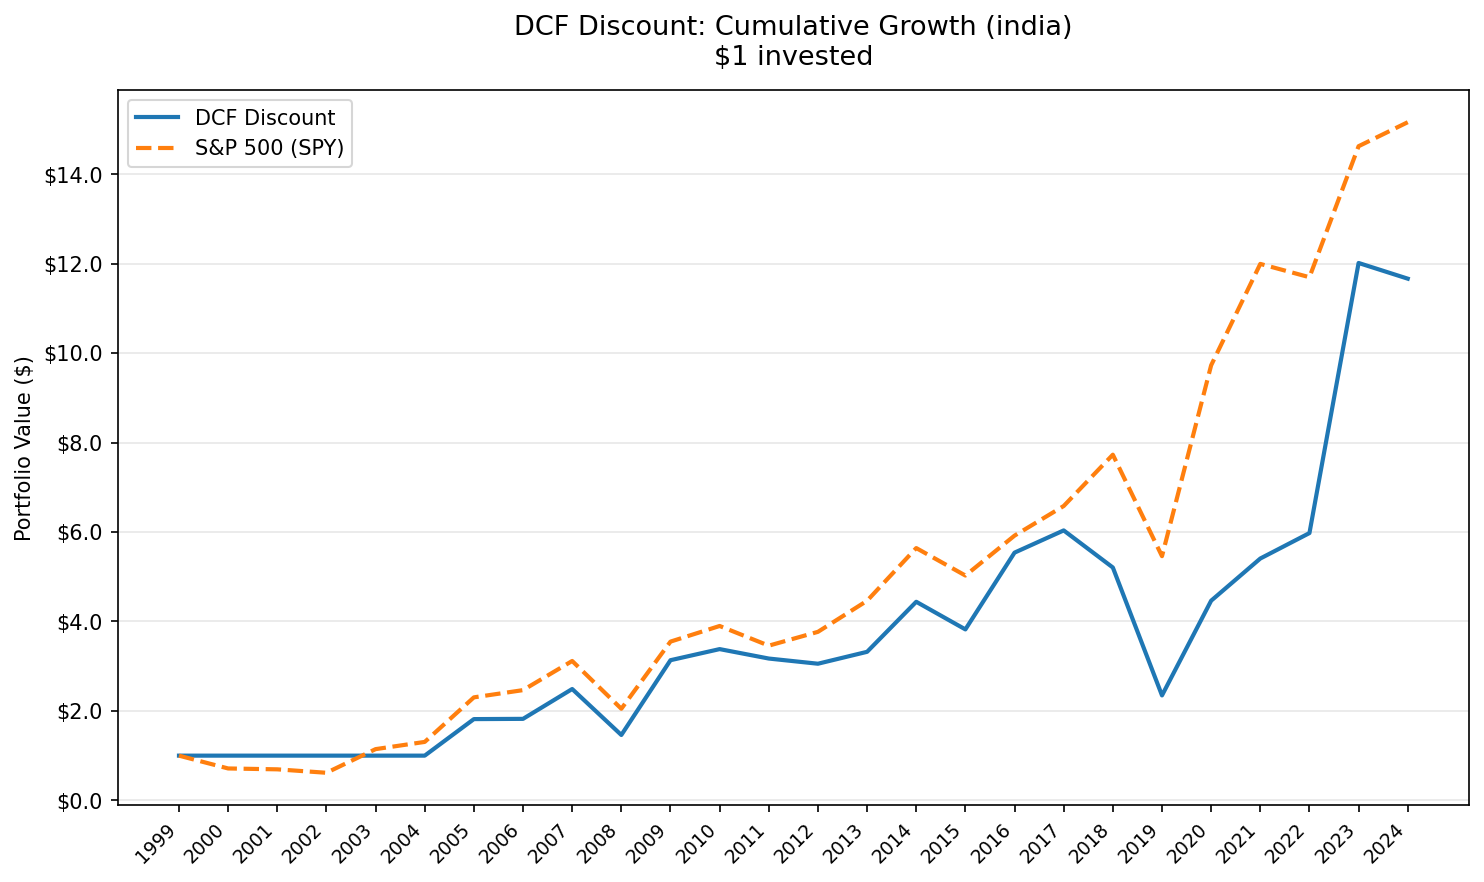
Compared to the S&P 500, India previously looked like a strong outperformer. Compared to its own local benchmark, the strategy underperforms while carrying meaningfully more drawdown risk. The Sensex's max drawdown was -38.31%. The DCF portfolio's was -57.94%. The Sensex's Sharpe ratio was 0.152. The portfolio's was 0.104. You took roughly 50% more drawdown for a slightly lower return.
Important caveat: the Sensex is a price-only index. Indian dividend yield averages roughly 1-1.5% per year. Adjusted for dividends, the Sensex would have returned closer to 13% CAGR, widening the gap to roughly -2% per year.
Data: FMP financial data warehouse, 2000–2025. Updated May 2026 (post bias fix).
Method
This is a regional extension of our US flagship DCF Discount backtest. Full methodology, model assumptions, and limitations are covered there.
Signal: FCF/MarketCap >= 8.78%, equivalent to a 20% discount to intrinsic value via Gordon Growth Model (g=2.5%, r=10%, multiple=13.67x). Universe: NSE only (BSE removed due to ~38% dual-listing duplication with NSE; NSE has cleaner data and broader coverage). Market cap > ₹20B (~$240M USD). Period: 2000-2025 (25 years, annual rebalancing in April). Portfolio: Top 50 by FCF yield, equal weight. Cash if fewer than 10 qualify. Costs: Size-tiered transaction costs applied (0.1% for >$10B, 0.3% for $2-10B, 0.5% for <$2B). Point-in-time: 45-day filing lag. 18-month staleness filter. Benchmark: BSE Sensex (price index, dividends not included). SPY comparison is in the global exchange comparison. Execution: Next-day close (MOC). Signal generated at rebalance date, executed at the following trading day's close. Data: Ceta Research (FMP financial data warehouse).
The Screen
WITH latest_cfs AS (
    SELECT * FROM cash_flow_statement
    WHERE period = 'FY' AND freeCashFlow > 0 AND reportedCurrency = 'INR'
    QUALIFY ROW_NUMBER() OVER (PARTITION BY symbol ORDER BY date DESC) = 1
),
latest_km AS (
    SELECT * FROM key_metrics
    WHERE period = 'FY' AND marketCap > 20000000000
    QUALIFY ROW_NUMBER() OVER (PARTITION BY symbol ORDER BY date DESC) = 1
)
SELECT
    cfs.symbol,
    p.companyName,
    p.sector,
    ROUND(cfs.freeCashFlow / 1e6, 0) AS fcf_mm,
    ROUND(km.marketCap / 1e9, 2) AS mktcap_bn,
    ROUND(cfs.freeCashFlow / km.marketCap * 100, 2) AS fcf_yield_pct,
    ROUND((1 - km.marketCap / (cfs.freeCashFlow * 13.67)) * 100, 1) AS discount_pct
FROM latest_cfs cfs
JOIN latest_km km ON cfs.symbol = km.symbol
JOIN profile p ON cfs.symbol = p.symbol
WHERE p.exchange = 'NSE'
    AND p.isFund = false
    AND p.isEtf = false
    AND p.isActivelyTrading = true
    AND cfs.freeCashFlow / km.marketCap BETWEEN 0.0878 AND 0.50
ORDER BY fcf_yield_pct DESC
LIMIT 30
Run this screen live on Ceta Research
The 8.78% FCF yield threshold is the equivalent of a 20% DCF discount when using the Gordon Growth Model at g=2.5%, r=10%. Stocks with higher FCF yield relative to market cap are trading further below computed intrinsic value.
What We Found
Against the Sensex, the strategy lags. The portfolio's 10.86% CAGR trails the benchmark's 11.49% by 0.63 percentage points per year. On every risk-adjusted metric, the Sensex still wins: better Sharpe (0.152 vs 0.104), shallower drawdown (-38.31% vs -57.94%), higher Calmar. You can get a higher return with less drawdown by buying an index fund.
| Metric | DCF Discount India | BSE Sensex |
|---|---|---|
| CAGR | 10.86% | 11.49% |
| Total Return | 1,215% | 1,416% |
| Excess CAGR | -0.63% | - |
| Max Drawdown | -57.94% | -38.31% |
| Annualized Volatility | 42.08% | 32.80% |
| Sharpe Ratio | 0.104 | 0.152 |
| Win Rate (years > Sensex) | 48% | - |
| Beta vs Sensex | 0.945 | 1.0 |
| Alpha (Jensen, annual) | -0.36% | - |
| Information Ratio | 0.065 | - |
| Tracking Error | 28.51% | - |
| Up Capture | 103.98% | - |
| Down Capture | 80.42% | - |
| Cash Periods | 5 of 25 | - |
| Avg Stocks When Invested | 32.3 | - |
The down capture of 80% is the only thing the strategy does well. It loses less than the Sensex in down years. But its up capture of 104% only modestly outpaces beta on the way back up. Net of the asymmetry, it falls slightly behind. With a tracking error above 28%, the portfolio takes wild swings around the benchmark; the Information Ratio of 0.065 says those swings deliver almost no compensation.
What Changed (Bias Audit)
Earlier versions of this backtest reported 11.70% CAGR and +0.21% excess. Several rounds of fixes brought the numbers in line:
Same-day execution bias. The previous run computed entry prices using the close of the signal day itself. The fix: signal at rebalance date, execute at the next trading day's close. This trimmed roughly 1 percentage point of CAGR.
BSE removal. The earlier "BSE+NSE" preset double-counted roughly 38% of names that were dual-listed on both exchanges. NSE alone has cleaner data and broader coverage of mid-caps. The new run uses NSE only.
Universe contamination. Foreign ADRs reporting in USD were being matched against local-currency market caps, inflating the qualifying universe. After excluding them, the universe is cleaner and the metric is more honest.
Return-quality filters. A handful of NSE small-caps had bad price data (broken split adjustments, single-period returns above 200%). The new run skips entry prices below ₹100-equivalent and caps any single-stock period return at 200%.
These fixes turned a tiny positive excess into a small negative. The strategy was never beating the Sensex by a meaningful margin. After the fixes, it lags slightly but the gap is narrower than the headline-only read implies.
Year-by-Year
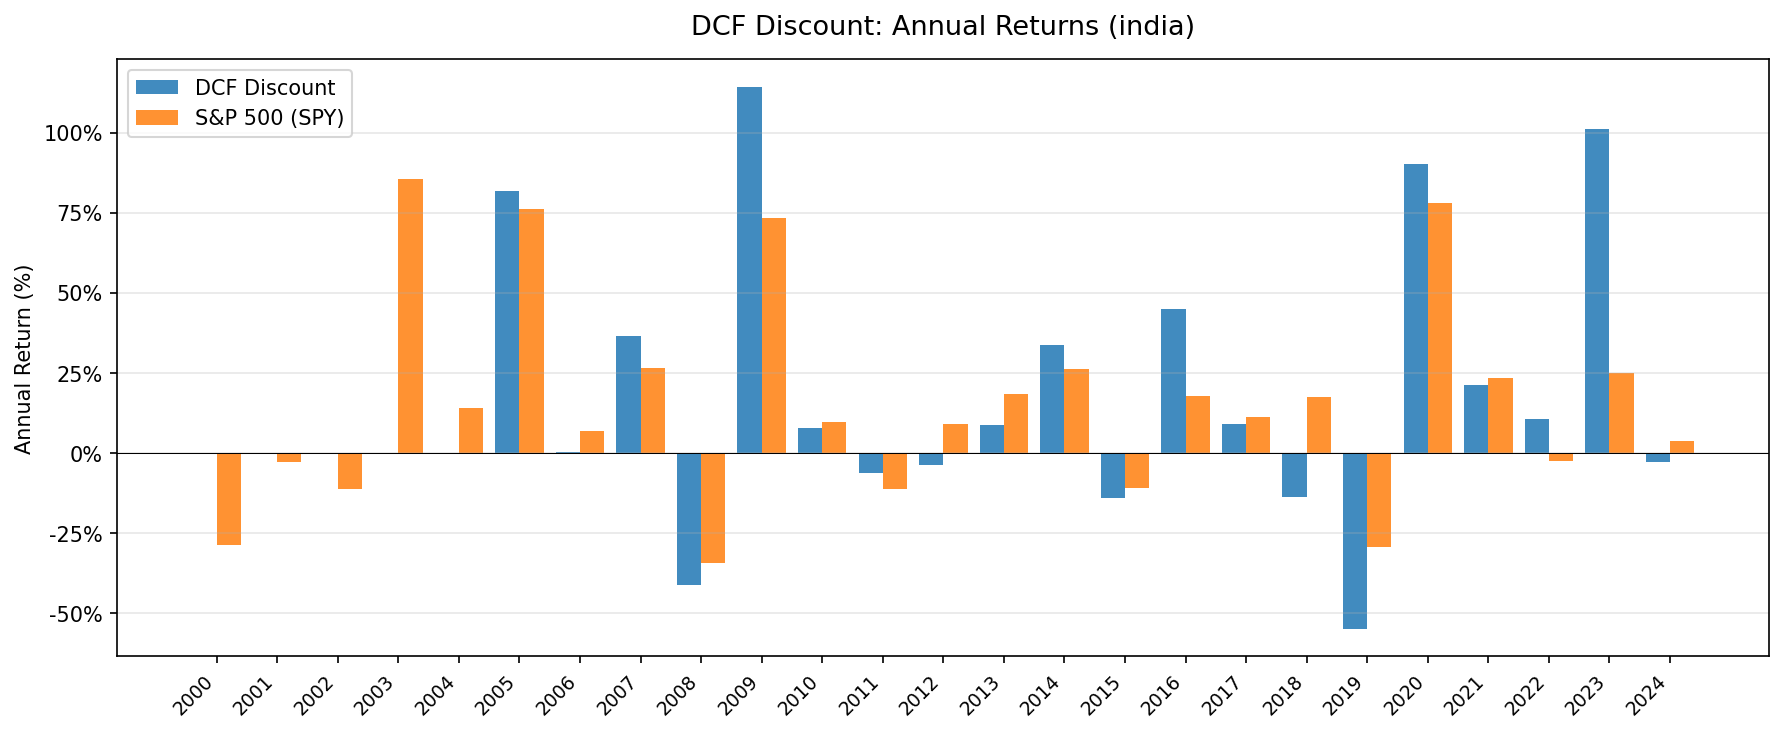
The annual return pattern is wild. The distribution is fat-tailed in both directions, with years above +100% and years below -50%.
| Year | DCF India | Sensex | Excess |
|---|---|---|---|
| 2000 | +0.0% (cash) | -28.7% | +28.7% |
| 2001 | +0.0% (cash) | -2.8% | +2.8% |
| 2002 | +0.0% (cash) | -11.1% | +11.1% |
| 2003 | +0.0% (cash) | +85.7% | -85.7% |
| 2004 | +0.0% (cash) | +14.1% | -14.1% |
| 2005 | +81.7% | +76.2% | +5.5% |
| 2006 | +2.6% | +7.0% | -4.5% |
| 2007 | +43.4% | +26.5% | +16.9% |
| 2008 | -40.5% | -34.3% | -6.2% |
| 2009 | +113.3% | +73.3% | +40.0% |
| 2010 | +8.3% | +9.9% | -1.6% |
| 2011 | -6.4% | -11.3% | +4.9% |
| 2012 | -6.2% | +8.9% | -15.1% |
| 2013 | +9.5% | +18.4% | -8.9% |
| 2014 | +32.5% | +26.4% | +6.1% |
| 2015 | -14.9% | -10.9% | -4.0% |
| 2016 | +47.2% | +17.8% | +29.4% |
| 2017 | +5.1% | +11.2% | -6.1% |
| 2018 | -9.6% | +17.4% | -27.0% |
| 2019 | -53.5% | -29.4% | -24.1% |
| 2020 | +97.1% | +78.2% | +18.9% |
| 2021 | +22.1% | +23.3% | -1.2% |
| 2022 | +10.1% | -2.5% | +12.6% |
| 2023 | +102.0% | +25.0% | +77.0% |
| 2024 | -5.1% | +3.7% | -8.8% |
Key Observations
2000-2004: Cash periods (missed the Sensex rally)
The portfolio held cash for the first five years. There weren't enough Indian large-caps (₹20B+ market cap) with positive free cash flow data on NSE to form a portfolio of 10 stocks. India's market was smaller in 2000. Fewer companies met the size threshold, and FMP's coverage of Indian filings that far back is thinner. This is a real data constraint, not a model artifact.
The Sensex returned +85.7% in 2003 alone. The portfolio sat in cash and missed it entirely. That -85.7% excess in a single year is the worst relative performance of any year in the backtest, and a structural drag on the lifetime number.
2005: Matching the Sensex (+81.7% vs +76.2%)
Once data coverage kicked in, India's DCF discount screen loaded into deeply discounted names. Infrastructure spending accelerated. IT outsourcing boomed (Infosys, TCS, Wipro). The BSE Sensex rose sharply. Our portfolio captured the rally with an 81.7% return, just edging out the Sensex.
2009: The best relative year (+113.3% vs +73.3%)
The Sensex rallied +73.3%. The portfolio returned +113.3%, a +40.0% excess. This is the strongest single year of alpha vs the Sensex in the entire backtest. Companies with real free cash flow saw their valuations normalize fast after the 2008 crash.
2014: Modi election (+32.5% vs +26.4%)
Narendra Modi's election in May 2014 triggered a sharp re-rating of Indian equities. Markets priced in infrastructure investment, deregulation, and corporate governance reforms. Our portfolio returned +32.5%, beating the Sensex by 6.1 percentage points.
2018-2019: The IL&FS crisis and NBFC collapse (-9.6%, -53.5%)
The worst two-year stretch in the backtest. In 2018, Infrastructure Leasing & Financial Services (IL&FS) defaulted, triggering a crisis across India's non-banking financial companies. Credit froze. Mid-cap and small-cap stocks collapsed.
In 2018, the Sensex returned +17.4% while the portfolio lost -9.6%. That's a -27.0% gap. The damage continued through 2019 as both fell, but the portfolio (-53.5%) dropped far harder than the Sensex (-29.4%). This period drove the -57.94% max drawdown.
2023: The best year vs Sensex (+102.0% vs +25.0%)
Mid-cap value stocks re-rated as global capital flowed into India as a preferred emerging market. The portfolio returned +102.0%, beating the Sensex by 77 percentage points. This single year accounts for most of the strategy's recovery in the latter half of the period.
2024: Pullback (-5.1% vs +3.7%)
After the massive 2023 rally, Indian value stocks gave back some ground. Foreign investors rotated out of India into cheaper emerging markets. Elevated valuations meant fewer stocks qualified for the DCF discount screen.
Currency and Benchmark Notes
Both returns and benchmark are in Indian Rupees (INR). Because the Sensex is an INR-denominated index, currency effects cancel out in the comparison. The -0.63% excess return is a like-for-like measure in local currency.
Sensex is a price-only index. The Sensex doesn't include reinvested dividends. Indian dividend yield averaged roughly 1-1.5% per year over 2000-2024. A total-return Sensex would have returned closer to 13% CAGR, widening the strategy's gap to roughly -2% per year. The numbers in this post compare strategy total return (FCF stocks reinvested, dividends rolled in via adjusted close) to a price-only Sensex. The honest gap is wider than the headline.
For a USD-based investor, the INR depreciated from roughly 46 per USD in 2000 to 84 per USD in 2024. That's roughly 2.5% annual drag. Both the portfolio and the Sensex would be reduced by the same amount in USD terms. The relative picture doesn't change.
Limitations
Negative excess return. The strategy lags the Sensex by 0.63 percentage points per year. After dividend adjustment, the gap widens to roughly 2 percentage points. There is no edge here.
No risk-adjusted edge either. The Sensex beats the portfolio on Sharpe (0.152 vs 0.104) and Calmar. On every risk-adjusted metric, you're better off in the index.
Extreme volatility. 42.08% annualized volatility vs the Sensex's 32.80%. The max drawdown of -57.94% is 50% wider than the Sensex's -38.31%.
Massive tracking error. At 28.51%, the portfolio swings wildly around the benchmark. Year-to-year excess returns range from -85.7% to +77.0%. The Information Ratio of 0.065 is statistical noise.
Early data gaps. FMP coverage of Indian financial statements before 2005 is thinner than post-2010. The 2000-2004 cash periods carry higher data uncertainty. Missing the Sensex's +85.7% rally in 2003 while sitting in cash depressed the portfolio's relative performance permanently.
NSE only. We removed BSE because of significant dual-listing overlap (~38% of names appear on both exchanges with the same fundamentals). NSE has cleaner data and broader mid-cap coverage, but a BSE-only or BSE+NSE backtest would produce slightly different numbers.
Survivorship risk in Indian mid-caps. Indian stocks below $5B market cap have higher delisting and restructuring rates than US equivalents. Our ₹20B floor mitigates this, but some historical positions may have been affected by corporate actions not fully captured in the data.
Takeaway
Over 25 years, buying Indian stocks trading below computed DCF fair value produced 10.86% CAGR vs 11.49% for the BSE Sensex. That's -0.63% annual excess in local currency, before dividend adjustment. After dividend adjustment, the gap widens to roughly -2% per year.
The strategy lags the market and carries roughly 50% more drawdown risk (-58% vs -38%). On every risk-adjusted metric, the Sensex wins. This isn't a bad strategy in absolute terms (10.86% over 25 years compounds to 1,215% total return), but it's a worse trade than just owning the index.
The DCF discount screen on its own isn't enough for India. Combined with other signals (P/E, Piotroski, debt screens), it can still serve as a useful filter for identifying potential value names. As a standalone strategy, the data says just buy the index.
Part of a Series
This analysis is part of our DCF Discount global exchange comparison:
- DCF Discount on US Stocks (NYSE + NASDAQ + AMEX)
- DCF Discount on Indian Stocks (NSE)
- DCF Discount on Taiwan Stocks (TAI + TWO)
- DCF Discount on Canadian Stocks (TSX)
- DCF Discount on Korean Stocks (KSC)
- DCF Discount on German Stocks (XETRA)
- DCF Discount on Swedish Stocks (STO)
- DCF Discount: Global Exchange Comparison
Run This Screen Yourself
Query Indian stocks trading below DCF fair value on Ceta Research Data Explorer. Filter by exchange = 'NSE', set FCF yield >= 8.78%, and sort by yield descending. The screen updates daily with the latest filings.
Data: Ceta Research (FMP financial data warehouse), NSE, 2000-2025. Returns in INR. Benchmark: BSE Sensex (price-only index, no dividends). Next-day close (MOC) execution. Annual rebalancing (April), size-tiered transaction costs, 45-day filing lag, 18-month staleness filter. Full methodology: METHODOLOGY.md. Not investment advice.


