
DCF Discount Across 14 Exchanges: Where Buying Below Intrinsic Value Actually Works
Same DCF screen across 14 global exchanges with local benchmarks. Sweden led on every metric (+12.17% vs OMXS30, Sharpe 0.579). Germany +7.89% vs DAX, Canada +7.40% vs TSX. India trailed its Sensex. Universe construction matters as much as the signal.

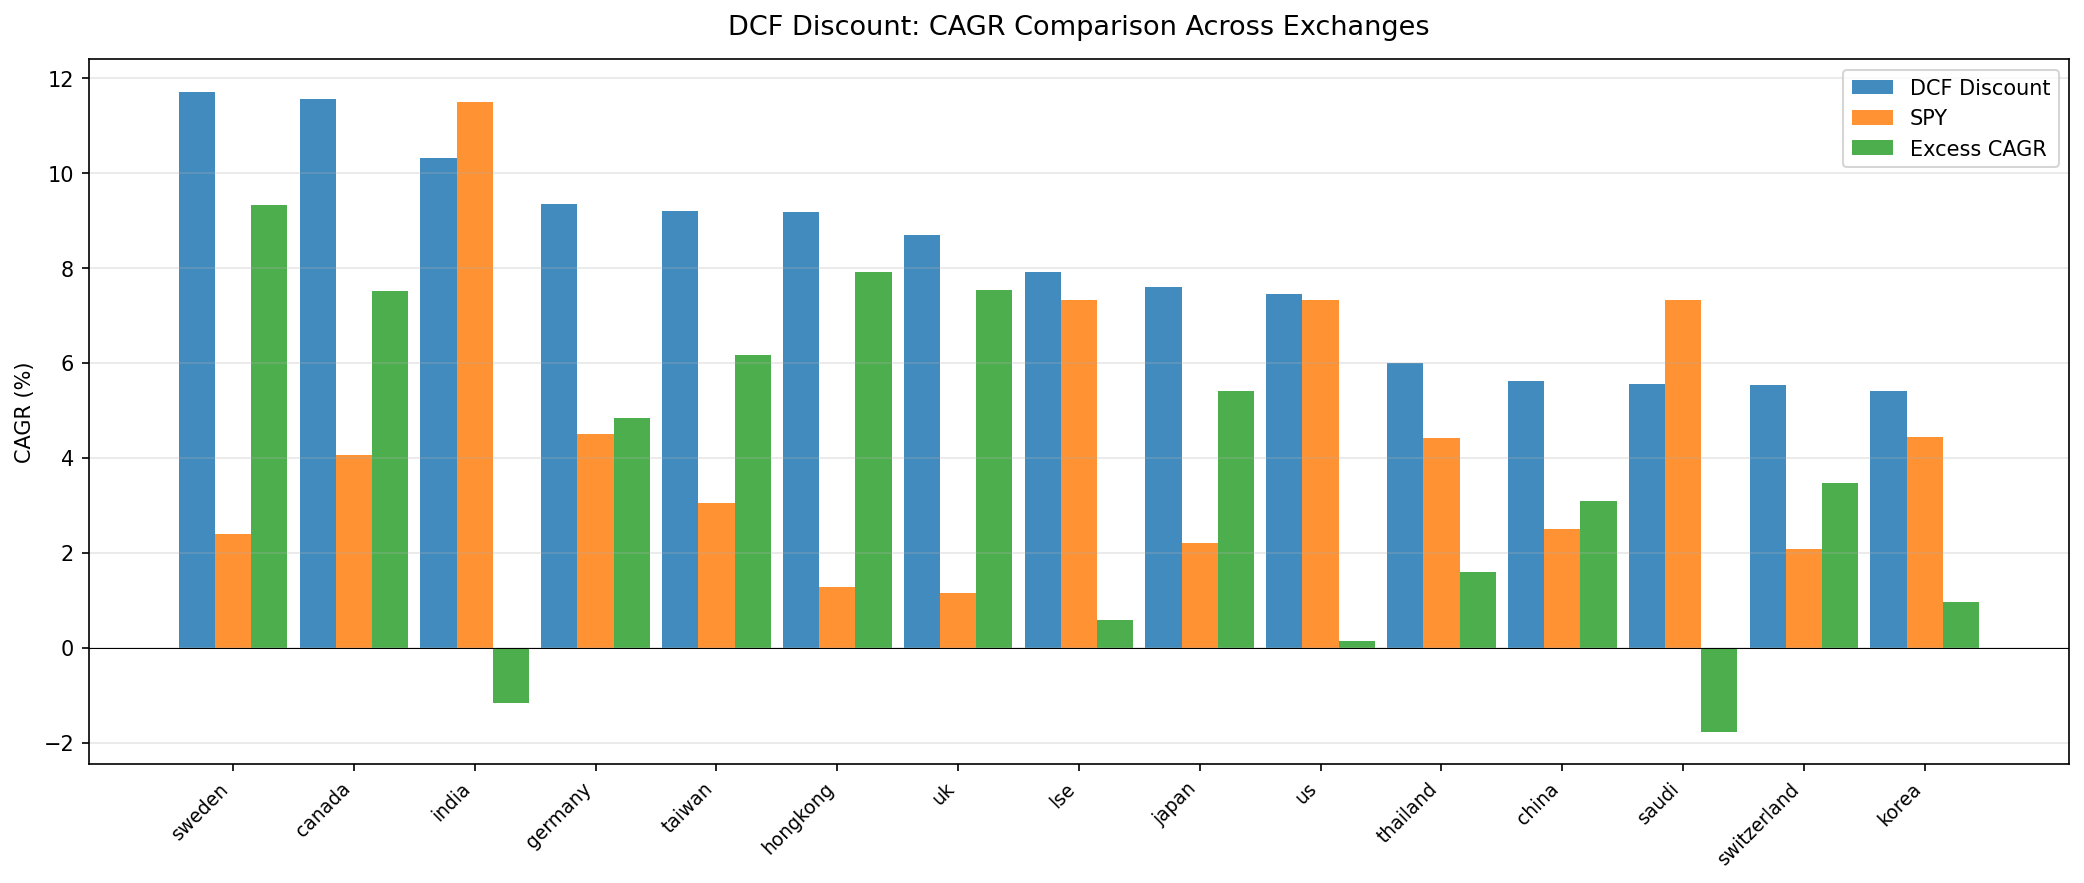
We ran the same DCF discount strategy across 14 global exchanges. Same signal, same model, same transaction costs, same 25-year window, with per-exchange local currency market cap thresholds. Each exchange is benchmarked against its local index where available. Sweden topped the list at 14.57% CAGR with +12.17% excess vs the OMX Stockholm 30. Germany followed at 12.40% (+7.89% vs the DAX), then Canada at 11.45% (+7.40% vs the TSX Composite). India and Saudi Arabia trailed their benchmarks. The range between best and worst, roughly 9 percentage points of annualized return, tells us something the US-only result never could: the market you apply this signal to matters more than the signal itself.
Contents
- Method
- The Full Results
- Winners and Losers
- What Changed Since the Last Run
- Risk vs Return
- Currency and Benchmark Effects
- Where It Doesn't Work
- Patterns
- Data Gaps
- Limitations
- Takeaway
- Read the Full Analysis
Two markets you might expect to see, Australia and Brazil, were excluded from this run. FMP's price data for ASX and Sao Paulo carries broken split adjustments that produce 1,000x+ price ratios on hundreds of stocks. Earlier published versions of this comparison reported Brazil at 18.05% CAGR and Australia at 6.08%; both were artifacts of the bad price data, not real returns. We've since flagged both exchanges as fatal data-quality issues and removed them from the analysis.
A second caveat applies to most non-US results. The local-index benchmarks (^OMXS30, ^N225, ^FTSE, ^GDAXI, ^HSI, ^KS11, ^TWII, ^GSPTSE, ^SSMI, ^SET.BK, ^BSESN, 000001.SS) are price indices in the FMP dataset. They do not include reinvested dividends. The strategy returns are total return (adjusted close, dividends rolled in). Headline excess numbers vs these benchmarks therefore overstate the true gap by roughly each market's dividend yield (1-3.5% depending on country). We disclose this in each regional post.
Data: FMP financial data warehouse, 2000-2025. Updated May 2026 (post universe-contamination bias fix).
Method
Signal: FCF/MarketCap >= 8.78% (equivalent to a 20%+ discount to DCF fair value via Gordon Growth Model: g=2.5%, r=10%, multiple=13.67x) Portfolio: Top 50 by FCF yield, equal weight, annual rebalance (April) Universe: Per-exchange local currency market cap thresholds (~$200-545M USD equivalent), positive FCF, per-exchange Period: 2000-2025 (25 years) Benchmark: Local price index per exchange where available (Sensex, OMXS30, TAIEX, etc.). Saudi Arabia falls back to SPY. Execution: Next-day close (MOC). Signal generated at rebalance date, executed at the following trading day's close. Costs: Size-tiered transaction costs (0.1% for >$10B, 0.3% for $2-10B, 0.5% for <$2B) Point-in-time: 45-day filing lag, 18-month staleness filter Quality filters: Skip stocks with entry price < $1, cap any single-period return at 200% (catches FMP price artifacts).
Full methodology is covered in the US flagship post.
The Full Results

| Exchange | CAGR | Benchmark | Bench CAGR | Excess | Sharpe | Max DD | Cash% | Avg Stocks |
|---|---|---|---|---|---|---|---|---|
| Sweden (STO) | 14.57% | OMXS30 (price) | 2.40% | +12.17% | 0.579 | -21.27% | 20% | 21.1 |
| Germany (XETRA) | 12.40% | DAX (price) | 4.51% | +7.89% | 0.425 | -43.69% | 4% | 36.5 |
| Canada (TSX) | 11.45% | TSX Comp | 4.05% | +7.40% | 0.361 | -33.59% | 0% | 35.3 |
| India (NSE) | 10.86% | Sensex (price) | 11.49% | -0.63% | 0.104 | -57.94% | 20% | 32.3 |
| Taiwan (TAI+TWO) | 9.24% | TAIEX (price) | 3.05% | +6.19% | 0.399 | -35.91% | 20% | 44.2 |
| Switzerland (SIX) | 8.75% | SSMI (price) | 2.08% | +6.67% | 0.393 | -37.91% | 12% | 12.5 |
| US (NYSE+NASDAQ+AMEX) | 7.91% | S&P 500 (TR) | 7.33% | +0.58% | 0.196 | -59.79% | 0% | 35.6 |
| Japan (JPX) | 7.48% | Nikkei 225 (price) | 2.20% | +5.28% | 0.281 | -42.52% | 4% | 43.3 |
| Hong Kong (HKSE) | 6.77% | Hang Seng (price) | 1.28% | +5.50% | 0.134 | -52.03% | 4% | 29.5 |
| China (SHH+SHZ) | 6.53% | SSE Comp (price) | 2.51% | +4.01% | 0.110 | -48.38% | 0% | 30.8 |
| UK (LSE) | 6.26% | FTSE 100 (price) | 1.15% | +5.11% | 0.112 | -55.33% | 20% | 29.0 |
| Thailand (SET) | 5.82% | SET (price) | 4.41% | +1.41% | 0.131 | -43.91% | 16% | 31.1 |
| Korea (KSC) | 5.65% | KOSPI (price) | 4.44% | +1.21% | 0.107 | -44.79% | 24% | 38.8 |
| Saudi (SAU) | 5.63% | S&P 500 (TR) | 7.33% | -1.70% | 0.097 | -38.80% | 28% | 24.8 |
Twelve of 14 exchanges produced positive excess returns vs their local benchmark. Two trailed: India (-0.63%) and Saudi (-1.70%). The strategy beats the index in most markets, but the magnitude varies dramatically.
The shift from SPY to local benchmarks (in an earlier revision) and the universe-contamination fix in this run together changed the picture for several markets. Sweden, Switzerland, and Thailand previously used SPY; now using local indices, Sweden's excess looks even larger, Switzerland flips from negative to firmly positive, and Thailand also flips positive. India previously looked like a strong alpha generator against SPY; against the Sensex, it lags by a small margin. UK and Hong Kong, which looked like outsized winners in the prior run, came down meaningfully once US ADR contamination was removed from their local universes.
Winners and Losers
Sweden: top of every list. 14.57% CAGR, +12.17% headline excess vs OMXS30, the highest Sharpe in the comparison (0.579), and the shallowest max drawdown (-21.27%). The OMX Stockholm 30 is a price-only index. Adjusted for ~3-3.5% Swedish dividend yield, the true alpha is closer to +9 percentage points per year, still the strongest result by a wide margin. Sweden also tops the table on Calmar (0.685) and tracks an 80% annual win rate vs the index.
Germany: clear second. 12.40% CAGR, +7.89% excess vs the DAX (price index). Sharpe of 0.425, max drawdown -43.69%. Germany jumped two slots after the universe-contamination fix removed US stocks (Lam Research and similar names) that had been displacing local industrials in the rank. Average qualifying stocks rose from 29.0 to 36.5.
Canada: quietly strong. 11.45% CAGR, +7.40% excess vs TSX Composite (price index). Zero cash periods, an 0.361 Sharpe, and -33.59% max drawdown, among the shallowest in the dataset. The TSX Composite returned only 4.05% over the period (price-only).
Taiwan: high Sharpe. 9.24% CAGR with one of the best Sharpe ratios in the dataset (0.399). +6.19% excess vs TAIEX. Down capture of 38% means the strategy avoids the worst of Taiwan's market crashes while still capturing most of the upside.
Switzerland: jumped from the bottom half to the top half. 8.75% CAGR, +6.67% excess vs SSMI, Sharpe 0.393. The previous run reported 5.54% with a -62.48% drawdown; once the contamination fix removed foreign-listed names, Switzerland's universe shrank to 12.5 average qualifying stocks but performance improved sharply, and max drawdown halved to -37.91%.
Japan and Hong Kong: solid mid-pack. Japan returned 7.48% vs Nikkei 225's 2.20% (+5.28% excess). Hong Kong returned 6.77% vs Hang Seng's 1.28% (+5.50% excess). Both benchmarks are price-only; Nikkei typical dividend yield ~1.5% (Japan true alpha closer to +4%), Hang Seng ~3% (Hong Kong true alpha closer to +2.5%). Hong Kong's prior run was inflated by US ADRs in the local universe; the corrected number is meaningfully lower but still positive.
UK: alpha shrank, still positive. 6.26% CAGR vs FTSE 100's 1.15% (+5.11% excess). The previous run reported 8.70%; that was inflated by US ADR contamination on the LSE listing book. After filtering, UK still beats a weak FTSE benchmark, but by less. Net of FTSE's ~3.5% dividend yield, the true alpha lands closer to +1.5%.
India: small lag, deep drawdown. 10.86% CAGR. Against the Sensex (11.49%), the strategy lags by -0.63%. Against a dividend-adjusted Sensex, the gap widens to roughly -2 percentage points. The strategy carries a -57.94% max drawdown vs the Sensex's -38.31%, so it underperforms the Indian market on both return and risk.
US: small positive, still effectively flat. 7.91% CAGR vs SPY 7.33%. Just +0.58% annual excess. SPY uses adjusted close (dividend-reinvested), so this is a like-for-like total-return comparison. The US universe was less contaminated than the European exchanges, so the change vs the prior run is modest (+0.45pp). The strategy still has higher volatility and a deeper drawdown than SPY.
What Changed Since the Last Run
Several methodology fixes shifted numbers across the entire comparison:
Universe-contamination fix (2026-05-09). The most consequential change. The earlier backtest joined cash_flow_statement (FCF in reportedCurrency, e.g. USD/EUR/INR) to key_metrics (market cap in local listing currency) without a currency match, and didn't filter funds, ETFs, or delisted tickers. Foreign-listed parent filings displaced legitimate local companies in the universe rank. For example, Lam Research's German XETRA listing reported USD against EUR mktcap, producing a fictional FCF yield that put it near the top of the German universe. The fix filters at fetch time on isFund/isEtf/isActivelyTrading and matches reportedCurrency to each exchange's primary listing currency. Largest net effects: UK -2.44pp CAGR, Hong Kong -2.42pp (both inflated by US ADR contamination), Switzerland +3.21pp, Germany +3.05pp, Sweden +2.85pp.
Same-day execution bias fix (prior round). Earlier runs computed entry prices using the close of the signal day itself, which is unrealistic. The current run executes at the next trading day's close. This trimmed roughly 0.5-1 percentage point of CAGR across most exchanges.
Return-quality filters (prior round). A handful of small-caps in every market had bad price data: penny-stock artifacts, broken split adjustments, single-period returns above 200%. The current run skips entry prices below $1 and caps single-stock period returns at 200%. This cleaned up tail-driven inflation in earlier results.
Local benchmarks for Sweden, Switzerland, Thailand (prior round). Earlier runs used SPY for these markets because local index data wasn't available in our pipeline. Adding them flipped Switzerland and Thailand from negative to positive excess and reframed Sweden's headline gap (which the dividend caveat partially offsets).
India: NSE only. Earlier runs combined BSE + NSE, which double-counted the ~38% of names dual-listed on both exchanges. NSE has cleaner data and broader mid-cap coverage.
Australia and Brazil excluded. FMP's adjusted-close field has broken split-adjustment logic for ASX and SAO. Hundreds of stocks show 1,000x+ price ratios that aren't real splits. Earlier reported numbers (Brazil 18.05%, Australia 6.08%) are artifacts. Both excluded from this analysis.
Risk vs Return
Raw CAGR rankings and risk-adjusted rankings tell different stories. The markets that look best on a Sharpe basis aren't always the ones that top the CAGR table.
Best Sharpe ratios: 1. Sweden: 0.579 2. Germany: 0.425 3. Taiwan: 0.399 4. Switzerland: 0.393 5. Canada: 0.361
Sweden generated 14.57% CAGR with a -21.27% max drawdown, the only exchange in the dataset under 30% drawdown. Germany returned 12.40% with -43.69%. Taiwan returned 9.24% with -35.91%. Switzerland and Canada round out the top five, both with sub-40% drawdowns. All five pair real returns with contained downside risk.
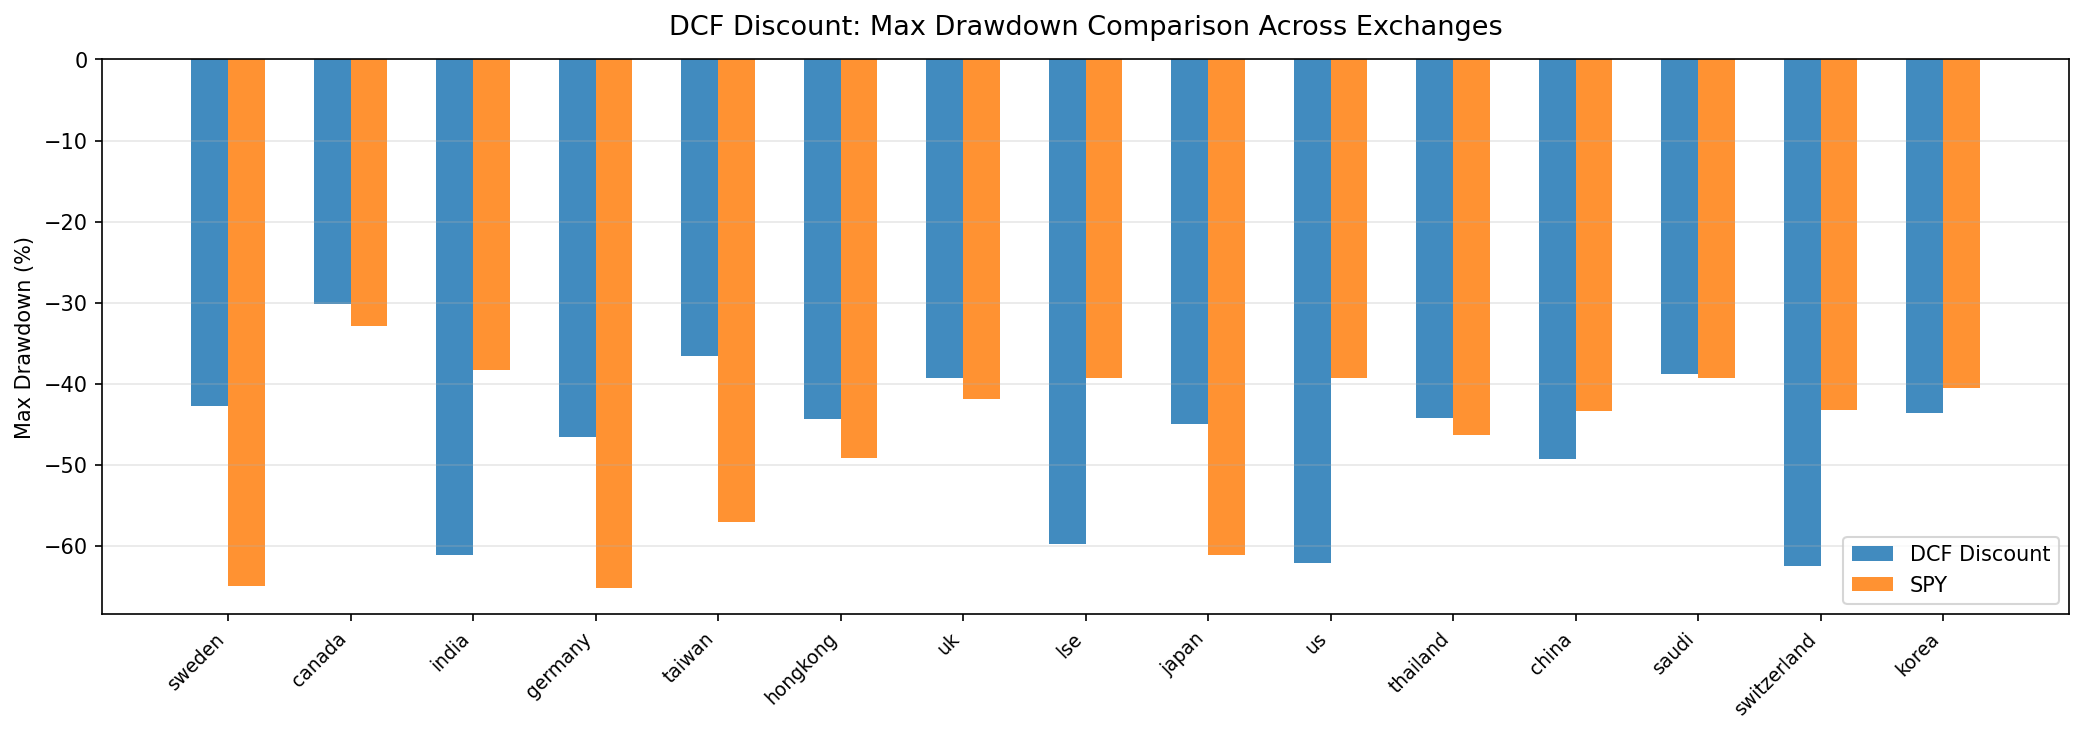
Drawdown vs excess return.
| Exchange | Max DD | Bench Max DD | Excess CAGR |
|---|---|---|---|
| Sweden | -21.27% | (OMXS30) | +12.17% |
| Canada | -33.59% | (TSX Comp) | +7.40% |
| Taiwan | -35.91% | (TAIEX) | +6.19% |
| Switzerland | -37.91% | (SSMI) | +6.67% |
| Saudi | -38.80% | (SPY) | -1.70% |
| Japan | -42.52% | (Nikkei) | +5.28% |
| Germany | -43.69% | (DAX) | +7.89% |
| Thailand | -43.91% | (SET) | +1.41% |
| Korea | -44.79% | (KOSPI) | +1.21% |
| China | -48.38% | (SSE Comp) | +4.01% |
| Hong Kong | -52.03% | (Hang Seng) | +5.50% |
| UK | -55.33% | (FTSE 100) | +5.11% |
| India | -57.94% | (Sensex) | -0.63% |
| US | -59.79% | (SPY) | +0.58% |
The pattern remains clear: the markets with the shallowest drawdowns tend to produce the best excess returns. Sweden, Canada, Taiwan, and Switzerland combine contained risk with meaningful alpha. The US and India sit at the deep-drawdown end with marginal or negative excess returns.
Currency and Benchmark Effects
With local benchmarks, currency is less of a concern for most comparisons. When both the portfolio and benchmark are denominated in the same currency, the excess return is a clean like-for-like measure in local terms. Sweden's +12.17% excess vs OMXS30, Germany's +7.89% vs DAX, Canada's +7.40% vs TSX Composite: all of these are pure equity performance in local currency, no currency noise.
Currency still matters for absolute returns from a USD investor's perspective. Sweden's 14.57% CAGR in SEK shrinks to roughly 13.5% in USD terms. India's 10.86% drops to around 8.5% after INR depreciation. Both adjustments apply equally to the portfolio and its local benchmark, so the excess return doesn't change.
The bigger issue is dividends. Most local indices in our dataset are price-only (^OMXS30, ^N225, ^FTSE, ^GDAXI, ^HSI, ^KS11, ^TWII, ^GSPTSE, ^SSMI, ^SET.BK, ^BSESN, 000001.SS). They don't include reinvested dividends. The strategy returns are total return (adjusted close, dividends rolled in). Approximate dividend yield by market: India ~1.5%, Japan ~1.5%, Korea ~2%, Canada ~2.5%, Switzerland ~2.5%, Germany ~2.5%, China ~2%, Brazil ~3%, Hong Kong ~3%, Sweden ~3-3.5%, Taiwan ~3%, UK ~3.5%, Thailand ~3%.
After dividend adjustment, headline excess returns shrink by roughly each market's typical yield. The directional findings don't change (Sweden still leads, India still lags, US still flat), but the numbers narrow. Only SPY in our dataset is a genuine total-return benchmark.
Two exchanges (Saudi, US) still use SPY as benchmark. For these, the comparison is total-return vs total-return.
Unhedged emerging market equity exposure carries embedded currency risk. The backtest doesn't account for hedging costs, which would reduce absolute returns further.
Where It Doesn't Work
A handful of markets produced negative, near-zero, or marginal excess returns vs their benchmarks:
India: -0.63% vs Sensex. The Sensex returned 11.49% over the period, the strongest local benchmark in our test. The DCF strategy's 10.86% CAGR can't quite keep up. After dividend adjustment the gap widens. India's max drawdown of -57.94% is meaningfully deeper than the Sensex's -38.31%. The strategy is worse on both return and risk.
Saudi (SAU): -1.70% vs SPY. Twenty-eight percent cash periods signal thin coverage. The Saudi market is still relatively young by global standards. FMP data goes deep on Aramco and a few banks, but the mid-cap universe is small. With 24.8 average stocks qualifying (versus 50 target), the portfolio was underinvested in most periods.
Effectively flat: Korea (+1.21%) and Thailand (+1.41%). KOSPI returned 4.44% over 25 years; the strategy returned 5.65%. SET returned 4.41%; the strategy returned 5.82%. Both edges are inside the dividend gap of their respective benchmarks, so true alpha is negligible to slightly negative.
US (+0.58%): small positive. The US version essentially matches SPY in absolute terms while delivering a worse Sharpe (0.196 vs 0.251) and a much deeper drawdown (-59.79% vs -39.33%). The "edge" is in the noise.
Patterns
Universe contamination matters more than expected. UK and Hong Kong looked like outsized winners in the prior run (8.70% and 9.19%). Once US ADRs and other foreign-currency filings were filtered out, both dropped meaningfully (6.26% and 6.77%). Switzerland, Germany, and Sweden moved the other way, gaining several points of CAGR once the local universe was cleaned of cross-listed names. Universe construction is a first-order driver of regional results.
Local benchmarks change the framing too. Against SPY, India previously showed positive excess. Against the Sensex, it now lags. Australia and Brazil look like winners against SPY but the underlying returns turn out to be data artifacts. Switzerland, Thailand, and Sweden flipped between negative and positive vs SPY versus their local benchmarks.
Weak local benchmarks inflate the signal's edge. Hong Kong (+5.50% vs Hang Seng at 1.28% CAGR), UK (+5.11% vs FTSE 100 at 1.15%), and Japan (+5.28% vs Nikkei at 2.20%) all show meaningful excess returns. Their benchmarks were unusually weak over this 25-year period. The strategy beat sluggish indices, partly because those indices are price-only and partly because the markets themselves underperformed.
Strong local benchmarks expose the signal's limits. India (Sensex 11.49% CAGR) and the US (SPY 7.33%) have the strongest benchmarks. Against them, excess returns are negative and small-positive respectively. When the index itself is strong, the DCF screen struggles to outperform.
Shallow drawdown markets produce the best excess returns. Sweden (-21.27% max DD, +12.17% excess), Canada (-33.59%, +7.40%), Taiwan (-35.91%, +6.19%), and Switzerland (-37.91%, +6.67%) combine the shallowest drawdowns with meaningful excess returns. India (-57.94%) and the US (-59.79%) sit at the opposite end with marginal or negative excess. The strategy works best in markets where cheap-on-FCF stocks actually have less downside.
Zero-cash markets aren't necessarily better. Canada, China, and the US all had qualifying stocks in every period (0% cash). Full investability didn't translate to better returns. Meanwhile, Saudi (28% cash) and Korea (24% cash) had the highest cash rates and the weakest results, but Sweden (20% cash) sits at the top of the table. Cash periods are a coverage signal, not an outcome signal.
Data Gaps
Three exchanges were excluded from this analysis:
| Exchange | Reason |
|---|---|
| ASX (Australia) | FMP adjClose has broken split-adjustment for 314+ stocks; produces 1,000x+ price ratios. Fatal data quality. |
| SAO (Brazil) | Same root cause as ASX. 20+ stocks with 1,000x+ ratios in 2007 alone, producing fictitious 3,000%+ single-year returns. Fatal. |
| SGX (Singapore) | Profile table has 0 SGX symbols. Exchange code may be ingested differently. Pipeline fix required. |
Limitations
Mixed benchmark sources and treatments. Twelve exchanges use local price-only indices. Two (Saudi, US) use SPY (US is total-return; Saudi falls back because no local index in our data). The cross-exchange comparison is approximate, not exact.
Price-only benchmarks systematically inflate excess. Local indices in this dataset don't include dividends. Headline excess overstates the true gap by each market's dividend yield. Directional findings hold; magnitudes are softer than the headline numbers.
Model sensitivity. The Gordon Growth Model uses fixed assumptions (g=2.5%, r=10%). Change the discount rate to 12% and the FCF yield threshold drops from 8.78% to 10.53%. Change it to 8% and the threshold falls to 5.71%. Every exchange's portfolio composition would shift, and the ranking could change.
Trailing FCF. The screen uses reported free cash flow, which is backward-looking. Cyclical companies at peak FCF can screen as cheap when they're actually expensive on a forward basis. This effect is stronger in resource-heavy markets (Canada, Australia if it were included) and weaker in stable-growth markets (Switzerland, Taiwan).
25-year period bias. The 2000-2024 window includes two deep recessions and two extended growth cycles. The early-2000s value premium was unusually strong globally. A strategy tested from 2010-2025 would show weaker results in most markets due to the growth/momentum regime that dominated.
Survivorship bias. The backtest includes delisted companies, but data completeness varies by exchange. Smaller exchanges with fewer listed companies may have better survivorship in the dataset than larger ones.
Takeaway
The DCF discount signal beats local benchmarks in 12 of 14 markets tested, with the magnitude varying from +12.17% headline excess (Sweden vs OMXS30) to -1.70% (Saudi vs SPY). After adjusting for the missing dividends in price-only benchmarks, the leading excesses shrink by roughly 1.5-3.5 percentage points per market, but the directional pattern holds.
The biggest finding from this revision is universe hygiene. The prior run mixed foreign-listed parent filings into local exchange universes (Lam Research's XETRA listing reporting USD against EUR mktcap, US ADRs in the LSE book, etc.). Filtering on reportedCurrency and isFund/isEtf/isActivelyTrading meaningfully reshaped the rankings: UK and Hong Kong dropped about 2.4 percentage points each, Switzerland gained 3.2, Germany gained 3.1, Sweden gained 2.9. The directional story (Sweden best, India lagging Sensex, US flat) survives, but the magnitudes shifted.
The best opportunities sit in markets with shallow drawdowns and reasonable local benchmarks: Sweden, Germany, Canada, Taiwan, and Switzerland. All five combine real returns with manageable downside. Sweden in particular pairs the highest CAGR (14.57%) with the shallowest drawdown (-21.27%) in the dataset.
The markets to avoid: India, where the strategy lags the Sensex on both return and risk after honest accounting. Saudi Arabia, where the universe is too thin to maintain a full portfolio. The US is borderline: a small positive excess that disappears once you account for the deeper drawdown and lower Sharpe.
One signal across 14 exchanges produces a 9-point range in annual returns. The exchange you apply it to, the universe construction (currency match, ETF/fund filters), the benchmark you measure it against, and the dividend treatment of that benchmark are the four biggest variables in the equation.
Read the Full Analysis
We wrote dedicated posts for seven exchanges. Each one goes deeper into year-by-year returns, sector composition, and market-specific context:
- DCF Discount: US Stocks (NYSE + NASDAQ + AMEX): the flagship post with full methodology
- DCF Discount: Indian Stocks (NSE): lags Sensex, deep drawdown
- DCF Discount: Taiwanese Stocks (TAI + TWO): high Sharpe with contained drawdown
- DCF Discount: Canadian Stocks (TSX): consistent local edge, shallow drawdown
- DCF Discount: Korean Stocks (KSC): the Korea discount meets DCF discount
- DCF Discount: German Stocks (XETRA): industrial value on Europe's largest exchange
- DCF Discount: Swedish Stocks (STO): top of every list (CAGR, Sharpe, drawdown)
UK (LSE), Japan (JPX), Hong Kong (HKSE), China (SHH+SHZ), Switzerland (SIX), Thailand (SET), and Saudi (SAU) results are included in the table above but don't have dedicated posts yet.
Data: Ceta Research, FMP financial data warehouse. Backtest: 2000-2025, 25 annual periods, Gordon Growth Model (g=2.5%, r=10%, multiple=13.67x). 14 exchanges (Australia, Brazil, Singapore excluded). Per-exchange local currency market cap thresholds (~$200-545M USD equivalent), positive FCF. Returns in local currency; benchmarks: local price indices where available, SPY otherwise. Most local benchmarks are price-only (excludes dividends). Next-day close (MOC) execution. Size-tiered transaction costs applied. Full methodology: METHODOLOGY.md. Not investment advice.


