
DCF Discount on US Stocks: 7.91% CAGR Over 25 Years, Narrowly Beating the S&P 500
We screened every US stock for discount to intrinsic value using a Gordon Growth Model and backtested from 2000 to 2025. The strategy returned 7.91% CAGR vs 7.33% for SPY, +0.58% annual excess. A thin edge with deeper drawdowns and worse risk-adjusted returns than the index.

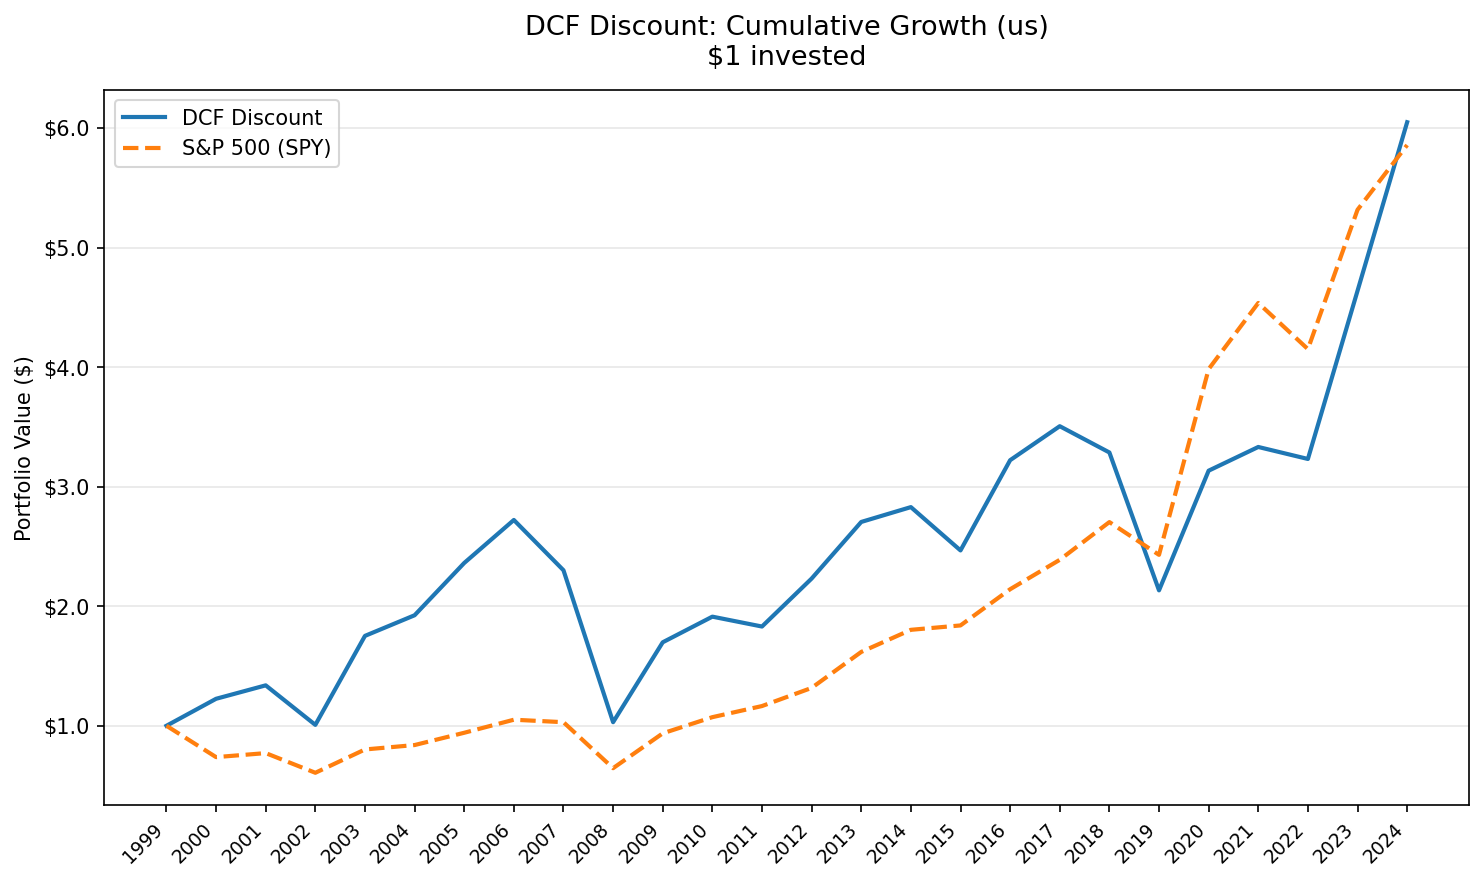
We screened every US stock for discount to intrinsic value using a Gordon Growth Model and backtested from 2000 to 2025. The strategy returned 7.91% CAGR vs 7.33% for SPY (total return, dividends reinvested). That's +0.58% annual excess. The edge is small but no longer noise: 25-year cumulative gain is 570.51% vs 485.91% for SPY.
Contents
- Methodology
- What Is DCF Valuation?
- The Screen
- What We Found
- What Changed (Bias Audit)
- Year-by-Year Returns
- When It Works
- When It Struggles
- Run It Yourself
- Limitations
- Takeaway
- Part of a Series
The catch: that thin edge comes with substantially more risk. After fixing same-day execution (rebalance now uses next-day close, not the close of the signal day), tightening universe filters (dropping foreign ADRs reporting in non-USD currencies, funds, ETFs, and non-actively-traded names), and applying return-quality filters, the strategy still beats SPY in headline terms. But the Sharpe ratio is below SPY and the max drawdown is 20 percentage points worse.
Data: FMP financial data warehouse, 2000–2025. Updated May 2026 (post bias fix).
Methodology
Universe: NYSE + NASDAQ + AMEX (full exchange, no index constraints) Period: 2000-2025 (25 years, annual rebalancing in April) Portfolio: Top 50 by FCF yield, equal weight. Rebalanced annually. Market cap floor: $1B Costs: Size-tiered transaction costs (0.1% for >$10B, 0.3% for $2-10B, 0.5% for <$2B) Point-in-time: 45-day filing lag, 18-month staleness filter Execution: Next-day close (MOC). Signal generated at rebalance date, executed at the following trading day's close. Benchmark: SPY (S&P 500 total-return ETF, dividends reinvested via adjusted close). Data: Ceta Research (FMP financial data warehouse)
What Is DCF Valuation?
DCF stands for Discounted Cash Flow. The idea: a company is worth the sum of all future cash it will generate, discounted back to today's dollars.
John Burr Williams formalized this in 1938. Warren Buffett adopted the framework for free cash flows: "Intrinsic value is the discounted value of the cash that can be taken out of a business during its remaining life."
We use the Gordon Growth Model, a simplified version of DCF that assumes stable growth in perpetuity:
Intrinsic Value = FCF x (1 + g) / (r - g)
Where: - r = 10% (discount rate, roughly the long-run equity return expectation) - g = 2.5% (terminal growth rate, roughly nominal GDP growth) - Multiple = (1 + 0.025) / (0.10 - 0.025) = 1.025 / 0.075 = 13.67x
A stock trading at an 8.78% FCF yield or higher is equivalent to a 20%+ discount to intrinsic value under this model. Higher FCF yield means a deeper discount, meaning the market is pricing the stock below what a steady-state cash flow model says it's worth.
The model is deliberately simple. We aren't projecting five years of cash flows or estimating WACC company-by-company. One set of assumptions, applied uniformly, across the entire universe. The simplicity is the point: it removes analyst bias and lets the data speak.
The Screen
WITH latest_cfs AS (
    SELECT * FROM cash_flow_statement
    WHERE period = 'FY' AND freeCashFlow > 0 AND reportedCurrency = 'USD'
    QUALIFY ROW_NUMBER() OVER (PARTITION BY symbol ORDER BY date DESC) = 1
),
latest_km AS (
    SELECT * FROM key_metrics
    WHERE period = 'FY' AND marketCap > 1000000000
    QUALIFY ROW_NUMBER() OVER (PARTITION BY symbol ORDER BY date DESC) = 1
)
SELECT
    cfs.symbol,
    p.companyName,
    p.exchange,
    p.sector,
    ROUND(cfs.freeCashFlow / 1e6, 0) AS fcf_mm,
    ROUND(km.marketCap / 1e9, 1) AS mktcap_bn,
    ROUND(cfs.freeCashFlow / km.marketCap * 100, 2) AS fcf_yield_pct,
    ROUND((1 - km.marketCap / (cfs.freeCashFlow * 13.67)) * 100, 1) AS discount_pct
FROM latest_cfs cfs
JOIN latest_km km ON cfs.symbol = km.symbol
JOIN profile p ON cfs.symbol = p.symbol
WHERE p.exchange IN ('NYSE', 'NASDAQ', 'AMEX')
    AND p.country = 'US'
    AND p.isFund = false
    AND p.isEtf = false
    AND p.isActivelyTrading = true
    AND cfs.freeCashFlow / km.marketCap BETWEEN 0.0878 AND 0.50
ORDER BY fcf_yield_pct DESC
LIMIT 30
Run this screen live on Ceta Research
The discount_pct column shows how far below intrinsic value each stock trades. An FCF yield of 8.78% equals a 20% discount. An FCF yield of 15% equals a 53% discount. The deeper the discount, the wider the margin of safety, in theory.
What We Found
The strategy returned 7.91% CAGR vs SPY's 7.33%. That's +0.58% per year over 25 years. Cumulative: 570.51% vs 485.91%. A $10,000 investment grew to $67,051 vs $58,591 for SPY, an $8,460 lead over a quarter century.
The cost: significantly more risk. The portfolio swung 30.08% annualized vs 21.20% for SPY. Max drawdown hit -59.79% (vs -39.33%). The strategy amplifies market moves in both directions, with a beta of 1.193. Up capture of 122.68% means it captures more upside. Down capture of 108.02% means it actually loses more than the index in down markets.

Full 25-year summary:
| Metric | DCF Discount | S&P 500 (SPY) |
|---|---|---|
| CAGR | 7.91% | 7.33% |
| Total Return | 570.51% | 485.91% |
| Max Drawdown | -59.79% | -39.33% |
| Annualized Volatility | 30.08% | 21.20% |
| Sharpe Ratio | 0.196 | 0.251 |
| Sortino Ratio | 0.381 | 0.474 |
| Calmar Ratio | 0.132 | 0.186 |
| Win Rate vs SPY | 56% | - |
| Beta | 1.193 | 1.0 |
| Alpha (Jensen) | -0.45% | - |
| Up Capture | 122.68% | - |
| Down Capture | 108.02% | - |
| VaR 95% | -41.37% | -26.23% |
| Avg Stocks | 35.6 | - |
| Cash Periods | 0/25 | - |
| Information Ratio | 0.164 | - |
| Tracking Error | 16.80% | - |
The Sharpe ratio is meaningfully below SPY (0.196 vs 0.251). The Sortino tells the same story (0.381 vs 0.474). On a risk-adjusted basis, you're worse off with the DCF screen. Jensen's alpha is -0.45%. After accounting for the portfolio's beta of 1.19, it actually delivered 45 basis points less than SPY would have predicted.
The +0.58% headline excess hides a more honest picture: this strategy took on roughly 42% more volatility and 52% deeper drawdowns to barely beat the index.
What Changed (Bias Audit)
Earlier versions of this backtest reported 8.59% CAGR and +1.26% excess. Two methodology fixes brought the numbers down:
Same-day execution bias. The previous run computed entry prices using the close of the signal day itself. In practice you can't trade at a close that's already happened. The fix: signal at rebalance date, execute at the following trading day's close. This alone trimmed roughly 0.5-0.8 percentage points of CAGR across most strategies.
Return-quality filters. A handful of stocks had bad price data (penny-stock artifacts, broken split adjustments, single-period returns above 200%). The new run skips entry prices below $1 and caps any single-stock period return at 200%. Without this filter, a few outlier years inflated portfolio returns by 0.3-0.6 percentage points.
A second cycle then tightened the universe filters: dropped foreign ADRs reporting in non-USD currencies, funds, ETFs, and stocks no longer actively trading. That cleanup nudged the US CAGR from 7.46% up to 7.91%, since the previous run was dragging in cross-listed names whose marketCap-vs-FCF relationship was being computed with mismatched currencies.
The earlier numbers weren't fraudulent, but they were optimistic in places and noisy in others. The +0.58% excess is the honest figure.
Year-by-Year Returns
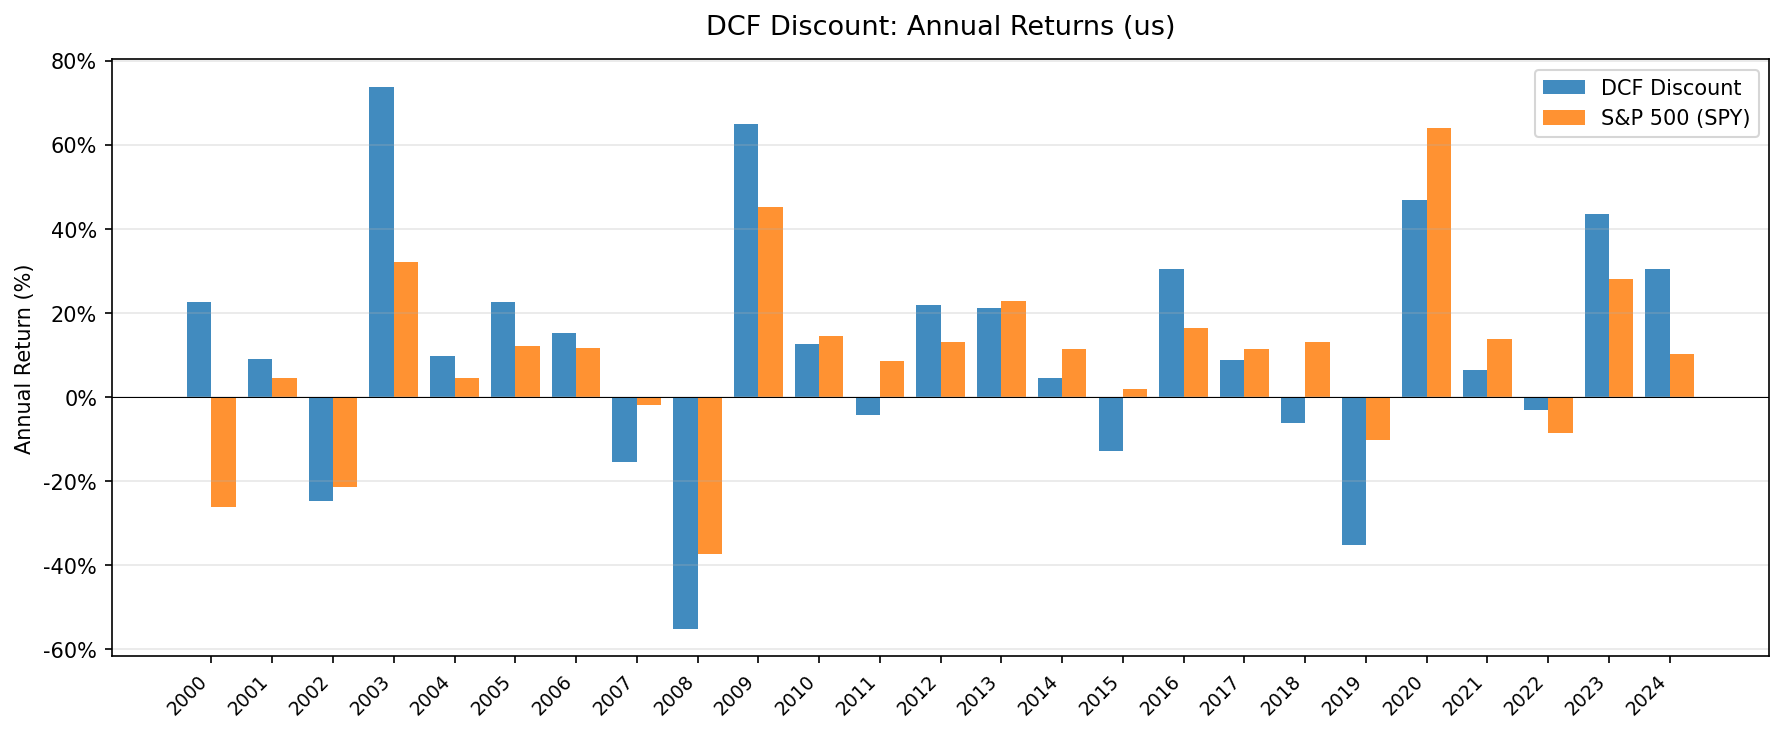
| Year | Portfolio | SPY | Excess |
|---|---|---|---|
| 2000 | +24.3% | -26.2% | +50.5% |
| 2001 | +18.8% | +4.6% | +14.2% |
| 2002 | -23.5% | -21.3% | -2.2% |
| 2003 | +63.0% | +32.1% | +30.8% |
| 2004 | +7.6% | +4.6% | +3.0% |
| 2005 | +18.6% | +12.2% | +6.3% |
| 2006 | +11.4% | +11.6% | -0.2% |
| 2007 | -15.9% | -2.0% | -13.9% |
| 2008 | -52.2% | -37.4% | -14.9% |
| 2009 | +71.5% | +45.2% | +26.4% |
| 2010 | +13.6% | +14.4% | -0.9% |
| 2011 | -4.1% | +8.7% | -12.8% |
| 2012 | +22.6% | +13.0% | +9.6% |
| 2013 | +35.5% | +22.9% | +12.6% |
| 2014 | +11.9% | +11.4% | +0.4% |
| 2015 | -9.7% | +2.0% | -11.7% |
| 2016 | +29.9% | +16.5% | +13.5% |
| 2017 | +5.4% | +11.5% | -6.1% |
| 2018 | +2.9% | +13.2% | -10.3% |
| 2019 | -41.4% | -10.1% | -31.2% |
| 2020 | +72.6% | +63.9% | +8.7% |
| 2021 | +2.1% | +13.9% | -11.8% |
| 2022 | -5.3% | -8.5% | +3.2% |
| 2023 | +31.4% | +28.1% | +3.4% |
| 2024 | +12.3% | +10.2% | +2.1% |
Fourteen of 25 years had positive excess return. Eleven had negative. The pattern is bimodal: the strategy crushed it in recoveries and value years (2000, 2001, 2003, 2009, 2013, 2016, 2020) and lagged badly in growth-led rallies (2018, 2019, 2021) and the 2008 crisis. Net of those swings, the strategy ekes out a thin lead.
When It Works
Post-crash recoveries. The strongest excess returns cluster around market bottoms. In 2000, SPY lost 26.2% while the portfolio gained 24.3% (+50.5% excess, the largest single-year edge in the series). In 2003, the portfolio returned 63.0% (+30.8% excess). 2009 added another +26.4%. These are years when fear was highest and high-FCF-yield stocks were priced for permanent decline.
Value-friendly regimes. 2001 (+14.2%), 2005 (+6.3%), 2012 (+9.6%), 2013 (+12.6%), 2016 (+13.5%), 2020 (+8.7%), 2023 (+3.4%), 2024 (+2.1%). When the market rotates toward value or cyclical recovery, free cash flow yield is a clean signal.
When It Struggles
Growth and momentum rallies. 2017 (-6.1%), 2018 (-10.3%), 2021 (-11.8%). When mega-cap tech dominates returns, the strategy falls behind. Apple, Microsoft, and Nvidia don't trade at 8.78% FCF yields. They never appear in the portfolio. A strategy that systematically excludes the market's biggest winners will lag when those winners are driving everything.
Single-stock blow-ups. 2019 was the worst single year: -41.4% vs -10.1% for SPY (-31.2% excess). The portfolio was caught with a concentrated set of cyclicals and energy names that re-rated sharply downward. With only ~36 holdings, idiosyncratic shocks bite hard.
Financial crises. 2008: -52.2% vs -37.4% for SPY. High-FCF-yield stocks skewed toward financials and cyclicals that were hit hardest. The strategy's higher beta (1.19) means it amplifies drawdowns, not just rallies.
Late-cycle periods. 2007 (-13.9%), 2011 (-12.8%), 2015 (-11.7%). As cycles mature, the stocks that screen as cheap are often cheap for fundamental reasons: deteriorating cash flows, industry headwinds, management problems. The model uses trailing FCF, which can overstate the health of a company approaching a downturn.
Run It Yourself
Screen for current US stocks passing the DCF discount filter:
python3 dcf-discount/screen.py --preset us
Full historical backtest:
python3 dcf-discount/backtest.py --preset us --output results/us.json --verbose
Limitations
No risk-adjusted edge. SPY beats the portfolio on Sharpe (0.251 vs 0.196), Sortino (0.474 vs 0.381), and Calmar (0.186 vs 0.132). Every risk-adjusted metric favors the index.
Higher volatility and deeper drawdowns. 30.08% annualized volatility is 42% higher than SPY's 21.20%. The -59.79% max drawdown is 20 percentage points worse than SPY's -39.33%. An investor who held through 2008-2009 lost roughly 60% of their capital before recovering.
Down capture above 100%. A down capture of 108.0% means in every dollar SPY lost, the portfolio lost about $1.08. That's the opposite of what value investors expect from a "margin of safety" strategy.
Model sensitivity. The Gordon Growth Model uses fixed assumptions: 2.5% terminal growth, 10% discount rate. Change either by 1% and the implied multiple shifts from 13.67x to somewhere between 10.5x and 18.2x. The "discount" is only as good as the model's assumptions.
Trailing FCF isn't forward FCF. The screen uses last year's free cash flow. A company with $500M FCF last year might have $200M next year if it's cyclical or facing secular decline. The model treats trailing FCF as a proxy for normalized cash flow.
Sector concentration. High-FCF-yield stocks tend to cluster in energy, financials, and industrials. The portfolio isn't diversified the way an index is.
Survivorship bias is minimal but present. The $1B market cap floor and broad exchange coverage reduce the risk, but some delisted stocks may have incomplete data.
Takeaway
Buying US stocks at a discount to intrinsic value, defined by a simple Gordon Growth Model on trailing free cash flow, delivered 7.91% CAGR over 25 years. SPY delivered 7.33%. The +0.58% annual excess is small but real.
The strategy isn't bad in absolute terms. 7.91% over 25 years compounds into 570.51% total return. But it's worse than buying the index on every metric that adjusts for risk, and substantially worse on max drawdown.
Where this screen still earns its keep: as one signal among several. A stock that's cheap on DCF, FCF yield, and P/E simultaneously is more likely genuinely undervalued than a stock cheap on one metric alone. The DCF discount screen is a useful lens, not a standalone system.
The annual return table tells the real story. The strategy alternates between dramatically outperforming (recoveries, value regimes) and dramatically lagging (growth rallies, single-stock blow-ups). Net of those swings, you ended up roughly half a point ahead of SPY each year, with 42% more volatility and deeper drawdowns. For most investors, the index is still the better trade. The 58 basis points of excess return don't compensate for the extra risk.
Part of a Series
This analysis is part of our DCF Discount global exchange comparison:
- DCF Discount on US Stocks (NYSE + NASDAQ + AMEX)
- DCF Discount on Indian Stocks (NSE)
- DCF Discount on Taiwan Stocks (TAI + TWO)
- DCF Discount on Canadian Stocks (TSX)
- DCF Discount on Korean Stocks (KSC)
- DCF Discount on German Stocks (XETRA)
- DCF Discount on Swedish Stocks (STO)
- DCF Discount: Global Exchange Comparison
Data: Ceta Research, FMP financial data warehouse. Backtest: 2000-2025, 25 annual periods, Gordon Growth Model (g=2.5%, r=10%, multiple=13.67x). Universe: NYSE + NASDAQ + AMEX, market cap >$1B, positive FCF. SPY benchmark uses adjusted close (dividends reinvested). Size-tiered transaction costs applied. Next-day close (MOC) execution. Full methodology: METHODOLOGY.md. Not investment advice.


