
FCF Conversion Quality Across 15 Exchanges: 11 Beat Their Local Benchmark
We ran the same FCF Conversion screen on 15 exchanges from 2000-2025 with MOC execution and local benchmarks. 11 of 15 beat their local index. Top alpha in UK (+7.42% vs FTSE), Switzerland (+6.35% vs SMI), India (+6.13% vs Sensex).

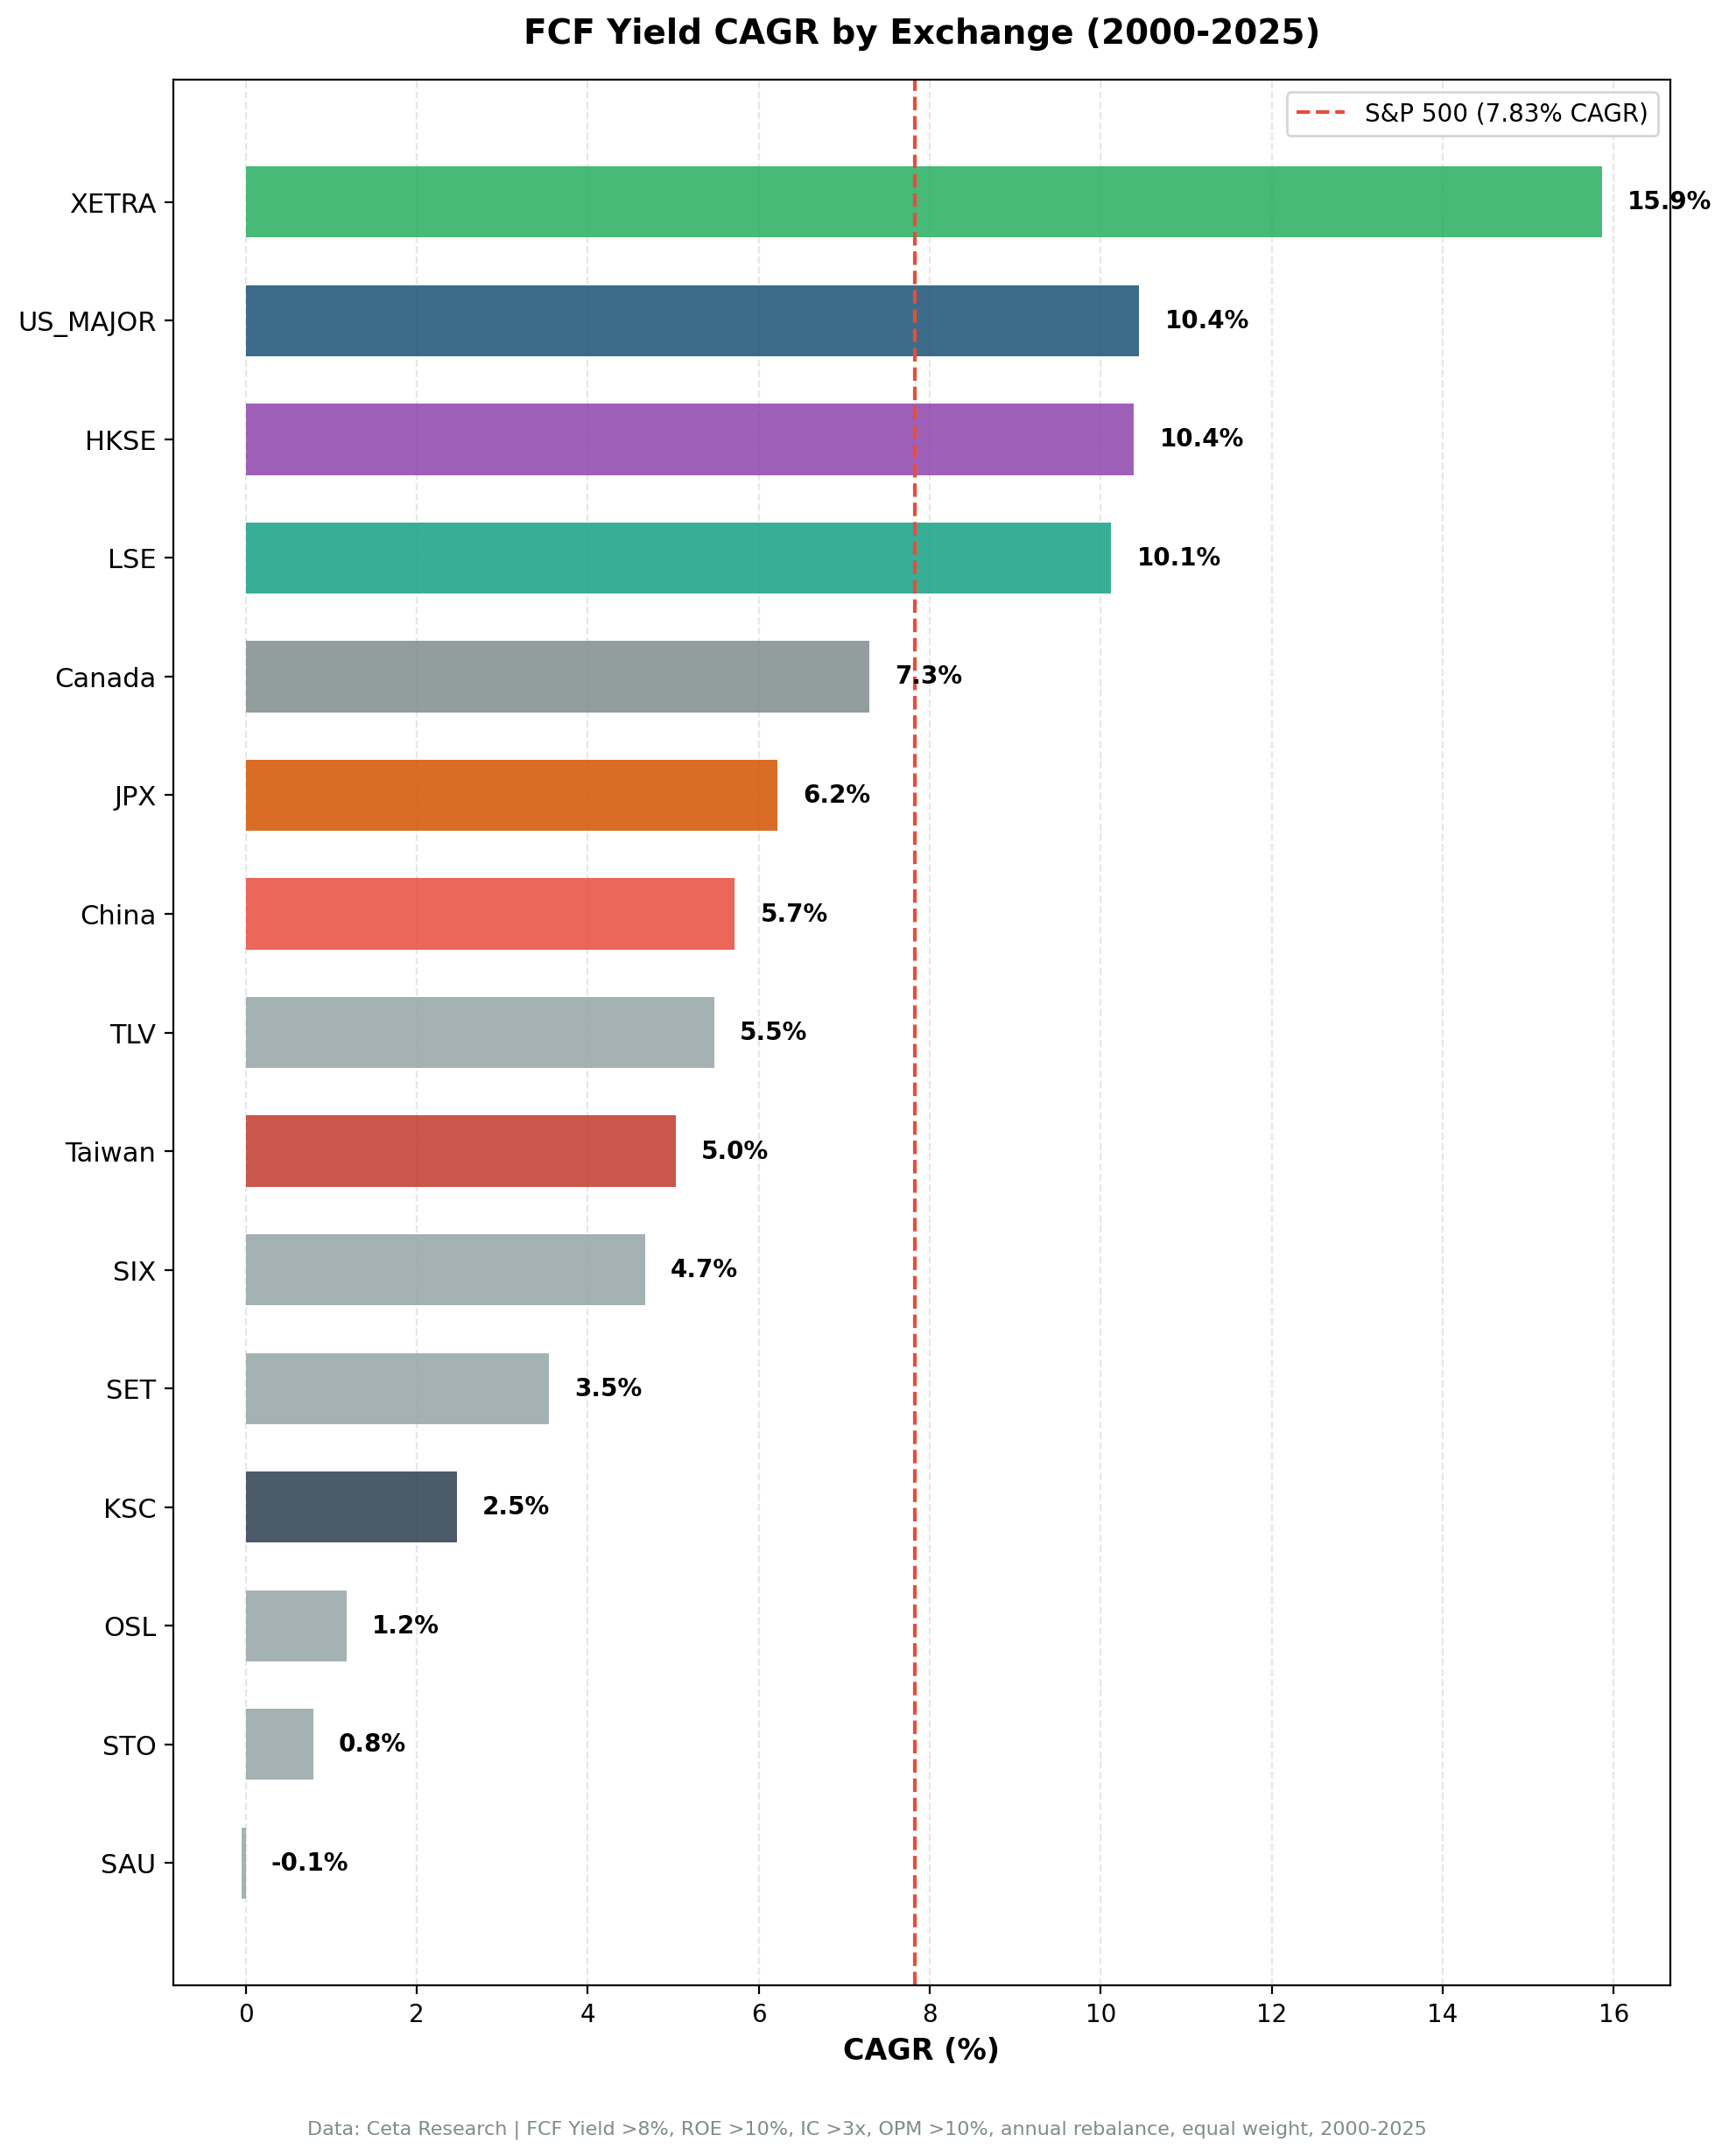
We ran the same FCF Conversion Quality screen on 15 exchanges worldwide, covering 25 years of data from 2000 to 2025. Same filters, same ranking, same rebalancing rules. Each exchange is now benchmarked against its local index, not SPY. The returns varied wildly, from India's 18.18% CAGR to Korea's 0.45%. But one pattern held almost everywhere: 11 of 15 exchanges beat their local benchmark. Companies that convert earnings to real cash tend to outperform in any market.
Contents
- Method
- The Results
- Eleven of fifteen exchanges beat their local benchmark.
- Local Alpha Is the Story
- Drawdown Comparison
- Regional Patterns
- The Strong Outperformers (excess > +3%)
- The Moderate Outperformers (excess +1% to +3%)
- The Underperformers (excess < 0)
- What This Tells Us
- Limitations
- All Regional Posts
Data: FMP financial data warehouse, 2000–2025. Updated March 2026.
Method
Data source: Ceta Research (FMP financial data warehouse) Signal: FCF/NI 100-300%, FCF margin > 10%, ROE > 10%, operating margin > 10% Selection: Top 30 by highest FCF conversion, equal weight Period: 2000-2025 (25 years) Rebalancing: Annual (July) Execution: Mark-on-close (MOC). Signals from prior close, trades execute at current close. Benchmark: Local index per exchange (S&P 500, Sensex, DAX, etc.) Cash rule: Hold cash if fewer than 10 stocks qualify Costs: Size-tiered transaction costs (0.1% large-cap, 0.3% mid-cap, 0.5% small-cap)
Market cap thresholds were set per exchange to target liquid stocks: $1B for the US, ¥100B for Japan, NT$10B for Taiwan, and so on. Full details in each regional post. All returns are in local currency. Each exchange is benchmarked against its own local index. Full methodology: Ceta Research Backtest Methodology.
The Results

Eleven of fifteen exchanges beat their local benchmark.
Each exchange is now measured against its own local index. The old version of this analysis used SPY as the benchmark for every exchange, which mixed currency effects with strategy performance. Local benchmarks give a cleaner picture.
| Exchange | CAGR | Local Benchmark | Bench CAGR | vs Local | Sharpe | Max DD | Cash Yrs | Win Rate |
|---|---|---|---|---|---|---|---|---|
| India (NSE) | 18.18% | Sensex | 12.06% | +6.13% | 0.523 | -15.1% | 4 | 60% |
| US (NYSE+NASDAQ+AMEX) | 9.68% | S&P 500 | 7.85% | +1.83% | 0.385 | -40.9% | 0 | 56% |
| Canada (TSX) | 9.54% | TSX Comp | 3.95% | +5.59% | 0.443 | -24.3% | 2 | 76% |
| Germany (XETRA) | 8.93% | DAX | 5.04% | +3.89% | 0.360 | -43.6% | 0 | 60% |
| UK (LSE) | 8.64% | FTSE 100 | 1.23% | +7.42% | 0.287 | -34.4% | 3 | 84% |
| Switzerland (SIX) | 8.09% | SMI | 1.74% | +6.35% | 0.486 | -46.1% | 2 | 80% |
| Australia (ASX) | 7.01% | ASX 200 | 3.89% | +3.11% | 0.248 | -21.3% | 8 | 60% |
| Hong Kong (HKSE) | 6.00% | Hang Seng | 1.64% | +4.36% | 0.152 | -40.9% | 2 | 68% |
| China (SHZ+SHH) | 5.26% | SSE Comp | 2.43% | +2.83% | 0.077 | -42.2% | 0 | 60% |
| Japan (JPX) | 4.89% | Nikkei | 3.31% | +1.58% | 0.261 | -46.0% | 6 | 52% |
| Sweden (STO) | 4.04% | OMX30 | 2.55% | +1.49% | 0.169 | -19.2% | 15 | 52% |
| Taiwan (TAI) | 3.69% | TAIEX | 4.09% | -0.39% | 0.210 | -22.6% | 7 | 40% |
| Thailand (SET) | 3.30% | SET Index | 5.13% | -1.83% | 0.054 | -39.3% | 6 | 40% |
| Saudi (SAU) | 2.45% | SPY | 7.85% | -5.40% | -0.061 | -33.8% | 8 | 24% |
| Korea (KSC) | 0.45% | KOSPI | 5.35% | -4.90% | -0.250 | -31.3% | 16 | 40% |
The spread between best and worst is massive. India's 18.18% is 40x Korea's 0.45%. But the more meaningful comparison is excess over local benchmarks. Measured that way, 11 of 15 exchanges delivered positive alpha. Only Taiwan (-0.39%), Thailand (-1.83%), Korea (-4.90%), and Saudi Arabia (-5.40%) trailed their local indices.
Local Alpha Is the Story
The switch to local benchmarks changed the picture dramatically. When we benchmarked everything against SPY, only a minority of exchanges showed positive excess return. With local benchmarks, 11 of 15 do. The old framing mixed currency effects with strategy performance. A stock screen beating the Sensex is a more meaningful test than the same screen beating SPY from a different continent.
The top five by local excess:
UK: +7.42% vs FTSE 100. The strongest alpha in the dataset. The FTSE 100 returned just 1.23% CAGR over this period, dragged by financials and energy. The FCF conversion screen avoided those sectors and found consistent cash generators. 84% win rate, the highest of any exchange.
Switzerland: +6.35% vs SMI. The SMI returned 1.74% CAGR. Swiss cash-quality companies (pharmaceuticals, consumer staples) compounded well above the index, with the best Sharpe (0.486) in the dataset. 80% win rate.
India: +6.13% vs Sensex. Still the highest absolute CAGR at 18.18%, with the shallowest drawdown (-15.1%) of any exchange. India's cash-rich exporters and FMCG companies did the heavy lifting.
Canada: +5.59% vs TSX Composite. The TSX Composite returned just 3.95% CAGR. Resource companies with strong cash flows passed the screen and delivered 76% win rate.
Hong Kong: +4.36% vs Hang Seng. The Hang Seng returned a meager 1.64% CAGR. The screen found pockets of genuine cash quality in an otherwise weak market.
Drawdown Comparison
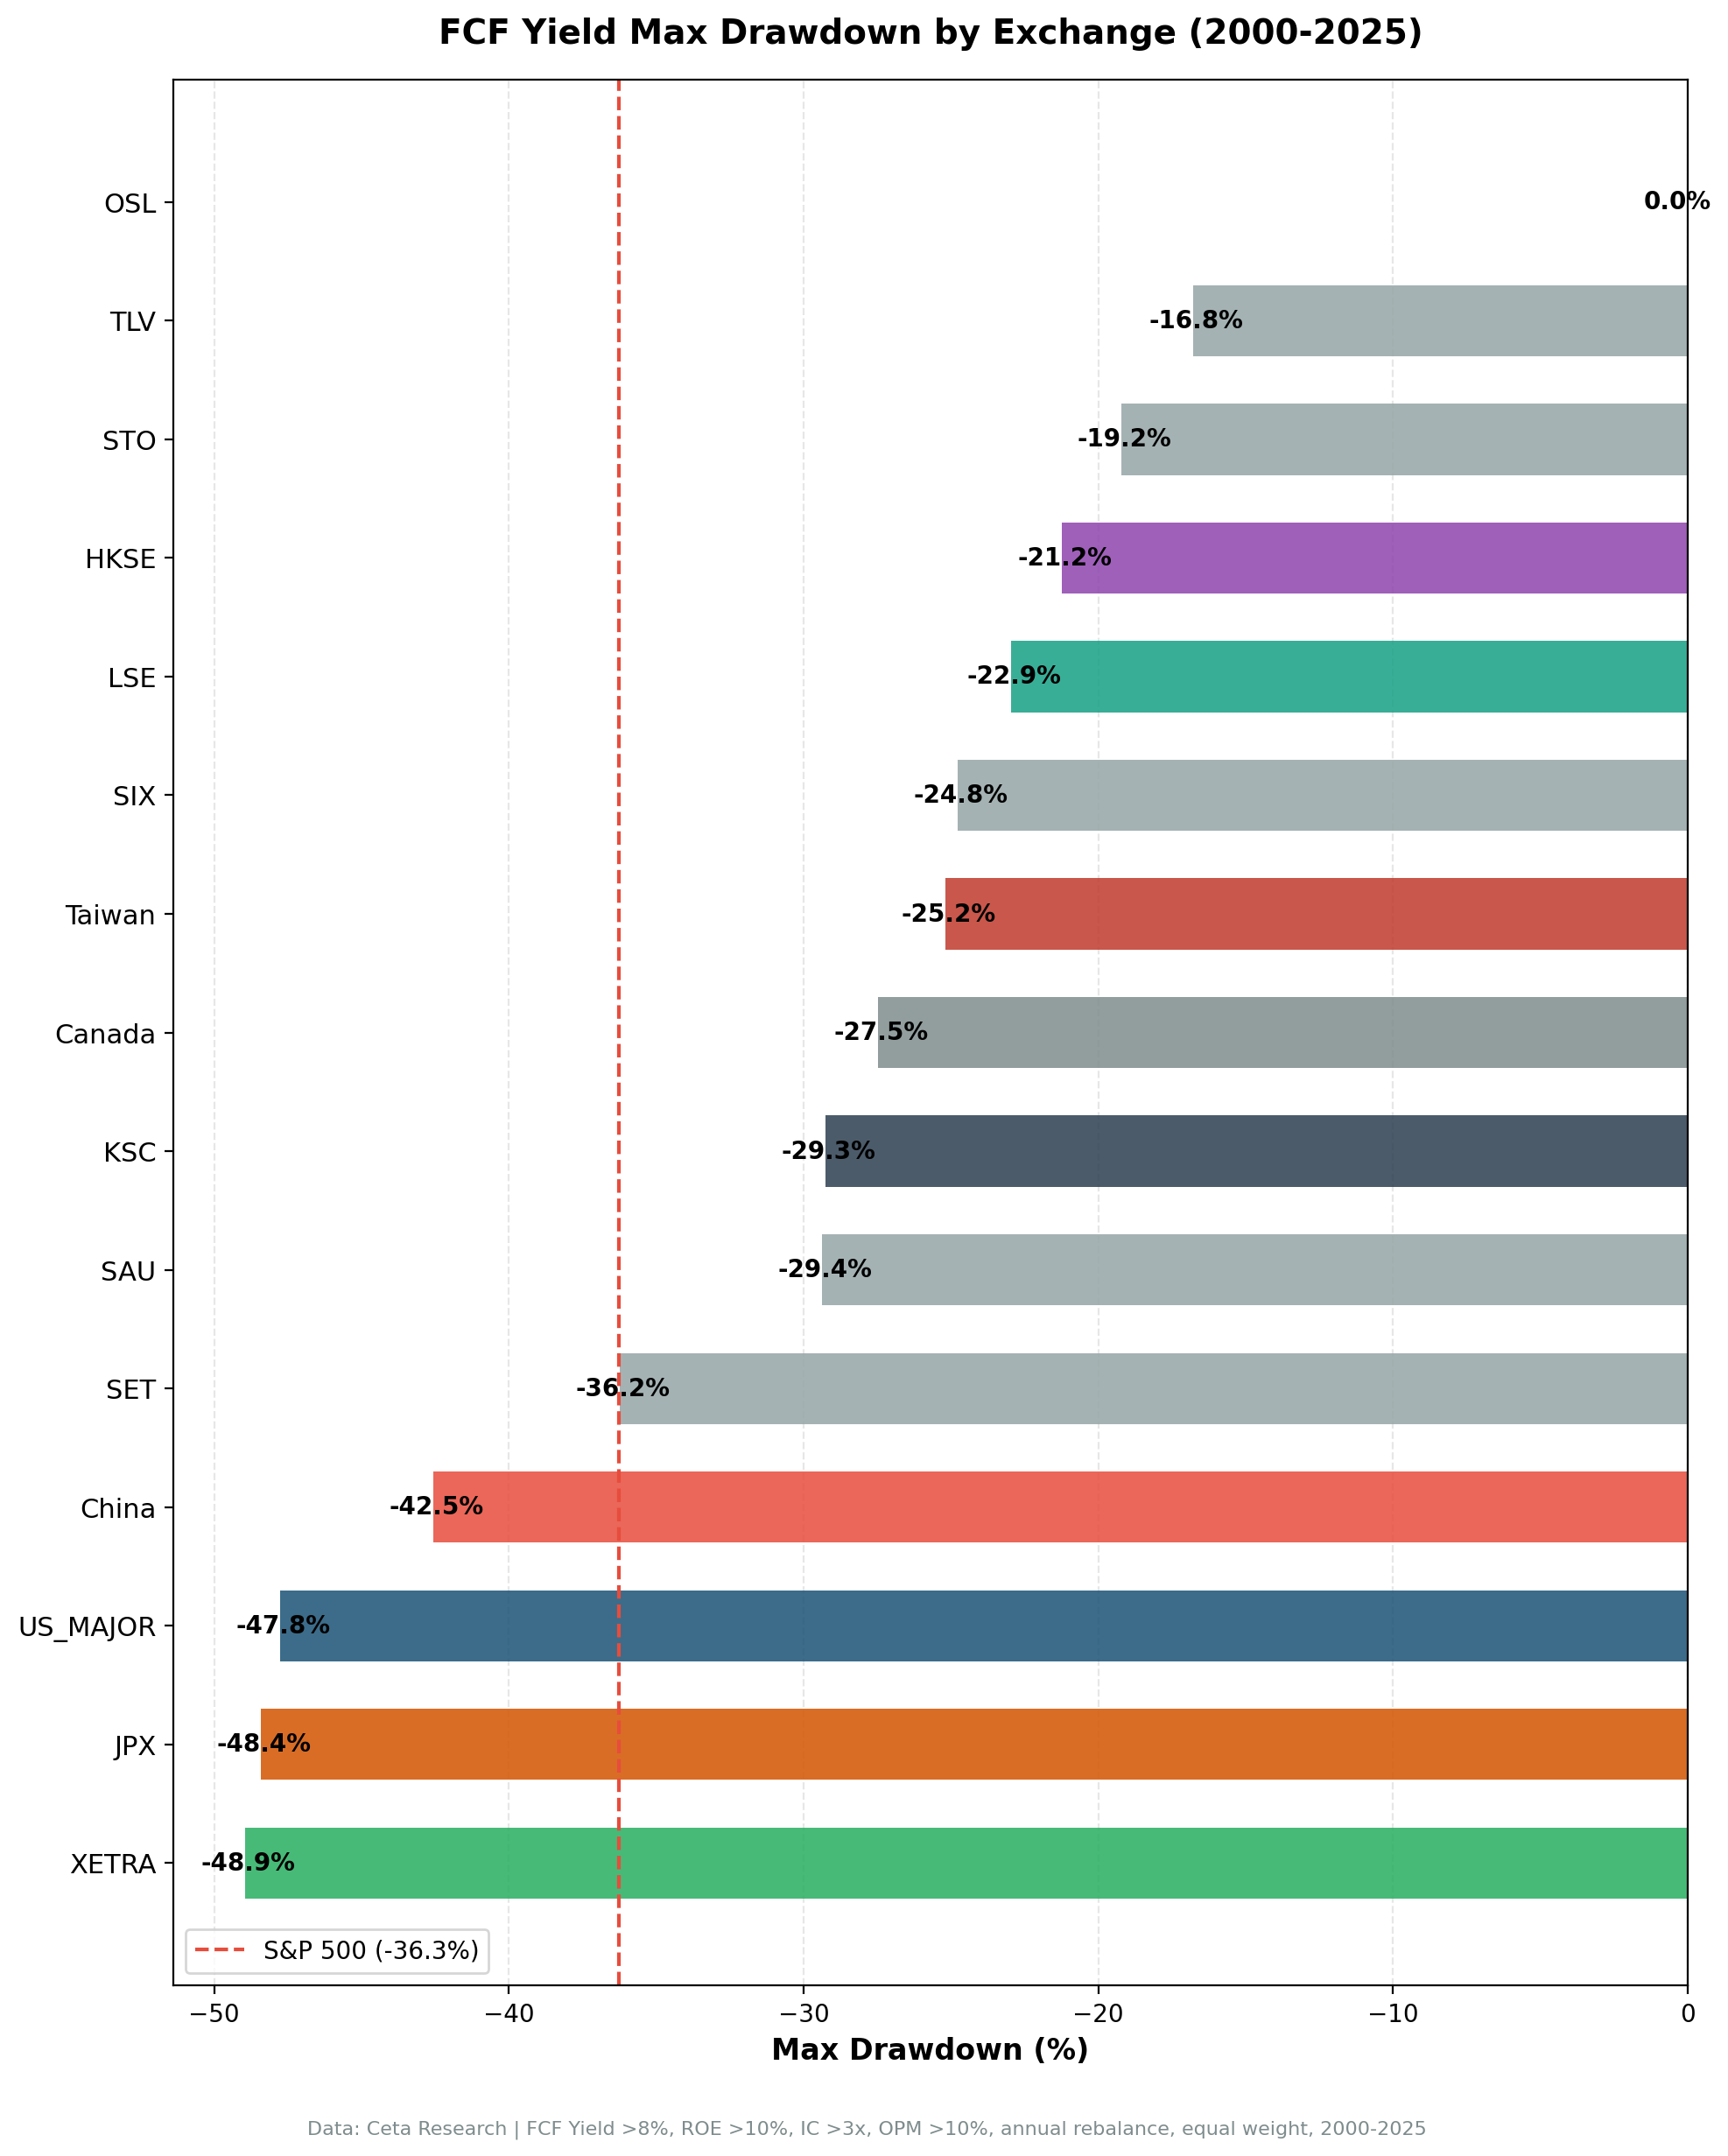
The drawdown chart reveals a clear split. Japan (-46.0%), Switzerland (-46.1%), Germany (-43.6%), and China (-42.2%) experienced the deepest drawdowns. These markets were heavily exposed to the 2008 crisis and, in Japan's case, earlier deflationary shocks.
The markets with the shallowest drawdowns were:
| Exchange | Max Drawdown | Why |
|---|---|---|
| India | -15.1% | Export-driven, domestic demand base, currency hedge |
| Sweden | -19.2% | High cash periods (15 years) effectively protected capital |
| Australia | -21.3% | High cash periods (8 years) kept capital on the sidelines |
| Taiwan | -22.6% | Concentrated tech, low leverage, low beta |
| Canada | -24.3% | Resource-heavy but cash-rich operators |
India's -15.1% max drawdown stands out. That's less than half of the US drawdown (-40.9%) and a third of Japan's (-46.0%). The combination of 18.18% CAGR with -15.1% max drawdown makes India the best risk-adjusted result in the dataset by a wide margin.
Regional Patterns
The Strong Outperformers (excess > +3%)
UK (+7.42% vs FTSE 100) is the surprise leader. The FTSE 100 has been a structurally weak index, returning just 1.23% CAGR over 25 years. Heavy weighting in financials and energy dragged it down. The FCF conversion screen naturally avoided those sectors and found the UK's cash-generating mid-caps. 84% win rate means the strategy beat the FTSE in 21 of 25 years.
Switzerland (+6.35% vs SMI) produced near-identical alpha to India with the best Sharpe in the dataset (0.486). The SMI returned just 1.74% CAGR. Swiss pharmaceuticals and consumer staples dominated the screen's picks.
India (+6.13% vs Sensex) still leads on absolute CAGR at 18.18%, and the -15.1% max drawdown is the shallowest of any exchange. The Sensex returned 12.06% CAGR, so this is genuine alpha over a strong benchmark.
Canada (+5.59% vs TSX Comp) had the second-best Sharpe (0.443) and the highest win rate outside the UK at 76%. The TSX Composite returned just 3.95% CAGR. Resource companies with strong cash flows passed the screen consistently.
Hong Kong (+4.36% vs Hang Seng) flipped from underperformer to outperformer with local benchmarking. The Hang Seng's 1.64% CAGR set a low bar. The screen found genuine cash quality in a weak market.
The Moderate Outperformers (excess +1% to +3%)
Germany (+3.89% vs DAX), Australia (+3.11% vs ASX 200), China (+2.83% vs SSE Comp), US (+1.83% vs S&P 500), Japan (+1.58% vs Nikkei), Sweden (+1.49% vs OMX30) all delivered positive local alpha. The US result is the steadiest: zero cash periods and a 0.385 Sharpe. Germany and Australia also showed consistent performance.
The Underperformers (excess < 0)
Taiwan (-0.39% vs TAIEX) is essentially flat. The TAIEX returned 4.09% CAGR, driven by semiconductor giants that the screen may have missed due to high capex requirements depressing FCF conversion.
Thailand (-1.83% vs SET Index) trailed the SET Index's 5.13% CAGR. High cash periods (6 years) and a narrow qualifying universe held the strategy back.
Korea (-4.90% vs KOSPI) is the second-worst result. 16 cash periods out of 25 years mean the portfolio spent most of its time uninvested. The Korean market's chaebol structure may make FCF conversion less meaningful as a quality signal.
Saudi Arabia (-5.40% vs SPY) had the weakest result, with 8 cash periods, the shortest data history, and only a 24% win rate.
What This Tells Us
The signal works almost everywhere. 11 of 15 exchanges produced positive excess returns over their local benchmarks. That's a much stronger result than the old SPY-benchmarked analysis suggested. The difference isn't the strategy. It's the benchmark. Measuring a Japanese stock screen against SPY mixes currency effects with stock selection. Measuring it against the Nikkei isolates the signal.
The magnitude varies. Markets with weak local indices (UK, Switzerland, Hong Kong) showed the largest excess because the bar was lower. Markets with strong local indices (India's Sensex at 12.06%, Thailand's SET at 5.13%) set a higher hurdle.
The four failures share a pattern. Korea (16 cash periods), Saudi Arabia (8 cash periods), Thailand (6 cash periods), and Taiwan (7 cash periods) all had significant stretches where fewer than 10 stocks qualified. Cash drag is the primary failure mode of this screen in smaller or less developed markets. When the screen can't find enough qualifying stocks, it sits in cash and trails the index.
The practical takeaway: if you're running this screen on an exchange with a deep, liquid equity market (US, UK, Germany, India, Canada), expect consistent local alpha. On smaller exchanges with fewer qualifying companies, cash drag can kill the return.
Limitations
Local benchmarks aren't perfect either. Each exchange uses a single index (S&P 500, Sensex, DAX, etc.). Some of these indices are price-return only, others are total return. The comparison is better than using SPY everywhere, but not fully apples-to-apples across exchanges. One exception: Saudi Arabia is shown against the S&P 500 rather than a local index, because a Tadawul (TASI) total-return series was not available in our dataset, so its excess figure is not a true local-alpha comparison.
Varying data quality. FMP coverage differs by exchange. Early-period data for emerging markets is sparser. The number of cash periods (years when fewer than 10 stocks qualified) is partly a data artifact.
Survivorship bias. Delisted companies aren't fully captured across all exchanges, particularly in early years.
Single signal, multiple contexts. FCF conversion means different things in different markets. In the US, it separates accrual-heavy companies from cash generators. In Japan, it separated disciplined operators from zombie firms. In India, it selected exporters with USD revenue. The signal works, but the mechanism varies.
MOC execution. All trades use mark-on-close execution (signal from prior close, execute at current close). This is more realistic than same-bar execution but still assumes you can trade at the closing price, which may not always be achievable in less liquid markets.
Transaction costs are estimated. Real-world trading costs vary significantly across these exchanges. Smaller markets (Thailand, Saudi) likely have higher actual costs than modeled.
All Regional Posts
We published detailed analysis for each exchange. Each post covers the local context, annual returns, and specific findings:
Strong outperformers (excess > +3% vs local benchmark): - UK (LSE): +7.42% vs FTSE 100, 84% win rate, 8.64% CAGR - Switzerland (SIX): +6.35% vs SMI, best Sharpe at 0.486, 8.09% CAGR - India (NSE): +6.13% vs Sensex, shallowest drawdown, 18.18% CAGR - Canada (TSX): +5.59% vs TSX Comp, 76% win rate, 9.54% CAGR - Hong Kong (HKSE): +4.36% vs Hang Seng, 68% win rate, 6.00% CAGR - Germany (XETRA): +3.89% vs DAX, zero cash periods, 8.93% CAGR
Moderate outperformers (excess +1% to +3%): - China (SHZ+SHH): +2.83% vs SSE Comp, 5.26% CAGR - US (NYSE+NASDAQ+AMEX): +1.83% vs S&P 500, zero cash periods, 9.68% CAGR - Japan (JPX): +1.58% vs Nikkei, governance reforms improved the picture, 4.89% CAGR
Underperformers (excess < 0): - Taiwan (TAI): -0.39% vs TAIEX, essentially flat, 3.69% CAGR - Thailand (SET): -1.83% vs SET Index, cash drag, 3.30% CAGR
Data: Ceta Research (FMP financial data warehouse), 2000-2025. MOC execution. All returns in local currencies, benchmarked against local indices. Full methodology: github.com/ceta-research/backtests/blob/main/METHODOLOGY.md
Past performance does not guarantee future results. This is research content, not investment advice.


