
Low P/E Screen Across 12 Global Exchanges: Where Value Investing Works Best

Low P/E screening has a documented track record in the S&P 500. But does it work everywhere? We ran the same screen on 12 exchanges to find out.
Contents
- Method
- Results
- Finding 1: Data Coverage Is the First Filter
- Finding 2: Low P/E Works Best Outside the S&P 500
- Finding 3: Emerging Markets Show Big Returns, Bigger Drawdowns
- Finding 4: Hong Kong Is the Middle Ground
- Finding 5: UK Value Investing Now Has Data
- Finding 6: NYSE vs NASDAQ
- Limitations
- Takeaway
- Part of a Series
- Run This Screen Yourself
The results aren't what you'd expect. Some exchanges produced enormous returns. Others had zero qualifying stocks. And the data quality story is just as interesting as the performance.
Method
Signal: Same as our S&P 500 backtest: - P/E between 0 and 15 (fiscal year) - ROE > 10% - Debt/Equity < 1.0 - Market cap > local currency equivalent (~$200-500M USD, exchange-specific)
Portfolio: Top 30 by lowest P/E, equal weight, quarterly rebalance Transaction costs: 0.1% per trade (0.2% round-trip per stock per quarter) Period: 2000-2025 (103 quarters) Benchmark: Local index for each exchange (Sensex for India, Hang Seng for Hong Kong, S&P 500 for US, FTSE 100 for UK, Nikkei 225 for Japan, KOSPI for Korea). STO falls back to SPY (no local index in data). Universe: Current exchange membership via company profile data. Not historical membership.
The key difference from our S&P 500 backtest: we screen all stocks listed on a given exchange, not just index constituents. This expands the universe but also changes the data quality dynamics.
-- The screen with exchange filter (example: NYSE)
SELECT
  r.symbol,
  r.priceToEarningsRatio,
  k.returnOnEquity,
  r.debtToEquityRatio,
  k.marketCap,
  p.exchange
FROM financial_ratios r
JOIN key_metrics k ON r.symbol = k.symbol AND r.period = k.period
JOIN profile p ON r.symbol = p.symbol
WHERE r.period = 'FY'
  AND r.priceToEarningsRatio > 0
  AND r.priceToEarningsRatio < 15
  AND k.returnOnEquity > 0.10
  AND r.debtToEquityRatio >= 0
  AND r.debtToEquityRatio < 1.0
  AND k.marketCap > 1000000000
  AND p.exchange = 'NYSE'
ORDER BY r.priceToEarningsRatio ASC
LIMIT 30
Run the global screen on Ceta Research. You can swap the exchange filter to any of the 12 exchanges below.
Results
| Exchange | CAGR | Benchmark | Bench CAGR | Excess | Max DD | Sharpe | Invested | Cash | Avg Stocks |
|---|---|---|---|---|---|---|---|---|---|
| BSE | 16.9% | Sensex | 11.1% | +5.8% | -64.0% | 0.359 | 85/103 | 18 | 26.5 |
| HKSE | 14.4% | Hang Seng | 1.8% | +12.6% | -58.6% | 0.296 | 102/103 | 1 | 26.5 |
| US_MAJOR | 13.9% | S&P 500 | 8.0% | +5.8% | -44.7% | 0.562 | 103/103 | 0 | 23.7 |
| NSE | 13.7% | Sensex | 11.1% | +2.6% | -66.8% | 0.251 | 85/103 | 18 | 27.0 |
| LSE | 13.6% | FTSE 100 | 1.4% | +12.2% | -43.1% | 0.370 | 103/103 | 0 | 17.9 |
| STO | 11.2% | S&P 500 | 8.0% | +3.2% | -51.2% | 0.471 | 87/103 | 16 | varies |
| NYSE | 11.1% | S&P 500 | 8.0% | +3.1% | -51.4% | 0.410 | 103/103 | 0 | 23.9 |
| NASDAQ | 8.9% | S&P 500 | 8.0% | +0.9% | -46.4% | 0.307 | 97/103 | 6 | 22.1 |
| JPX | 5.8% | Nikkei 225 | 3.4% | +2.4% | -61.2% | 0.291 | 82/103 | 21 | varies |
| KSC | 4.9% | KOSPI | 4.8% | +0.1% | -38.6% | 0.127 | 76/103 | 27 | 27.9 |
| AMEX | 0% | - | - | - | - | - | 0/103 | 103 | 0 |
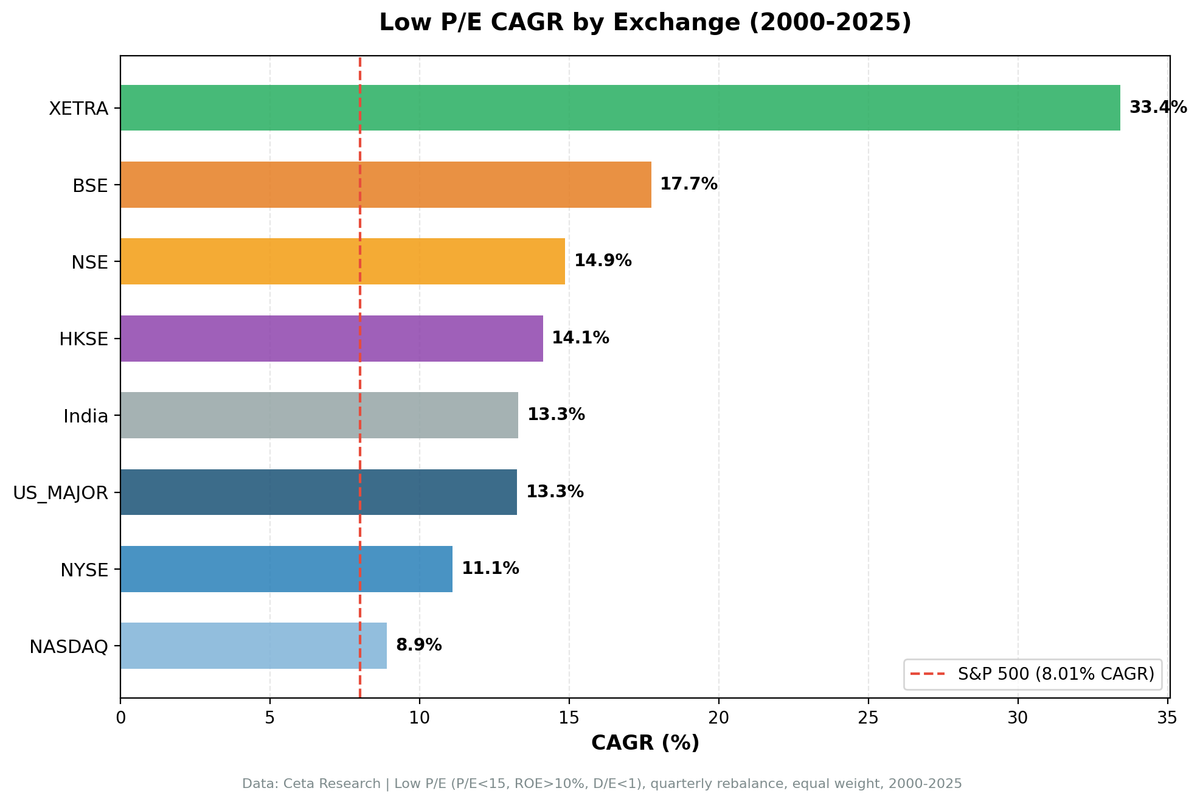
XETRA intentionally excluded due to data quality issues (33.4% CAGR with 280%+ individual years). NYSE and NASDAQ still use SPY as benchmark (not re-run with local index). STO (Stockholm) falls back to SPY as benchmark since no local Swedish index is in our data. AMEX had zero qualifying stocks in every quarter. The pattern holds: financial statement data coverage determines whether a backtest is possible.
Finding 1: Data Coverage Is the First Filter
When we first ran this comparison, three exchanges (LSE, JPX, AMEX) returned zero qualifying stocks. FMP's international coverage has improved since then. LSE now averages 17.9 stocks per quarter, enough for a full portfolio. JPX runs 82 out of 103 invested quarters, though 21 cash quarters (concentrated in the early 2000s) reflect thinner historical coverage.
AMEX still fails completely: 3,725 symbols but only 54 with financial ratio data, and just 6 with both metrics and ratios. Never enough to build a portfolio.
JPX now has enough data to run, but early-period gaps matter. The 21 cash quarters mean the strategy sat idle for roughly five years of the backtest window. Results from 2000-2005 on JPX should be treated with extra skepticism.
This isn't a limitation of the strategy. It's a limitation of the data source. FMP has deep US financial data. International coverage is uneven and improving, but if you're running screens on international exchanges, check data coverage first.
Finding 2: Low P/E Works Best Outside the S&P 500
The combined US universe (NYSE + NASDAQ + AMEX) returned 13.9% CAGR. The same signal on a narrower universe produces lower returns. The difference is the universe.
S&P 500 is pre-filtered. Companies must already be large and successful to enter. Many of the cheapest value opportunities exist outside the index: recently fallen large-caps, mid-caps, and companies between index additions.
NYSE alone produced 11.1% CAGR. NASDAQ produced 8.9%, barely beating the S&P 500's 8.0%. Combined US beats both individual exchanges, because you're drawing from a larger pool of qualifying stocks. More candidates means better screening.
If you're running a low P/E screen, don't limit yourself to an index. Screen the full US market.
Finding 3: Emerging Markets Show Big Returns, Bigger Drawdowns
India stands out. BSE returned 16.9% CAGR and NSE returned 13.7% CAGR with the same signal, compared against the Sensex (11.1% CAGR). That's +5.8% and +2.6% excess over the local benchmark. The drawdowns are meaningful: -64.0% for BSE, -66.8% for NSE.
For comparison, the US combined universe had a max drawdown of -44.7%. Indian markets fell 20+ percentage points deeper.
The excess returns are more modest when measured against the local market. Sensex itself returned 11.1% CAGR over this period, so a good chunk of BSE's raw return is just the Indian market doing well. The screen still adds value, but it's not the +9% excess that a SPY comparison would suggest. The deep drawdowns make sense: emerging markets are more volatile, and the screen's value tilt concentrates that volatility.
Both BSE and NSE had 18 cash quarters (out of 103), meaning the screen sometimes couldn't find enough qualifying stocks. This happened mostly in the early 2000s when data coverage was thinner.
Finding 4: Hong Kong Is the Middle Ground
HKSE (Hong Kong) produced 14.4% CAGR with a Sharpe of 0.296, compared against the Hang Seng (1.8% CAGR). That's +12.6% excess, the largest alpha in this comparison. The screen ran 26.5 average stocks per quarter, meaning it found plenty of qualifying stocks.
The max drawdown was -58.6%, between the US (-44.7%) and India (-66.8%). Hong Kong sits between developed and emerging market behavior, which makes sense given its dual role as a gateway to mainland China and an international financial center.
The story here changed with local benchmarks. Against SPY, HKSE looked underwhelming on a risk-adjusted basis. Against the Hang Seng, it's the strongest case for the strategy. The Hang Seng barely grew over 25 years (1.8% CAGR), so the low P/E screen's 14.4% CAGR represents genuine stock-picking alpha, not just riding a rising market.
HKSE was invested in 102 out of 103 quarters (just 1 cash quarter), unlike India where 18 quarters had no qualifying stocks. Consistent data coverage combined with the highest excess return makes it one of the most compelling international results in this comparison.
Finding 5: UK Value Investing Now Has Data
LSE was one of our zero-data exchanges in the initial run. With improved FMP coverage, it now tells one of the strongest stories in the comparison.
13.6% CAGR against the FTSE 100's dismal 1.4%. That's +12.2% excess return, second only to Hong Kong's +12.6%. The FTSE 100 has been one of the worst-performing major indices over 25 years, so the low P/E screen's alpha looks enormous in context.
A few things stand out:
- Shallowest non-US drawdown. -43.1% max drawdown is closer to the US (-44.7%) than to India (-64%) or Japan (-61.2%). UK value stocks held up better in downturns.
- Highest win rate. 67% of quarters were positive, the best of any exchange in the comparison.
- Lower diversification. 17.9 average stocks per quarter is the smallest portfolio size among exchanges with full data. Fewer qualifying stocks means more concentration risk.
- Full coverage. 103/103 invested quarters, zero cash quarters. Unlike JPX or KSC, the screen always found enough stocks.
The combination of high excess return, moderate drawdowns, and consistent data makes LSE one of the better risk-adjusted international results. The main caveat: fewer stocks per quarter means individual company risk matters more.
See the full analysis: Low P/E on UK Stocks (LSE).
Finding 6: NYSE vs NASDAQ
An interesting split within the US market:
| NYSE (vs SPY) | NASDAQ (vs SPY) | US Combined | |
|---|---|---|---|
| CAGR | 11.1% | 8.9% | 13.9% |
| Excess | +3.1% | +0.9% | +5.8% |
| Max DD | -51.4% | -46.4% | -44.7% |
| Sharpe | 0.410 | 0.307 | 0.562 |
| Avg Stocks | 23.9 | 22.1 | 23.7 |
NYSE and NASDAQ still use SPY as their benchmark (not re-run with local index). NYSE beats NASDAQ on every metric. Why?
NASDAQ is growth-heavy. Most NASDAQ stocks trade at high P/E ratios. The few that pass a P/E < 15 screen tend to be companies with deteriorating fundamentals (former growth stocks whose earnings are declining). On NYSE, low P/E is more often a sign of a cyclical or mature business that's simply unfashionable.
The signal means different things on different exchanges. A P/E of 12 on NYSE is often a bank or industrial. A P/E of 12 on NASDAQ is often a company that just missed earnings expectations.
Limitations
These results come with significant caveats:
Local benchmarks for main exchanges, SPY for some. BSE, NSE, HKSE, US_MAJOR, LSE, JPX, and KSC use local benchmarks (Sensex, Hang Seng, S&P 500, FTSE 100, Nikkei 225, KOSPI). NYSE, NASDAQ, and STO still use SPY, since they weren't re-run with separate benchmarks. This gives a more honest picture of strategy alpha for the main exchanges.
Current exchange membership, not historical. We used today's profile data to determine which stocks are on each exchange. Companies that delisted or moved exchanges are excluded. This introduces survivorship bias, particularly for smaller exchanges.
Uneven data coverage. AMEX still has zero financial data. JPX and KSC have significant cash quarters (21 and 27 respectively), mostly in early years. Results for 2000-2005 on non-US exchanges should be treated as less reliable.
Financial reporting standards differ. P/E, ROE, and D/E ratios can mean different things under IFRS vs US GAAP vs Indian GAAP. A P/E of 12 under IFRS may not be comparable to a P/E of 12 under US GAAP due to differences in revenue recognition, depreciation, and capitalization rules.
Takeaway
Low P/E screening works across multiple exchanges, not just the S&P 500. But the quality of results depends heavily on two things: data coverage and market structure.
Where it works well: NYSE, combined US market, India (BSE/NSE), Hong Kong, LSE. These exchanges have enough stocks with financial data to build diversified portfolios, and all show meaningful excess returns over their local benchmarks.
Where it's marginal: JPX (+2.4% over Nikkei) and KSC (+0.1% over KOSPI) produced positive but thin excess returns with significant cash quarters. The screen works, but barely adds value over buying the index.
Where it fails: AMEX still has zero qualifying stocks. Data coverage is the binding constraint.
Where it works best: Hong Kong shows the highest excess return (+12.6% over Hang Seng), closely followed by the LSE (+12.2% over FTSE 100). The combined US universe (13.9% CAGR, +5.8% over S&P 500) has the best risk-adjusted performance. Local benchmarks give a more honest picture: India's BSE still leads on raw CAGR (16.9%), but only +5.8% of that is alpha over the Sensex.
The most actionable insight: if you're running a low P/E screen on US stocks, screen the full market, not just an index. You'll find more opportunities and better-fitting candidates.
Part of a Series
This is the full exchange comparison. We also have deep-dive analyses for individual markets: - Low P/E on US Stocks - 13.9% CAGR, the baseline - Low P/E on Indian Stocks (BSE + NSE) - 16.9% BSE / 13.7% NSE CAGR - Low P/E on Hong Kong Stocks (HKSE) - 14.4% CAGR - Low P/E on UK Stocks (LSE) - 13.6% CAGR, +12.2% vs FTSE 100
Run This Screen Yourself
All metrics used in this analysis (P/E, ROE, Debt/Equity) are queryable via SQL on Ceta Research. Swap the exchange filter and see what passes on any exchange today.
The full backtest code (Python + DuckDB) is available in our GitHub repository.
Data: Ceta Research, FMP financial data warehouse. 2000-2025, 103 quarters. Exchange membership from company profile table. Quarterly rebalance, equal weight, 0.2% round-trip transaction costs. Local benchmarks: Sensex (India), Hang Seng (Hong Kong), S&P 500 (US), FTSE 100 (UK), Nikkei 225 (Japan), KOSPI (Korea). STO and NYSE/NASDAQ individual results use SPY benchmark. All figures in local currency. Past performance does not guarantee future results. This is educational content, not investment advice.


