
Low P/E on UK Stocks: 13.6% CAGR Over 25 Years of LSE Data

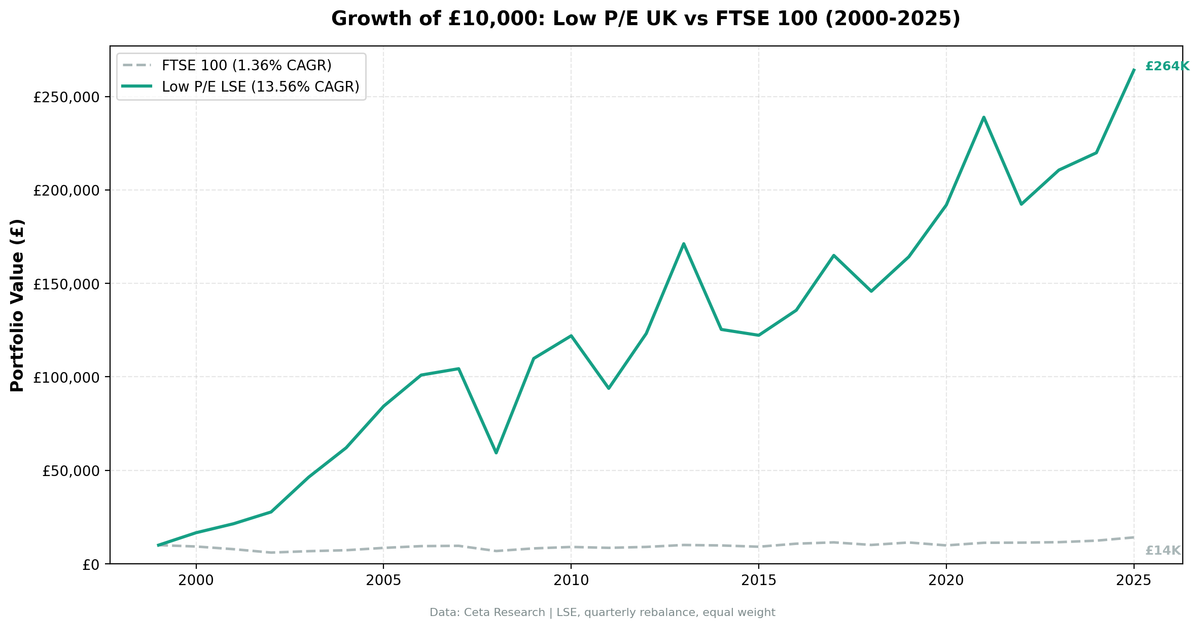
Low P/E screening on the London Stock Exchange returned 13.6% annually from 2000 to 2025. The FTSE 100 managed just 1.4% over the same period. That's +12.2 percentage points of excess return. The strategy outperformed in 67% of quarters, the highest win rate of any exchange we've tested. Max drawdown was -43.1%, the shallowest of any non-US exchange and comparable to the US result (-44.7%). But context matters: the FTSE's 25-year performance is even weaker than the Hang Seng's 1.8%, so part of that excess reflects a low bar.
Contents
- Method
- The Screen (SQL)
- Results
- Year-by-Year Returns
- Key Observations
- 2000-2005: Six straight years of outperformance
- 2008: The worst year (-43.1%)
- 2011: Eurozone contagion (-23.1%)
- 2014: Oil and commodity crash (-26.8%)
- 2016: Brexit vote (+11% vs FTSE's +18%)
- 2020: COVID year (+16.9% vs FTSE's -13.6%)
- 2022: Rate hike pain (-19.5%)
- Currency Note
- Limitations
- Takeaway
- Part of a Series
- Run This Screen Yourself
Method
Signal: Same as our S&P 500 backtest: - P/E between 0 and 15 (fiscal year) - ROE > 10% - Debt/Equity < 1.0 - Market cap > £500M
Portfolio: Top 30 by lowest P/E, equal weight, quarterly rebalance Transaction costs: 0.1% per trade (0.2% round-trip per stock per quarter) Period: 2000-2025 (103 quarters) Benchmark: FTSE 100 (^FTSE) Universe: Current LSE membership via company profile data. Not historical membership.
LSE averaged 17.9 stocks per quarter with zero cash quarters. The qualifying pool is smaller than HKSE (26.5) or India (26-27), which means less diversification per rebalance. Still, 18 stocks is enough to capture the value premium without excessive concentration.
For the full methodology and quality filter rationale, see the main US Low P/E post.
The Screen (SQL)
SELECT
    r.symbol,
    p.companyName,
    p.exchange,
    r.priceToEarningsRatioTTM as pe_ratio,
    k.returnOnEquityTTM * 100 as roe_pct,
    r.debtToEquityRatioTTM as debt_to_equity,
    k.marketCap / 1e9 as market_cap_billions
FROM financial_ratios_ttm r
JOIN key_metrics_ttm k ON r.symbol = k.symbol
JOIN profile p ON r.symbol = p.symbol
WHERE r.priceToEarningsRatioTTM > 0
    AND r.priceToEarningsRatioTTM < 15
    AND k.returnOnEquityTTM > 0.10
    AND r.debtToEquityRatioTTM >= 0
    AND r.debtToEquityRatioTTM < 1.0
    AND k.marketCap > 500000000
    AND p.exchange = 'LSE'
ORDER BY r.priceToEarningsRatioTTM ASC
LIMIT 30
Run this query on Ceta Research
Results
| Metric | LSE (GBP) | FTSE 100 |
|---|---|---|
| CAGR | 13.6% | 1.4% |
| Total Return | 2,541% | 41.4% |
| Volatility | 27.2% | - |
| Max Drawdown | -43.1% | - |
| Sharpe Ratio | 0.370 | - |
| Excess CAGR vs FTSE | +12.2% | - |
| Win Rate (quarterly) | 67.0% | - |
| Avg Stocks per Period | 17.9 | - |
| Cash Quarters | 0/103 | - |
The 0.370 Sharpe is the highest of any exchange we've tested. Zero cash quarters means the screen always found qualifying stocks. The 67% quarterly win rate is also the best across all exchanges. UK value stocks have been remarkably consistent relative to their benchmark.
Year-by-Year Returns
| Year | LSE (GBP) | FTSE 100 | Excess | Notes |
|---|---|---|---|---|
| 2000 | +66.4% | -7.4% | +73.8% | |
| 2001 | +28.9% | -15.5% | +44.4% | |
| 2002 | +29.3% | -23.2% | +52.5% | Dot-com bust |
| 2003 | +67.0% | +12.5% | +54.6% | Recovery |
| 2004 | +34.0% | +7.5% | +26.5% | |
| 2005 | +35.9% | +17.2% | +18.6% | |
| 2006 | +19.7% | +11.1% | +8.7% | |
| 2007 | +3.4% | +1.7% | +1.7% | |
| 2008 | -43.1% | -28.9% | -14.2% | Global crisis |
| 2009 | +85.1% | +20.6% | +64.5% | Recovery |
| 2010 | +11.1% | +9.3% | +1.7% | |
| 2011 | -23.1% | -5.2% | -17.8% | Eurozone crisis |
| 2012 | +31.3% | +5.7% | +25.5% | |
| 2013 | +39.0% | +11.5% | +27.6% | |
| 2014 | -26.8% | -2.5% | -24.2% | Oil/commodity crash |
| 2015 | -2.5% | -6.9% | +4.5% | |
| 2016 | +11.0% | +17.8% | -6.8% | Brexit vote |
| 2017 | +21.6% | +6.5% | +15.1% | |
| 2018 | -11.6% | -11.9% | +0.3% | |
| 2019 | +12.7% | +12.9% | -0.3% | |
| 2020 | +16.9% | -13.6% | +30.4% | COVID |
| 2021 | +24.4% | +14.2% | +10.2% | |
| 2022 | -19.5% | +0.7% | -20.1% | Rate hikes |
| 2023 | +9.5% | +2.2% | +7.3% | |
| 2024 | +4.4% | +7.0% | -2.6% | |
| 2025 | +20.1% | +14.1% | +6.0% | Q1 partial |
Key Observations
2000-2005: Six straight years of outperformance
The strategy's best stretch. The dot-com bust crushed growth stocks while cheap, profitable companies held up or rallied. Six consecutive years of positive excess return averaging +37% per year. The FTSE 100 lost money in 2000, 2001, and 2002 while the portfolio gained double digits each year. Value investors in UK stocks had a golden window here.
This period is unusually strong. It coincides with the global rotation from growth to value that followed the tech bubble. UK large-caps with low P/E ratios, high ROE, and conservative balance sheets were the direct beneficiaries.
2008: The worst year (-43.1%)
The global financial crisis hit UK value stocks harder than the broad market. The portfolio fell 43.1% while the FTSE dropped 28.9%. Banks and financials that passed the P/E and ROE filters going into 2008 were destroyed. The UK's heavy financial sector weighting made this worse than the US drawdown. The recovery in 2009 (+85.1% vs FTSE's +20.6%) more than compensated, but surviving a 43% decline requires real conviction.
2011: Eurozone contagion (-23.1%)
The European debt crisis spilled into UK value stocks. The portfolio fell 23% while the FTSE dropped only 5%. UK companies with European revenue exposure were marked down aggressively. 2012-2013 recovered strongly (+31% and +39%), making this a two-year round trip.
2014: Oil and commodity crash (-26.8%)
The worst year relative to the benchmark. The portfolio fell 27% while the FTSE declined just 2.5%. UK value stocks skew toward resource companies, mining firms, and industrials. The 2014 commodity collapse hit these sectors hard. The FTSE 100's diversification across sectors protected it.
2016: Brexit vote (+11% vs FTSE's +18%)
One of the rare years where the strategy trailed a rising market. The post-Brexit currency devaluation boosted internationally-exposed FTSE 100 companies (which earn revenue in USD and EUR). The screen's domestically-oriented value stocks didn't benefit as much.
2020: COVID year (+16.9% vs FTSE's -13.6%)
The screen's best relative year since the early 2000s. A 30-point excess over the FTSE. Cheap UK stocks bounced back from the March 2020 crash faster than the index. Many value names were already depressed going into COVID and recovered when panic selling reversed.
2022: Rate hike pain (-19.5%)
The strategy's second-worst year relative to the FTSE. Rising interest rates and energy price spikes created a difficult environment for UK value stocks. The FTSE 100, buoyed by energy majors like Shell and BP, eked out a small gain while the portfolio dropped 20%.
Currency Note
Returns are in British Pounds. Unlike the HKD (pegged to USD), GBP fluctuates freely. From 2000 to 2025, GBP depreciated roughly 20% against the USD, from about $1.50 to $1.20. That translates to approximately 0.8-0.9% annual drag for a USD-based investor.
The alpha over the FTSE 100 is unaffected by currency, since both the portfolio and benchmark are in GBP. But the absolute return in dollar terms would be lower than the 13.6% GBP figure.
Limitations
FTSE's low bar. The FTSE 100 returned just 1.4% annualized over 25 years. That's worse than the Hang Seng's 1.8%. The +12.2% excess partly reflects a terrible benchmark rather than extraordinary alpha. The strategy's 13.6% absolute CAGR is a better measure of performance.
Lower diversification. 17.9 average stocks per quarter is the lowest count across all exchanges we've tested. HKSE averaged 26.5, India averaged 26-27. Fewer qualifying stocks means more concentration risk and higher sensitivity to individual company outcomes.
Current exchange membership, not historical. We used today's profile data for LSE membership. Companies that delisted, were acquired, or moved primary listings aren't captured. The UK had significant M&A activity (especially in mining and financial services) that could affect results.
FMP data coverage evolution. In our earlier global comparison, LSE returned zero qualifying stocks. FMP's UK financial data has since improved, enabling this backtest. This means the data quality for earlier years may still be thinner than for recent years.
Financial sector concentration. The UK's large financial sector means value screens tend to overweight banks, insurers, and asset managers. These are cyclical businesses that can pass quality filters going into a crisis and then suffer disproportionate losses.
Stamp duty not modeled. The UK charges 0.5% stamp duty on share purchases. This isn't captured in the 0.1% transaction cost assumption. With quarterly rebalancing and ~18 stocks, this adds meaningful drag that isn't reflected in the results.
Takeaway
Low P/E on UK stocks works. 13.6% CAGR over 25 years, +12.2% excess over the FTSE 100, the highest quarterly win rate (67%) of any exchange tested, and the best Sharpe ratio (0.370). Zero cash quarters. The screen consistently found qualifying stocks throughout the full period.
The FTSE 100's 1.4% annualized return is dismal, so the excess return is partly a function of a weak benchmark. The absolute performance of 13.6% is comparable to the US (13.9%) and Hong Kong (14.4%), which suggests the value premium is real rather than an artifact of the benchmark.
Risk is moderate by the standards of this strategy. Max drawdown of -43.1% is the shallowest non-US result. 2008 was painful (-43%), and 2014 (-27%) was a bad year specific to UK sector composition. But the recovery pattern is consistent: every major drawdown was followed by strong positive years.
The 2000-2005 golden window drove a large chunk of total returns. Investors who started in 2006 would see a materially different CAGR. That's not unique to UK stocks, but it's worth acknowledging.
Part of a Series
This analysis is part of our Low P/E global exchange comparison: - Low P/E on US Stocks (S&P 500) - 13.9% CAGR - Low P/E on Indian Stocks (BSE + NSE) - 16.9% on BSE - Low P/E on Hong Kong Stocks (HKSE) - 14.4% CAGR - Low P/E Across Global Exchanges - full comparison
Run This Screen Yourself
All metrics used in this analysis (P/E, ROE, Debt/Equity) are queryable via SQL on Ceta Research. Filter by exchange (LSE) and see what passes today.
The full backtest code (Python + DuckDB) is available in our GitHub repository.
Data: Ceta Research, FMP financial data warehouse. Universe: LSE. Quarterly rebalance, equal weight, 2000-2025. Returns in GBP unless noted. This is not investment advice. Past performance doesn't guarantee future results.


