
Low P/E on Indian Stocks: 16.9% CAGR on BSE, 13.7% on NSE Over 25 Years
Low P/E with quality filters returned 16.9% CAGR on BSE and 13.7% on NSE over 25 years, beating the Sensex by +5.8% and +2.6% respectively. Max drawdown hit -67%.

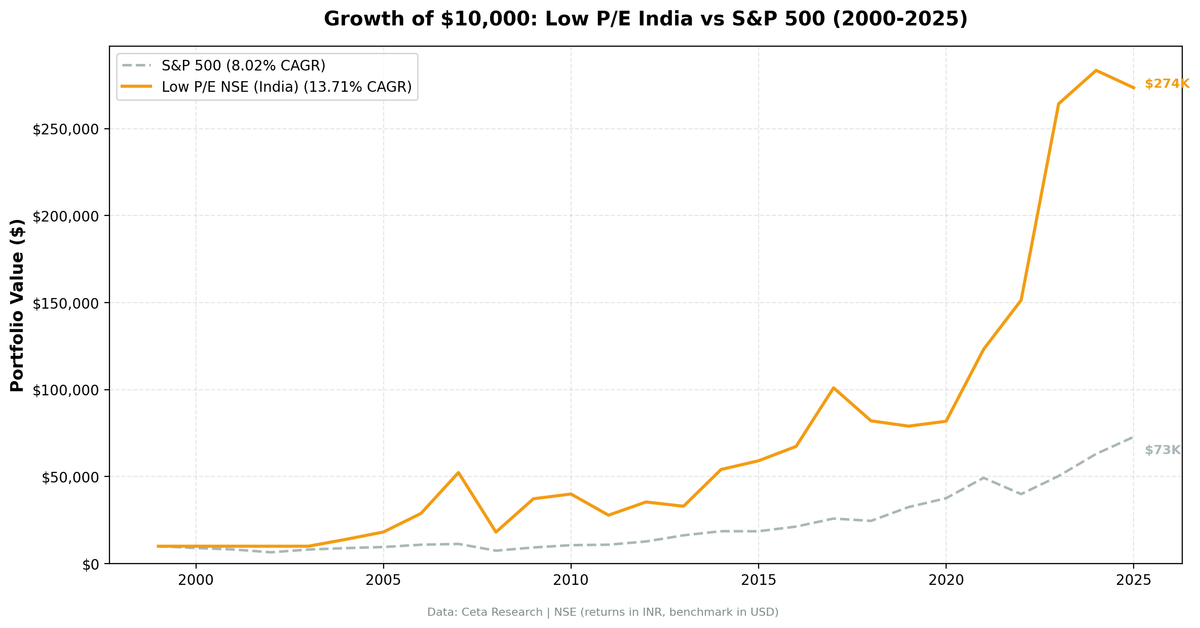
Low P/E screening on Indian exchanges produced strong returns. BSE returned 16.9% annually. NSE returned 13.7%. Both beat the Sensex's 11.1%. BSE's excess return of +5.8% over the local benchmark is meaningful. NSE's +2.6% is modest. Max drawdowns hit -64% on BSE and -67% on NSE, worse than the Sensex's -51%. This is a high-return, high-pain strategy.
Contents
- Method
- The Screen (SQL)
- Combined Results
- Year-by-Year Returns
- Key Observations
- 2000-2003: Cash years
- 2004-2005: The breakout (+75% BSE, +39% NSE in 2004)
- 2007-2008: The full cycle
- 2014: The Modi rally (+92% BSE, +64% NSE)
- 2018-2019: The drawdown (-19% BSE, then -3% BSE)
- 2021-2023: The recovery (+48% BSE, +51% NSE in 2021)
- 2025: Pullback (-4% BSE, -4% NSE)
- Currency Note
- BSE vs NSE
- Limitations
- Takeaway
- Part of a Series
- Run This Screen Yourself
Data: FMP financial data warehouse, 2000–2025. Updated March 2026.
Method
Signal: Same as our S&P 500 backtest: - P/E between 0 and 15 (fiscal year) - ROE > 10% - Debt/Equity < 1.0 - Market cap > ₹20B (~$240M USD)
Portfolio: Top 30 by lowest P/E, equal weight, quarterly rebalance Transaction costs: 0.1% per trade (0.2% round-trip per stock per quarter) Period: 2000-2025 (103 quarters) Benchmark: BSE Sensex (^BSESN) Universe: Current BSE and NSE membership via company profile data. Not historical membership.
For the full methodology and quality filter rationale, see the main US Low P/E post.
The Screen (SQL)
SELECT
    r.symbol,
    p.companyName,
    p.exchange,
    r.priceToEarningsRatioTTM as pe_ratio,
    k.returnOnEquityTTM * 100 as roe_pct,
    r.debtToEquityRatioTTM as debt_to_equity,
    k.marketCap / 1e9 as market_cap_billions
FROM financial_ratios_ttm r
JOIN key_metrics_ttm k ON r.symbol = k.symbol
JOIN profile p ON r.symbol = p.symbol
WHERE r.priceToEarningsRatioTTM > 0
    AND r.priceToEarningsRatioTTM < 15
    AND k.returnOnEquityTTM > 0.10
    AND r.debtToEquityRatioTTM >= 0
    AND r.debtToEquityRatioTTM < 1.0
    AND k.marketCap > 20000000000
    AND p.exchange IN ('BSE', 'NSE')
ORDER BY r.priceToEarningsRatioTTM ASC
LIMIT 30
Run this query on Ceta Research
Combined Results
| Metric | BSE (INR) | NSE (INR) | Sensex (INR) |
|---|---|---|---|
| CAGR | 16.9% | 13.7% | 11.1% |
| Total Return | 5,480% | 2,636% | 1,411% |
| Volatility | 29.0% | 28.7% | - |
| Max Drawdown | -64.0% | -66.8% | -51.3% |
| Sharpe Ratio | 0.359 | 0.251 | 0.194 |
| Excess CAGR vs Sensex | +5.8% | +2.6% | - |
| Win Rate (quarterly) | 54% | 50% | - |
| Avg Stocks per Period | 26.5 | 27.0 | - |
| Cash Quarters | 18/103 | 18/103 | - |
BSE edges out NSE on both raw return (16.9% vs 13.7%) and Sharpe (0.359 vs 0.251). Both had 18 cash quarters concentrated in 2000-2003 when data coverage for Indian large-caps was thin.
Year-by-Year Returns
| Year | BSE (INR) | NSE (INR) | Sensex (INR) | Notes |
|---|---|---|---|---|
| 2000 | 0.0% | - | -25.2% | Cash |
| 2001 | 0.0% | - | -18.6% | Cash |
| 2002 | 0.0% | - | +2.9% | Cash |
| 2003 | 0.0% | - | +79.1% | Cash |
| 2004 | +75.2% | +39.4% | +10.8% | |
| 2005 | +35.8% | +30.4% | +40.6% | |
| 2006 | +29.3% | +58.7% | +48.5% | |
| 2007 | +98.2% | +81.5% | +46.8% | Pre-crisis boom |
| 2008 | -61.7% | -65.4% | -51.3% | Global crisis |
| 2009 | +108.3% | +105.8% | +76.3% | Recovery |
| 2010 | +17.6% | +7.2% | +17.1% | |
| 2011 | -28.5% | -30.4% | -24.5% | Eurozone fears |
| 2012 | +30.1% | +27.2% | +27.0% | |
| 2013 | -5.9% | -6.9% | +6.0% | Taper tantrum |
| 2014 | +91.7% | +64.0% | +33.5% | Modi rally |
| 2015 | +8.0% | +9.3% | -8.1% | |
| 2016 | +15.8% | +13.9% | +3.8% | Demonetization |
| 2017 | +63.0% | +50.0% | +27.1% | |
| 2018 | -18.5% | -18.8% | +6.2% | IL&FS crisis |
| 2019 | -3.4% | -3.7% | +16.0% | Shadow bank stress |
| 2020 | +3.2% | +3.6% | +15.7% | COVID recovery |
| 2021 | +48.0% | +50.5% | +22.9% | |
| 2022 | +27.6% | +22.9% | +3.4% | Rate hikes |
| 2023 | +67.9% | +74.6% | +17.5% | |
| 2024 | +14.8% | +7.3% | +11.2% | |
| 2025 | -3.5% | -3.5% | +1.6% | Q1 partial |
Key Observations
2000-2003: Cash years
The screen sat in cash for the first four years. FMP data coverage for Indian large-caps was thin in the early 2000s, and few companies had enough financial ratio data to pass the screen. This is honest accounting. The 16.9% CAGR on BSE and 13.7% on NSE include these dead years. Meanwhile the Sensex returned +79% in 2003 alone, so the cash drag cost real alpha.
2004-2005: The breakout (+75% BSE, +39% NSE in 2004)
India's equity market came alive in 2004. Foreign institutional investors started pouring in. Companies that had been ignored suddenly qualified: low P/E, solid ROE, conservative balance sheets. The screen loaded up right as the market re-rated. BSE returned 75%, crushing the Sensex's 11%. NSE returned 39%.
2007-2008: The full cycle
2007 was the peak. BSE gained 98%, NSE gained 82%. Indian stocks were in a full-blown bull market. Then 2008 happened. BSE dropped 62%. NSE dropped 65%. Worse than the Sensex's 51% decline. Value stocks fell harder than the broad market. Quality filters didn't prevent this. They did enable the 2009 recovery: +108% on BSE, +106% on NSE, both outpacing the Sensex's +76%.
2014: The Modi rally (+92% BSE, +64% NSE)
The election of Narendra Modi as Prime Minister triggered a re-rating of quality Indian companies. Foreign capital poured into high-ROE, low-debt names. These are exactly the stocks that pass our screen. BSE returned 92% in a single year. NSE returned 64%. The Sensex gained 34%. This was one of the best single-year returns in the entire backtest, and the widest gap over the benchmark.
2018-2019: The drawdown (-19% BSE, then -3% BSE)
India's shadow banking crisis (IL&FS collapse) hit value stocks. 2018 saw BSE drop 19% while the Sensex gained 6%. 2019 added another 3% decline while the Sensex gained 16%. Two consecutive losing years against a rising benchmark. This is the Indian equivalent of the US growth dominance in 2015-2020: the strategy was out of favor.
2021-2023: The recovery (+48% BSE, +51% NSE in 2021)
Post-COVID recovery, combined with domestic policy support (PLI manufacturing incentives), drove a re-rating. Value stocks that had been beaten down in 2018-2019 recovered strongly. 2022 and 2023 continued the trend, with BSE returning +28% and +68% respectively, well ahead of the Sensex's +3% and +18% in those years.
2025: Pullback (-4% BSE, -4% NSE)
Q1 2025 brought a mild correction after two strong years, while the Sensex eked out +2%. Still only partial-year data, so this could change.
Currency Note
Since the benchmark is now the Sensex, both strategy returns and benchmark returns are in Indian Rupees. The +5.8% alpha on BSE and +2.6% on NSE are apples-to-apples comparisons with no currency distortion.
For USD-based investors, the INR/USD rate moved from roughly 43 in 2000 to roughly 84 in 2024, a ~2.7% annual drag. That would reduce the absolute CAGR in dollar terms but wouldn't change the alpha over the Sensex, since the benchmark takes the same currency hit.
BSE vs NSE
| Metric | BSE | NSE |
|---|---|---|
| CAGR | 16.9% | 13.7% |
| Total Return | 5,480% | 2,636% |
| Volatility | 29.0% | 28.7% |
| Max Drawdown | -64.0% | -66.8% |
| Sharpe | 0.359 | 0.251 |
| Excess vs Sensex | +5.8% | +2.6% |
| Avg Stocks | 26.5 | 27.0 |
| Cash Quarters | 18/103 | 18/103 |
| Win Rate | 54% | 50% |
BSE wins on both raw return and risk-adjusted return. Many Indian companies list on both exchanges, but the qualifying pool differs. BSE had slightly fewer qualifying stocks per quarter (26.5 vs 27.0) but delivered higher returns with similar volatility. NSE's +2.6% alpha over the Sensex is thin enough that transaction costs and slippage could erode it further.
Limitations
Cash quarters. 18 of 103 quarters were cash. All concentrated in 2000-2003 when data coverage was thin. Investors would have seen zero returns for the first four years while the Sensex recovered from its 2000-2001 lows.
Survivorship bias. Exchange membership uses current company profiles, not historical. Indian exchanges had different compositions in the early 2000s. Delisted companies aren't captured.
Market cap filter in local currency. The ₹20B threshold is in Indian Rupees, a fixed local-currency amount. This is more consistent than a USD-denominated filter, which would tighten as the Rupee depreciated over 25 years.
Liquidity. Some BSE-listed stocks that pass the screen may have thin trading volumes. The backtest assumes frictionless execution at closing prices. Slippage on mid-cap Indian stocks can be material.
No STT or capital gains tax. India's Securities Transaction Tax and short-term capital gains tax aren't modeled.
Takeaway
Low P/E on Indian stocks produced strong returns. 16.9% CAGR on BSE, 13.7% on NSE, across 25 years. Against the Sensex's 11.1%, that's +5.8% alpha on BSE and a more modest +2.6% on NSE. No currency distortion in these numbers.
But the ride is rough. Max drawdowns hit -64% on BSE and -67% on NSE, worse than the Sensex's -51%. The 2018-2019 stretch saw consecutive losing years while the broad market gained. The strategy requires patience through extended periods of underperformance.
BSE is the stronger result. NSE's thin alpha margin leaves less room for error after costs and slippage. India's structural growth created a deep pool of cheap, profitable companies. The low P/E screen captured them, but the edge over the Sensex is narrower than the raw CAGR suggests.
Part of a Series
This analysis is part of our Low P/E global exchange comparison: - Low P/E on US Stocks (S&P 500) - 13.9% CAGR, the baseline - Low P/E on Hong Kong Stocks (HKSE) - 14.4% CAGR, high volatility - Low P/E on UK Stocks (LSE) - 13.6% CAGR, +12.2% vs FTSE 100 - Low P/E Across 12 Global Exchanges - full comparison table
Run This Screen Yourself
All metrics used in this analysis (P/E, ROE, Debt/Equity) are queryable via SQL on Ceta Research. Filter by exchange (BSE or NSE) and see what passes today.
The full backtest code (Python + DuckDB) is available in our GitHub repository.
Data: Ceta Research, FMP financial data warehouse. Universe: BSE + NSE. Quarterly rebalance, equal weight, 2000-2025. Returns in INR unless noted.
Past performance does not guarantee future results. This is educational content, not investment advice.


