
Low P/E on Hong Kong Stocks: 14.4% CAGR Over 25 Years of HKSE Data
Low P/E with quality filters returned 14.4% annually on HKSE-listed stocks from 2000-2025. That's +12.6% over the Hang Seng Index (1.8% CAGR). The catch: 38.5% volatility, -59% max drawdown, and a 2024-2025 spike that needs an asterisk.

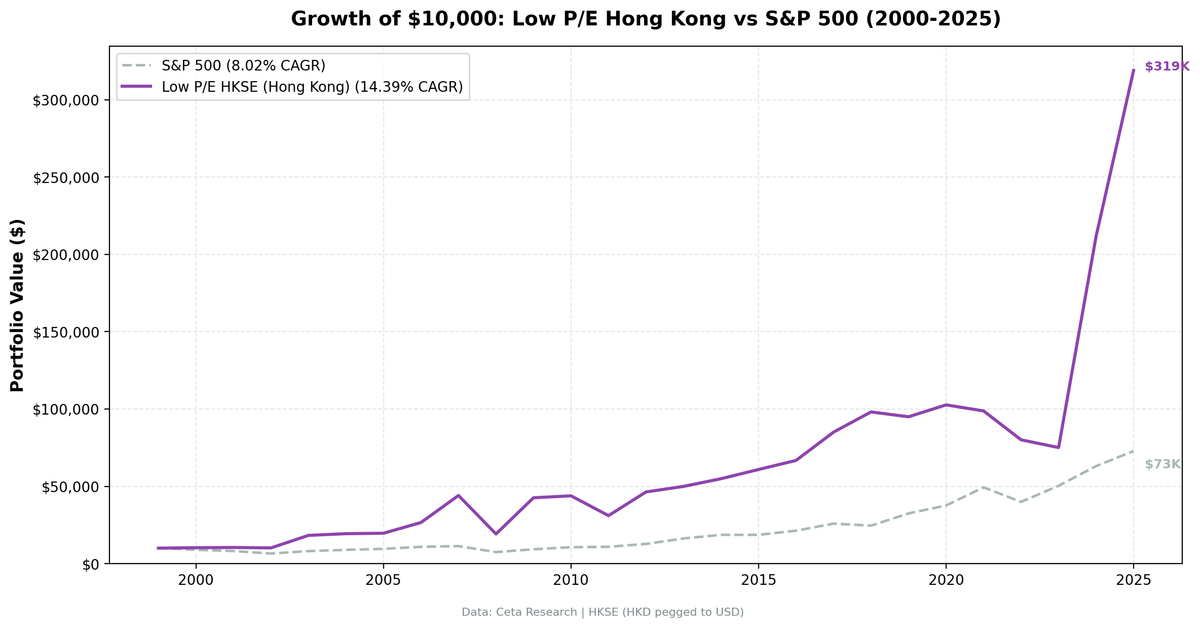
Low P/E screening on Hong Kong's HKSE returned 14.4% annually from 2000 to 2025. That's +12.6 percentage points above the Hang Seng Index, which managed just 1.8% CAGR over the same period. The strategy's Sharpe of 0.296 towers over the Hang Seng's -0.058. But context matters: the Hang Seng's terrible 25-year performance makes almost anything look good by comparison. Volatility ran 38.5%, max drawdown hit -59%, and 2024-2025 posted back-to-back returns of +182% and +51%, which need an asterisk. Hong Kong value investing crushes the local benchmark, but it comes with significant volatility and deep drawdowns.
Contents
- Method
- The Screen (SQL)
- Results
- Year-by-Year Returns
- Key Observations
- 2003: SARS recovery (+80%)
- 2007-2008: Boom, then bust
- 2009: The best single year (+122%)
- 2019-2023: Mixed results against the local benchmark
- 2024-2025: The +182% and +51% anomaly
- Currency Note
- Limitations
- Takeaway
- Part of a Series
- Run This Screen Yourself
Data: FMP financial data warehouse, 2000–2025. Updated March 2026.
Method
Signal: Same as our S&P 500 backtest: - P/E between 0 and 15 (fiscal year) - ROE > 10% - Debt/Equity < 1.0 - Market cap > HK$2B (~$256M USD)
Portfolio: Top 30 by lowest P/E, equal weight, quarterly rebalance Transaction costs: 0.1% per trade (0.2% round-trip per stock per quarter) Period: 2000-2025 (103 quarters) Benchmark: Hang Seng Index (^HSI) Universe: Current HKSE membership via company profile data. Not historical membership.
HKSE had a high average stock count (26.5 per quarter). The screen consistently found plenty of qualifying stocks. Just 1 cash quarter out of 103.
For the full methodology and quality filter rationale, see the main US Low P/E post.
The Screen (SQL)
SELECT
    r.symbol,
    p.companyName,
    p.exchange,
    r.priceToEarningsRatioTTM as pe_ratio,
    k.returnOnEquityTTM * 100 as roe_pct,
    r.debtToEquityRatioTTM as debt_to_equity,
    k.marketCap / 1e9 as market_cap_billions
FROM financial_ratios_ttm r
JOIN key_metrics_ttm k ON r.symbol = k.symbol
JOIN profile p ON r.symbol = p.symbol
WHERE r.priceToEarningsRatioTTM > 0
    AND r.priceToEarningsRatioTTM < 15
    AND k.returnOnEquityTTM > 0.10
    AND r.debtToEquityRatioTTM >= 0
    AND r.debtToEquityRatioTTM < 1.0
    AND k.marketCap > 2000000000
    AND p.exchange = 'HKSE'
ORDER BY r.priceToEarningsRatioTTM ASC
LIMIT 30
Run this query on Ceta Research
Results
| Metric | HKSE (HKD) | Hang Seng Index |
|---|---|---|
| CAGR | 14.4% | 1.8% |
| Total Return | 3,090% | 57.1% |
| Volatility | 38.5% | - |
| Max Drawdown | -58.6% | -50.5% |
| Sharpe Ratio | 0.296 | -0.058 |
| Excess CAGR vs Hang Seng | +12.6% | - |
| Win Rate (quarterly) | 58% | - |
| Avg Stocks per Period | 26.5 | - |
| Cash Quarters | 1/103 | - |
The Sharpe of 0.296 vs the Hang Seng's -0.058 shows strong risk-adjusted outperformance against the local market. The Hang Seng returned just 1.8% annualized over 25 years, so the +12.6% excess looks enormous. That's partly genuine alpha and partly a reflection of how poorly the broad Hong Kong market has performed.
Year-by-Year Returns
| Year | HKSE (HKD) | Hang Seng Index | Excess | Notes |
|---|---|---|---|---|
| 2000 | +2.9% | -14.4% | +17.3% | |
| 2001 | +1.3% | -23.7% | +25.0% | |
| 2002 | -2.7% | -17.5% | +14.8% | |
| 2003 | +79.9% | +36.7% | +43.2% | SARS recovery |
| 2004 | +6.0% | +11.2% | -5.2% | |
| 2005 | +1.5% | +5.0% | -3.5% | |
| 2006 | +35.4% | +35.9% | -0.5% | |
| 2007 | +65.7% | +35.7% | +30.0% | Pre-crisis boom |
| 2008 | -56.5% | -45.4% | -11.1% | Global crisis |
| 2009 | +122.4% | +45.1% | +77.3% | Recovery |
| 2010 | +2.9% | +7.4% | -4.5% | |
| 2011 | -29.2% | -19.4% | -9.8% | |
| 2012 | +49.4% | +23.5% | +25.9% | |
| 2013 | +7.7% | +0.1% | +7.6% | |
| 2014 | +9.9% | +2.2% | +7.7% | |
| 2015 | +10.8% | -10.6% | +21.4% | |
| 2016 | +9.7% | +3.9% | +5.8% | |
| 2017 | +27.4% | +37.8% | -10.4% | |
| 2018 | +15.4% | -17.6% | +33.0% | |
| 2019 | -3.2% | +13.6% | -16.8% | Protests |
| 2020 | +8.1% | -3.8% | +11.9% | COVID |
| 2021 | -3.8% | -15.3% | +11.5% | China crackdown |
| 2022 | -18.9% | -13.4% | -5.5% | |
| 2023 | -6.2% | -16.7% | +10.5% | |
| 2024 | +182.0% | +16.9% | +165.1% | Anomalous |
| 2025 | +50.7% | +39.0% | +11.7% | Anomalous |
Key Observations
2003: SARS recovery (+80%)
Hong Kong's economy was hammered by SARS in early 2003. Stock prices collapsed. Then they bounced. Cheap stocks that survived the crisis recovered violently. The screen was fully loaded with 26+ stocks at depressed P/E multiples. When the recovery came, the gains were enormous: +80% in a single year, beating the Hang Seng's +37% by 43 points.
2007-2008: Boom, then bust
2007 delivered +66%, nearly doubling the Hang Seng's +36%. Hong Kong was riding the China growth story, with mainland capital flowing through the territory. Then 2008 hit: -57%. Nearly the entire 2007 gain was wiped out in a single year. The max drawdown of -58.6% was reached during this period. The 2009 recovery (+122%) more than made up for it, but you had to survive a 57% portfolio loss first.
2009: The best single year (+122%)
This is one of the largest annual returns across all exchanges except XETRA (which has data quality issues). Coming off a -57% year, the portfolio rebounded 122%, crushing the Hang Seng's +45%. Value stocks that had been beaten down to single-digit P/E ratios recovered as credit markets normalized. The pattern is clear: deep crashes create the conditions for spectacular recoveries.
2019-2023: Mixed results against the local benchmark
Against the Hang Seng, this period looks very different than it did against SPY. The strategy actually outperformed in three of five years: 2020 (+8.1% vs -3.8%), 2021 (-3.8% vs -15.3%), and 2023 (-6.2% vs -16.7%). Only 2019 (-3.2% vs +13.6%) and 2022 (-18.9% vs -13.4%) were genuine underperformance years. The strategy lost money in absolute terms, but the Hang Seng was losing more. Hong Kong's structural problems (protests, COVID, China's tech crackdown, geopolitical tension) hurt everything. The value screen held up better than the index through most of it.
2024-2025: The +182% and +51% anomaly
2024 and 2025 both stand out. +182% followed by +51% in back-to-back years is the kind of return that demands skepticism. The Hang Seng also rallied (+17% and +39%), but not nearly as much. Possible explanations: extreme reversion from the prior underperformance, a narrow set of deeply discounted stocks recovering, or data artifacts in price adjustments for corporate actions. We include these years in the reported numbers but flag them as anomalous. Stripping out 2024-2025, the 23-year CAGR drops significantly.
Currency Note
HKSE returns are in Hong Kong Dollars. The HKD is pegged to the USD (7.75-7.85 range), so currency effects are minimal. Unlike the India analysis, currency adjustment doesn't meaningfully change the results here. A US-based investor would have experienced returns very close to the reported HKD figures.
Limitations
Hang Seng's low bar. The Hang Seng returned just 1.8% annualized over 25 years, making the +12.6% excess look enormous. A weak benchmark flatters relative performance. The strategy's absolute 14.4% CAGR is more meaningful than the excess figure.
Current exchange membership, not historical. We used today's profile data. Companies that delisted or relocated aren't captured. This is particularly relevant for Hong Kong, where several companies have delisted or moved primary listings since 2019.
2024-2025 anomaly. The +182% return in 2024 and +51% in 2025 significantly inflate the CAGR. Results excluding these two years look materially different.
China exposure. Many HKSE-listed companies are mainland Chinese businesses. "Hong Kong stocks" is partly a proxy for Chinese exposure, with all the regulatory and political risks that implies.
Liquidity. Some HKSE-listed stocks have thin trading volumes, especially smaller-cap names at the edge of the HK$2B threshold.
Takeaway
Low P/E on Hong Kong stocks works over 25 years. 14.4% CAGR vs the Hang Seng's 1.8%. +12.6% excess return. The screen found plenty of qualifying stocks (26.5 average per quarter, just 1 cash quarter). Value opportunities exist in Hong Kong.
The risk-adjusted picture is strong against the local benchmark. Sharpe of 0.296 vs the Hang Seng's -0.058. The strategy outperformed in 18 of 26 years. Even during the difficult 2019-2023 stretch, the screen beat the Hang Seng in three of five years. Only 2019 and 2022 were genuine underperformance years against the index.
The caveat: the Hang Seng's 1.8% annualized return over 25 years is dismal, so the +12.6% excess partly reflects a weak benchmark rather than extraordinary alpha. And 2024-2025 (+182% and +51%) still inflate the numbers. Strip those out and the picture changes.
Hong Kong value investing is profitable but volatile. The alpha vs the local market is real. So is the pain of -59% drawdowns and years of negative absolute returns.
Part of a Series
This analysis is part of our Low P/E global exchange comparison: - Low P/E on US Stocks (S&P 500) - 13.9% CAGR, the baseline - Low P/E on Indian Stocks (BSE + NSE) - 16.9% CAGR on BSE, 13.7% on NSE - Low P/E on UK Stocks (LSE) - 13.6% CAGR, +12.2% vs FTSE 100 - Low P/E Across 12 Global Exchanges - full comparison table
Run This Screen Yourself
All metrics used in this analysis (P/E, ROE, Debt/Equity) are queryable via SQL on Ceta Research. Filter by exchange (HKSE) and see what passes today.
The full backtest code (Python + DuckDB) is available in our GitHub repository.
Data: Ceta Research, FMP financial data warehouse. Universe: HKSE. Quarterly rebalance, equal weight, 2000-2025. Returns in HKD unless noted.
Past performance does not guarantee future results. This is educational content, not investment advice.


