
Low Volatility Quality Beats Local Markets in 12 of 14 Exchanges
We tested low-vol quality on 14 exchanges with the same screen: ROE > 10%, OPM > 10%, lowest 252-day volatility. Measured against local benchmarks, it beats the home market in 12 of 14 exchanges. China leads at +7.1% over the SSE Composite, India +5.8% over the Sensex. US and Germany trail.

We ran the same low-volatility quality screen across 14 exchanges on five continents. Same rules everywhere: ROE > 10%, operating margin > 10%, market cap above an exchange-specific threshold, then rank by trailing 252-day realized volatility and pick the 30 quietest stocks. Equal weight, quarterly rebalancing, 2000 to 2025.
Contents
- Method
- Full Results: All 14 Exchanges
- Three Tiers of Performance
- Tier 1: Strong Outperformance (6 exchanges)
- Tier 2: Moderate Outperformance (5 exchanges)
- Tier 3: Underperformers (3 exchanges)
- Down Capture: The Real Story
- Where the Anomaly Is Strongest
- Limitations
- Dedicated Blogs in This Series
- Run It Yourself
- Takeaway
- References
This time, we compared each exchange to its own local benchmark. Sensex for India, Nikkei for Japan, FTSE 100 for the UK, and so on. The result: 12 of 14 exchanges beat their local market. India adds +5.8% excess over the Sensex. China posts the largest margin, +7.1% over the SSE Composite. Sweden, the UK, Hong Kong, and Canada all clear +4.6% or more. The only two markets where the strategy falls short are the US (-1.5% vs the S&P 500) and Germany (-0.4% vs the DAX). The CAGR spread between the best and worst exchanges is still 14.0 percentage points.
Data: FMP financial data warehouse, 2000–2025. Updated March 2026.
Method
Data source: Ceta Research (FMP financial data warehouse, 70K+ global stocks) Universe: All listed stocks on each exchange with market cap above exchange-specific threshold Period: January 2000 to March 2025 (25.8 years, 103 quarterly periods) Rebalancing: Quarterly (January, April, July, October) Benchmark: Local index for each exchange (Sensex for India, Nikkei 225 for Japan, FTSE 100 for UK, S&P 500 for US, etc.). Saudi Arabia falls back to S&P 500 because FMP has no local Saudi index. Cash rule: Portfolio holds cash if fewer than 10 stocks qualify Transaction costs: Size-tiered model (0.1% for large caps, 0.3% for mid caps, 0.5% for small caps) Data quality guards: 45-day lag on annual filings, minimum 200 trading days for vol computation, max single return capped at 200%, penny stocks excluded
Signal filters (identical across all 14 exchanges):
| Filter | Threshold |
|---|---|
| Return on equity | > 10% |
| Operating profit margin | > 10% |
| Market cap | > exchange-specific threshold |
| 252-day realized volatility | Rank ASC, top 30 |
| Minimum trading days | >= 200 |
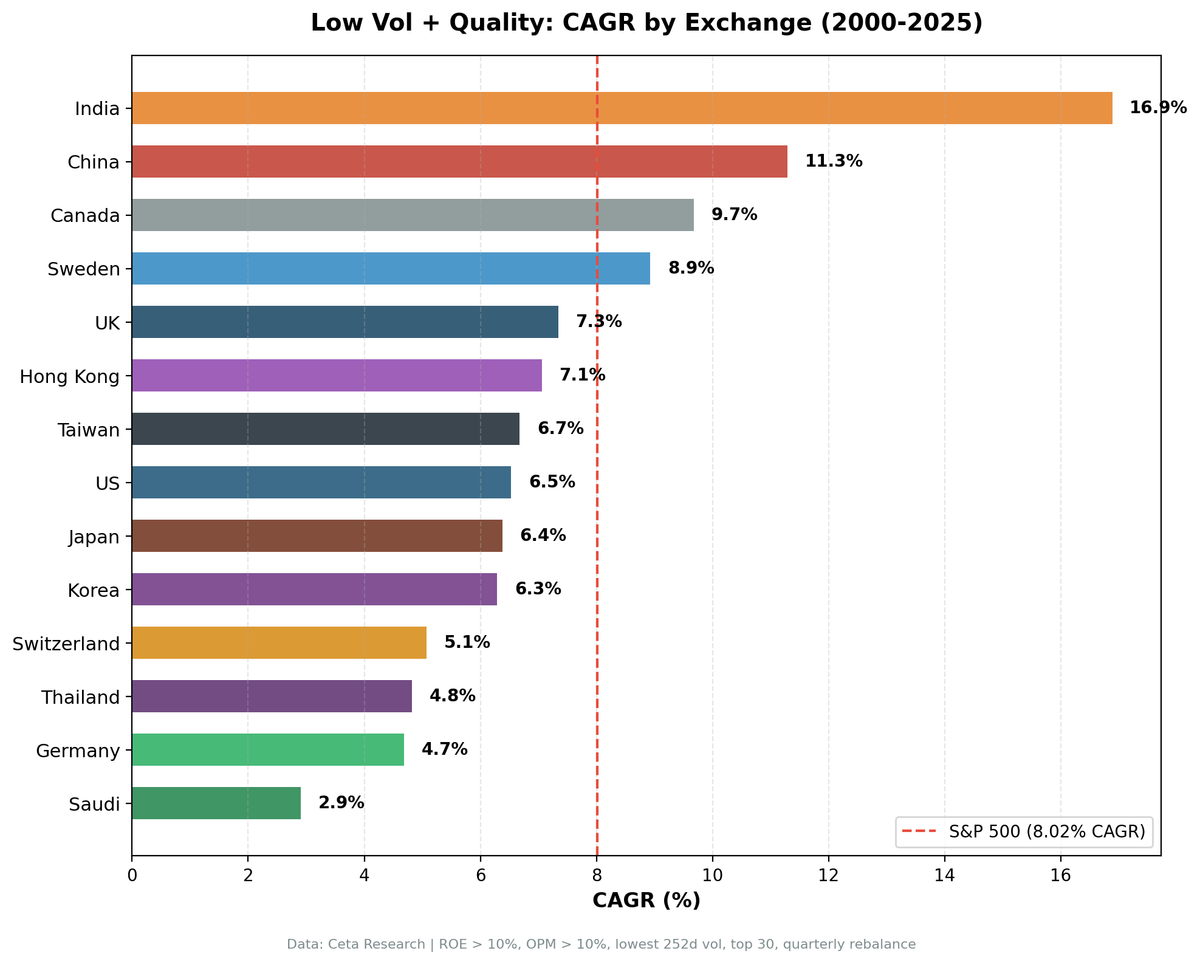
Full Results: All 14 Exchanges
| Exchange | CAGR | Local Bench | Bench CAGR | Excess vs Local Bench | Sharpe | Max DD | Vol | Down Cap | Cash% | Avg Stocks |
|---|---|---|---|---|---|---|---|---|---|---|
| India (NSE) | 16.9% | Sensex | 11.1% | +5.8% | 0.579 | -37.7% | 18.0% | 37.1% | 17% | 29.9 |
| China (SHZ+SHH) | 11.3% | SSE Composite | 4.2% | +7.1% | 0.341 | -51.6% | 25.8% | 49.9% | 0% | 28.8 |
| Canada (TSX) | 9.7% | TSX Composite | 5.1% | +4.6% | 0.645 | -29.7% | 11.1% | 39.2% | 0% | 29.5 |
| Sweden (STO) | 8.9% | OMX Stockholm 30 | 3.2% | +5.8% | 0.422 | -48.5% | 16.4% | 52.0% | 17% | 28.2 |
| UK (LSE) | 7.3% | FTSE 100 | 1.4% | +6.0% | 0.339 | -22.6% | 11.3% | 42.8% | 0% | 29.3 |
| Hong Kong (HKSE) | 7.1% | Hang Seng | 1.8% | +5.3% | 0.244 | -39.4% | 16.6% | 46.1% | 4% | 27.4 |
| Taiwan (TAI) | 6.7% | TAIEX | 4.4% | +2.3% | 0.424 | -42.6% | 13.4% | 29.1% | 20% | 28.3 |
| US (NYSE+NAS+AMEX) | 6.5% | S&P 500 | 8.0% | -1.5% | 0.484 | -26.0% | 9.4% | 27.5% | 0% | 29.7 |
| Japan (JPX) | 6.4% | Nikkei 225 | 3.4% | +3.0% | 0.398 | -42.2% | 15.8% | 43.2% | 14% | 28.9 |
| Korea (KSC) | 6.3% | KOSPI | 4.8% | +1.5% | 0.254 | -32.2% | 13.0% | 27.2% | 28% | 29.0 |
| Switzerland (SIX) | 5.1% | SMI | 2.1% | +3.0% | 0.342 | -46.6% | 13.3% | 62.0% | 6% | 26.4 |
| Thailand (SET) | 4.8% | SET Index | 3.8% | +1.1% | 0.136 | -46.7% | 17.1% | 56.3% | 17% | 29.1 |
| Germany (XETRA) | 4.7% | DAX | 5.1% | -0.4% | 0.207 | -41.6% | 13.0% | 32.4% | 1% | 28.1 |
| Saudi (SAU) | 2.9% | S&P 500* | 8.0% | -5.1% | -0.033 | -50.7% | 17.9% | 28.0% | 28% | 27.1 |
*Saudi Arabia has no local index in FMP. Falls back to S&P 500 as benchmark.
Three Tiers of Performance
The 14 exchanges split cleanly into three tiers when measured against their own local benchmarks.
Tier 1: Strong Outperformance (6 exchanges)
These markets beat their local benchmark by more than 4 percentage points annually.
China (SHZ+SHH): +7.1% excess over SSE Composite, 0.341 Sharpe. The largest excess return in the study. 11.3% CAGR vs the SSE Composite's 4.2%. But it comes with the highest volatility (25.8%) and a -51.6% max drawdown. China's low-vol quality stocks beat the local market convincingly on return, but didn't deliver the risk reduction you'd expect from a low-vol strategy. The A-share market's retail-driven dynamics mean even "low-vol" Chinese stocks are volatile by global standards.
Sweden (STO): +5.8% excess over OMX Stockholm 30, 0.422 Sharpe. A strong result against a weak local benchmark (3.2% CAGR). The 52.0% down capture is high, meaning Swedish low-vol stocks still fall with the market in downturns. The alpha comes from the up side. The 17% cash rate and -48.5% max drawdown show the strategy struggles with downside protection here, but the absolute outperformance is undeniable.
India (NSE): +5.8% excess over Sensex, 0.579 Sharpe. 16.9% CAGR vs the Sensex's 11.1%. India leads on Sharpe (0.579) and the 37.1% down capture is solid. India's deep, broad equity market with thousands of listed companies provides a rich quality universe. The domestic consumption economy generates stable earnings for non-cyclical businesses. Full analysis: Low Volatility Quality India.
Hong Kong (HKSE): +5.3% excess over Hang Seng, 0.244 Sharpe. The Hang Seng returned just 1.8% CAGR over 25 years. The strategy's 7.1% easily clears that bar. Down capture of 46.1% is middling. Hong Kong's property and financial sector concentration limits the defensive benefit, but relative to a stagnant local market, the strategy adds real value.
UK (LSE): +6.0% excess over FTSE 100, 0.339 Sharpe. The FTSE 100's 1.4% CAGR over this period is dismal. The strategy's 7.3% isn't spectacular in absolute terms, but it more than quadruples the local benchmark. Down capture of 42.8% provides moderate protection. The UK's low-vol quality universe is dominated by consumer staples and utilities, which is stable but not explosive.
Canada (TSX): +4.6% excess over TSX Composite, 0.645 Sharpe. The best risk-adjusted result in the entire study. 0.645 Sharpe, zero cash periods, 29.5 average stocks, and only 11.1% annualized volatility. Canada's resource-heavy economy might seem hostile to a quality filter, but the TSX has a solid cluster of financials, telecoms, and utilities that pass both quality and low-vol screens consistently.
Tier 2: Moderate Outperformance (5 exchanges)
These markets beat their local benchmark by 1 to 4 percentage points.
Switzerland (SIX): +3.0% excess over SMI, 0.342 Sharpe. The SMI returned only 2.1% CAGR. Switzerland's small listed universe (26.4 average stocks, the lowest in the study) constrains the strategy, but 5.1% CAGR still comfortably clears the local bar. The 62.0% down capture is the highest in the study.
Japan (JPX): +3.0% excess over Nikkei 225, 0.398 Sharpe. Japan's low-vol quality portfolio had 14% cash periods and a -42.2% max drawdown. The 43.2% down capture means the strategy absorbs less than half the market's downside. Against the Nikkei's modest 3.4% CAGR, the 6.4% return looks respectable.
Taiwan (TAI): +2.3% excess over TAIEX, 0.424 Sharpe. The strategy finds Taiwan's non-semiconductor companies and delivers genuine risk reduction in a tech-heavy market. Down capture of 29.1% is strong. The 20% cash rate drags absolute CAGR, but the risk-adjusted numbers are solid. Full analysis: Low Volatility Quality Taiwan.
Korea (KSC): +1.5% excess over KOSPI, 0.254 Sharpe. The 28% cash rate is the joint-highest in the study (tied with Saudi). Korea's chaebol-dominated market structure means many large companies don't pass quality screens. Still, 6.3% beats the KOSPI's 4.8%.
Thailand (SET): +1.1% excess over SET Index, 0.136 Sharpe. High volatility (17.1%), deep drawdown (-46.7%), and weak risk-adjusted returns. The strategy barely edges the SET Index's 3.8% CAGR. The 17% cash rate suggests the quality universe is thin.
Tier 3: Underperformers (3 exchanges)
Germany (XETRA): -0.4% vs DAX, 0.207 Sharpe. The weakest developed-market Sharpe. Germany's industrial economy doesn't produce many low-vol quality names. The DAX's 5.1% CAGR is a tougher benchmark than most European indices, and the strategy falls just short.
US (NYSE+NAS+AMEX): -1.5% vs S&P 500, 0.484 Sharpe. The S&P 500's 8.0% CAGR is the toughest benchmark in the study. The US portfolio's 6.5% trails on absolute return, but 0.484 Sharpe, -26.0% max drawdown (vs -43.9% for SPY), and 27.5% down capture show the strategy still delivers on its core promise of risk reduction. The US is the clearest example of the low-vol trade-off: give up absolute return, get better risk-adjusted performance. Full analysis: Low Volatility Quality US.
Saudi (SAU): -5.1% vs S&P 500*, 0.033 negative Sharpe. The worst result in the study. A negative Sharpe means the portfolio didn't even beat the risk-free rate. The 28% cash rate and -50.7% max drawdown confirm this market is hostile to the strategy. Saudi's exchange is relatively young, banking-heavy, and has limited company diversity. Note: Saudi falls back to S&P 500 because no local index is available in FMP.
Down Capture: The Real Story
Low-vol quality is a risk-reduction strategy. The primary metric isn't CAGR. It's how much of the local market's downside the portfolio absorbs. Down capture tells that story, measured against each exchange's local benchmark.
| Exchange | Down Capture | Assessment |
|---|---|---|
| Korea (KSC) | 27.2% | Strong |
| US (NYSE+NAS+AMEX) | 27.5% | Strong |
| Saudi (SAU) | 28.0% | Strong |
| Taiwan (TAI) | 29.1% | Strong |
| Germany (XETRA) | 32.4% | Strong |
| India (NSE) | 37.1% | Moderate |
| Canada (TSX) | 39.2% | Moderate |
| UK (LSE) | 42.8% | Moderate |
| Japan (JPX) | 43.2% | Moderate |
| Hong Kong (HKSE) | 46.1% | Moderate |
| China (SHZ+SHH) | 49.9% | Weak |
| Sweden (STO) | 52.0% | Weak |
| Thailand (SET) | 56.3% | Weak |
| Switzerland (SIX) | 62.0% | Weak |
Taiwan's 29.1% is genuinely strong. For every 10% the TAIEX fell, the Taiwanese low-vol quality portfolio dropped 2.9%. The US (27.5%) and India (37.1%) also show real downside insulation relative to their own benchmarks. Korea (27.2%) and Saudi (28.0%) post the lowest readings, but those partly reflect their 28% cash rates: a portfolio sitting in cash misses down quarters, which flatters the metric more than pure defensiveness would.
Switzerland's 62.0% is the weakest in the study. Thailand (56.3%) and Sweden (52.0%) are also poor. In these markets, the low-vol label doesn't translate into strong crash protection against local drawdowns.
The pattern holds: markets with deep, diversified quality universes produce good down capture. Markets where the quality universe is concentrated in cyclical sectors (Sweden's industrials, Switzerland's financials) provide weaker protection. With the full run, all 14 exchanges now have enough local-benchmark drawdown data for this calculation.
Where the Anomaly Is Strongest
The low-vol anomaly persists because of structural forces: benchmark-hugging fund managers avoid low-beta stocks, leverage-constrained investors overpay for high-beta stocks, and speculators bid up volatile names. These forces should operate globally. With local benchmarks, the data confirms they do. 12 of 14 exchanges show positive excess returns.
Strongest: markets where local benchmarks are weak. China (+7.1%), the UK (+6.0%), Sweden (+5.8%), India (+5.8%), and Hong Kong (+5.3%) all clear 5 percentage points of excess. These are markets where the broad index has delivered mediocre long-term returns (Hang Seng 1.8%, FTSE 100 1.4%, SSE Composite 4.2%). A quality filter with low-vol ranking easily outpaces these benchmarks.
Strong: developed markets with non-cyclical quality clusters. Canada (+4.6%, 0.645 Sharpe) is the best risk-adjusted result in the study. Switzerland (+3.0%) and Japan (+3.0%) also clear their local benchmarks comfortably. Their markets have enough telecoms, utilities, healthcare, and consumer staples companies to populate a low-vol quality portfolio consistently.
Marginal: thin or immature markets. Korea (+1.5%) and Thailand (+1.1%) show positive but slim excess. High cash rates (28% and 17%) dilute returns. The quality universe is thin, and the strategy barely edges the local index.
Underperformers: tough benchmarks. The US (-1.5%) and Germany (-0.4%) are the only two markets with negative excess. The S&P 500's 8.0% CAGR is the hardest benchmark in the study. The DAX's 5.1% is also above average. In both cases, the local index is strong enough that a 30-stock low-vol portfolio can't keep up on absolute return. The US strategy still delivers on risk reduction (27.5% down capture, -26.0% max drawdown vs -43.9% for SPY), which is the strategy's actual purpose. Saudi (-5.1%) also underperforms, but its benchmark is SPY by default due to data limitations.
Limitations
Currency effects. Both strategy returns and local benchmarks are in local currency, so the comparison is apples-to-apples within each market. However, a USD-based investor holding Indian or Chinese stocks would experience currency effects that aren't reflected here.
Survivorship bias. FMP's historical coverage may undercount delisted companies, particularly for exchanges with thinner data pipelines (SET, SAU, early NSE data). This could overstate results for some markets.
Transaction costs. Modeled with a simple size-tiered approach. Actual costs in less liquid markets (SET, SAU, KSC) could be materially higher, especially for small-cap positions.
Cash periods distort CAGR. Markets with high cash rates (Korea 28%, Saudi 28%, Taiwan 20%) have lower effective invested periods. Their CAGRs blend invested and cash returns. An investor deploying capital elsewhere during cash periods could achieve different results.
Saudi benchmark fallback. Saudi Arabia has no local index available in FMP. Its benchmark falls back to the S&P 500, making its excess return (-5.1%) not directly comparable to the other 13 exchanges that use local indices.
Down capture and cash rates. Markets with high cash rates (Korea and Saudi at 28%) post artificially low down capture, because a portfolio sitting in cash sits out down quarters. Their readings overstate the strategy's defensiveness relative to markets that stayed fully invested.
Market cap thresholds vary. Each exchange uses a locally calibrated threshold (e.g., $1B USD for US, NT$10B for Taiwan, INR 50B for India). These are set to exclude micro-caps and penny stocks, but different thresholds could produce different results.
Dedicated Blogs in This Series
- Low Volatility Quality: US Stocks (6.5% CAGR, 0.484 Sharpe)
- Low Volatility Quality: India (16.9% CAGR, 0.579 Sharpe)
- Low Volatility Quality: Taiwan (6.7% CAGR, 0.424 Sharpe)
Run It Yourself
Global backtest (all 14 exchanges):
python3 low-vol-quality/backtest.py --global --output results/exchange_comparison.json --verbose
Single exchange:
python3 low-vol-quality/backtest.py --preset india --output results/returns_NSE.json --verbose
Code: github.com/ceta-research/backtests/tree/main/low-vol-quality
Takeaway
Low-vol quality beats its local benchmark in 12 of 14 exchanges. That's the headline. When measured against their own markets instead of the S&P 500, the strategy works almost everywhere.
Canada delivers the best risk-adjusted result (0.645 Sharpe) with zero cash periods. India leads on absolute return (16.9% CAGR). China produces the largest excess return (+7.1% over SSE Composite), though at the highest volatility in the study. The US and Germany are the only markets where the strategy trails its local index, and in both cases the benchmark is unusually strong.
Down capture remains the diagnostic metric for a low-vol strategy. Taiwan (29.1%), the US (27.5%), and India (37.1%) show the strategy absorbing less than 40% of local market downside. That's genuine risk reduction.
The forces behind the anomaly, benchmark constraints, leverage limits, speculative preference for volatile stocks, are structural and global. Local benchmarks confirm they operate in nearly every market we tested.
References
- Baker, M., Bradley, B. & Wurgler, J. (2011). "Benchmarks as Limits to Arbitrage: Understanding the Low-Volatility Anomaly." Financial Analysts Journal, 67(1), 40-54.
- Ang, A., Hodrick, R., Xing, Y. & Zhang, X. (2006). "The Cross-Section of Volatility and Expected Returns." Journal of Finance, 61(1), 259-299.
- Frazzini, A. & Pedersen, L. (2014). "Betting Against Beta." Journal of Financial Economics, 111(1), 1-25.
- Novy-Marx, R. (2013). "The Other Side of Value: The Gross Profitability Premium." Journal of Financial Economics, 108(1), 1-28.
Data: Ceta Research, 2000-2025. Full methodology: Methodology
Past performance does not guarantee future results. This is educational content, not investment advice.


