
Magic Formula on Brazilian Stocks: 19.67% CAGR Over 25 Years of B3 Data
The Magic Formula returned 19.67% annually on B3-listed Brazilian stocks from 2000 to 2025. That's 10.72% annual excess return over the Bovespa. Only 1 cash period out of 103.

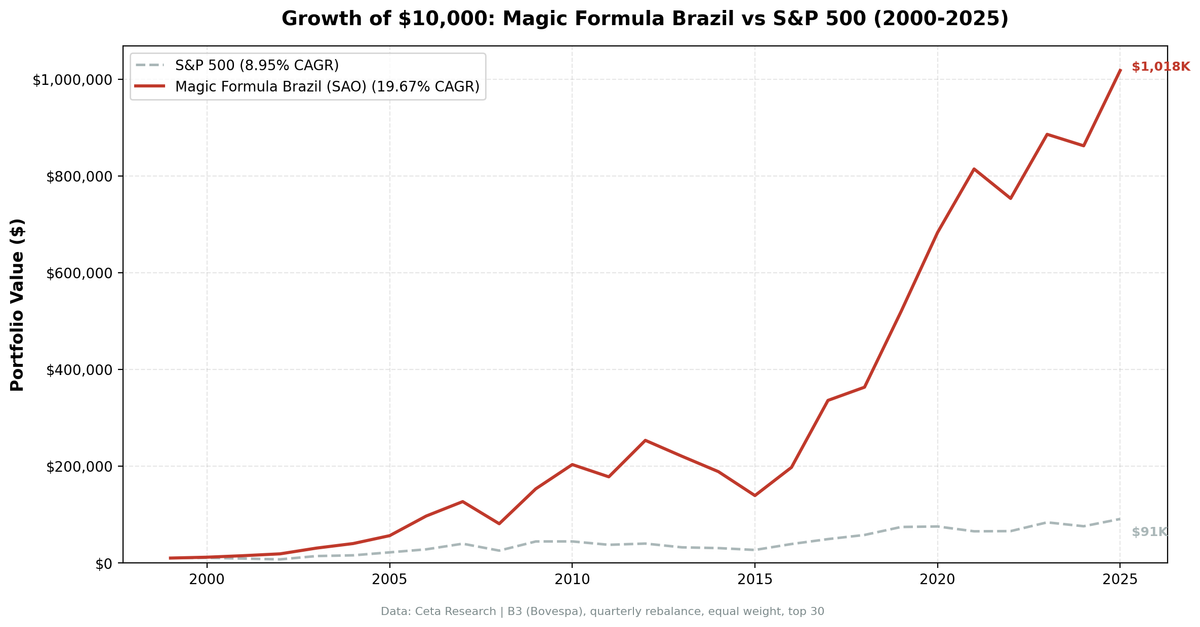
The Magic Formula returned 19.67% annually on B3-listed Brazilian stocks from 2000 to 2025. $10,000 became $1,018,100. The Bovespa index returned 8.95% over the same period. That's 10.72% annual excess return, measured in the same currency (BRL). The strategy was invested in 102 of 103 quarterly periods, meaning it found enough qualifying cheap, high-quality Brazilian companies almost every single quarter for 25 years.
Contents
- Method
- The Screen (SQL)
- What We Found
- 19.67% CAGR. 10,081% total return. Almost zero cash drag.
- Year-by-Year Returns
- Key Observations
- 2000-2006: Strong early alpha
- 2008: The crash was survivable
- 2013-2015: The Dilma recession
- 2016-2020: The recovery trade
- 2024: Recent weakness
- Currency Note
- Cash Drag: Almost None
- Why Brazil Works for the Magic Formula
- Limitations
- Takeaway
- Part of a Series
- Run This Screen Yourself
Data: FMP financial data warehouse, 2000–2025. Updated March 2026.
Method
Signal: Rank all qualifying stocks by Earnings Yield (EBIT/EV, highest = rank 1) + Return on Capital Employed (EBIT/Capital Employed, highest = rank 1). Buy the top 30 by lowest combined rank. Universe: B3 (Bovespa/SAO), market cap > R$1B (~$200M USD) Period: 2000-2025 (25.8 years, 103 quarterly periods) Rebalancing: Quarterly (January, April, July, October), equal weight Transaction costs: Size-tiered (0.1% for >$10B, 0.3% for $2-10B, 0.5% for <$2B, one-way) Benchmark: Bovespa (^BVSP, BRL) Execution: Next-day close (MOC) Cash rule: Hold cash if fewer than 10 stocks qualify Sector exclusion: Financial Services, Utilities
For the full methodology, see the main US Magic Formula post.
The Screen (SQL)
WITH base AS (
    SELECT
        k.symbol,
        p.companyName,
        p.exchange,
        p.sector,
        k.earningsYieldTTM as earnings_yield,
        k.returnOnCapitalEmployedTTM as roce,
        k.marketCap / 1e9 as market_cap_billions
    FROM key_metrics_ttm k
    JOIN profile p ON k.symbol = p.symbol
    WHERE k.earningsYieldTTM > 0
      AND k.returnOnCapitalEmployedTTM > 0
      AND k.marketCap > 1000000000  -- R$1B (~$200M USD)
      AND p.sector NOT IN ('Financial Services', 'Utilities')
      AND p.exchange = 'SAO'
),
ranked AS (
    SELECT *,
        RANK() OVER (ORDER BY earnings_yield DESC) AS ey_rank,
        RANK() OVER (ORDER BY roce DESC) AS roce_rank
    FROM base
)
SELECT symbol, companyName, exchange, sector,
       ROUND(earnings_yield * 100, 2) as ey_pct,
       ROUND(roce * 100, 2) as roce_pct,
       ey_rank, roce_rank,
       (ey_rank + roce_rank) as combined_rank,
       ROUND(market_cap_billions, 1) as mcap_bn
FROM ranked
ORDER BY combined_rank ASC
LIMIT 30
Run this query on Ceta Research
What We Found
19.67% CAGR. 10,081% total return. Almost zero cash drag.
| Metric | Magic Formula (BRL) | Bovespa (BRL) |
|---|---|---|
| CAGR | 19.67% | 8.95% |
| Total Return | 10,081% | - |
| Volatility | 26.70% | - |
| Max Drawdown | -45.06% | -47.10% |
| Sharpe Ratio | 0.343 | - |
| Sortino Ratio | 0.599 | - |
| Win Rate (quarterly) | 58.3% | - |
| Avg Stocks per Period | 21.8 | - |
| Cash Periods | 1 / 103 | - |
| Beta | 0.761 | - |
| Alpha (annualized) | 10.35% | - |
The numbers that stand out: only 1 cash period in 103 quarters. Brazil's B3 consistently produced enough cheap, capital-efficient companies to fill the portfolio. India had zero cash periods, so this isn't unique to Brazil, but compare it to Indonesia (21 of 103 in cash) or Korea (21 of 103). Deep, liquid markets let the formula stay fully invested.
The max drawdown of -45.06% is shallower than the Bovespa's -47.10%. The beta of 0.761 tells the story: the portfolio captured less of the market's downside moves. It participated in the rallies but dodged the worst of the crashes.
Year-by-Year Returns
| Year | Magic Formula (BRL) | Bovespa (BRL) | Excess |
|---|---|---|---|
| 2000 | +18.0% | +4.7% | +13.3% |
| 2001 | +26.7% | -14.1% | +40.8% |
| 2002 | +25.2% | -18.7% | +43.9% |
| 2003 | +63.7% | +93.5% | -29.8% |
| 2004 | +30.6% | +10.7% | +19.9% |
| 2005 | +40.8% | +39.0% | +1.8% |
| 2006 | +72.0% | +28.7% | +43.3% |
| 2007 | +30.8% | +41.5% | -10.7% |
| 2008 | -36.1% | -36.0% | -0.1% |
| 2009 | +89.2% | +74.5% | +14.7% |
| 2010 | +32.8% | +0.1% | +32.7% |
| 2011 | -12.5% | -15.7% | +3.2% |
| 2012 | +42.4% | +6.8% | +35.6% |
| 2013 | -13.0% | -19.5% | +6.5% |
| 2014 | -14.4% | -4.8% | -9.6% |
| 2015 | -26.2% | -12.6% | -13.6% |
| 2016 | +41.9% | +45.7% | -3.8% |
| 2017 | +70.1% | +26.2% | +43.9% |
| 2018 | +8.1% | +17.4% | -9.3% |
| 2019 | +43.0% | +28.6% | +14.4% |
| 2020 | +31.5% | +1.4% | +30.1% |
| 2021 | +19.2% | -13.3% | +32.5% |
| 2022 | -7.5% | +0.6% | -8.1% |
| 2023 | +17.6% | +27.5% | -9.9% |
| 2024 | -2.7% | -9.6% | +6.9% |
| 2025 | +18.1% | +19.8% | -1.7% |
Key Observations
2000-2006: Strong early alpha
The Magic Formula beat the Bovespa in most years from 2000 through 2006. The early 2000s were especially strong. While the Bovespa fell in 2001 (-14.1%) and 2002 (-18.7%), the Magic Formula posted positive returns: +26.7% and +25.2%. The commodity boom that followed supercharged results. 2006 was the peak: +72.0% vs the Bovespa's +28.7%. Brazil's resource-heavy economy was exporting iron ore, soybeans, and oil at record prices. The Magic Formula's sector exclusion (no financials, no utilities) meant the portfolio was loaded with industrial, consumer, and materials companies riding the commodity wave.
2008: The crash was survivable
The portfolio dropped 36.1%. The Bovespa dropped 36.0%. Essentially identical. Then came the recovery: +89.2% in 2009, the best single year in the entire backtest, vs the Bovespa's +74.5%. Cheap, capital-efficient Brazilian companies snapped back harder than the broad market.
2013-2015: The Dilma recession
Three consecutive losing years: -13.0%, -14.4%, -26.2%. This was the worst stretch in the backtest. Brazil's economy contracted under President Dilma Rousseff. GDP fell, the Real collapsed, and corporate earnings dried up. The Bovespa also fell in all three years (-19.5%, -4.8%, -12.6%), but the Magic Formula underperformed in 2014 and 2015. The formula couldn't avoid the damage because the problem wasn't stock selection. It was the entire economy. Inflation spiked above 10%, interest rates hit 14.25%, and the country lost its investment-grade credit rating.
This is honest accounting. The strategy lost cumulative ground for three years. Investors who didn't understand the macro would have abandoned it.
2016-2020: The recovery trade
The impeachment of Dilma in 2016 kicked off a massive rally. Magic Formula returned +41.9% in 2016, +70.1% in 2017, and +43.0% in 2019. The new government's reform agenda (pension reform, labor reform) re-priced Brazilian equities. Companies that had survived the recession with strong ROCE and reasonable valuations were exactly what the market bought. The Magic Formula was positioned perfectly, beating the Bovespa by +43.9% in 2017.
This five-year stretch is the strongest argument for the strategy. It proves the signal works in both directions. Companies that score well on quality and value get punished during macro downturns, then recover disproportionately when conditions normalize.
2024: Recent weakness
The strategy returned -2.7%, while the Bovespa fell -9.6%. The Magic Formula actually outperformed during a tough year for Brazilian equities. Brazil's high interest rate environment (Selic at 13.75%) and fiscal concerns weighed on the market. 2025 has continued the positive trend with +18.1%.
Currency Note
Both the strategy returns and the benchmark (Bovespa) are denominated in Brazilian Reais. The 10.72% excess return is a same-currency comparison, no adjustment needed. This is a cleaner measurement than comparing BRL returns against a USD benchmark.
For a US-based investor, both the strategy and the Bovespa would be reduced by the same currency drag (~4.5% annually over this period, as the BRL/USD rate moved from roughly 1.80 to 5.80). The excess return stays the same regardless of which currency you measure it in.
For a BRL-denominated investor (someone living in Brazil, earning in Reais), the full 19.67% CAGR is the relevant number.
Cash Drag: Almost None
One of the most striking features of this backtest is the near-complete absence of cash periods. Only 1 of 103 quarters went to cash. The strategy found at least 10 qualifying stocks in 102 out of 103 periods.
Compare this to other Magic Formula backtests:
| Market | Cash Periods | Total Periods |
|---|---|---|
| Brazil (SAO) | 1 | 103 |
| US (NYSE/NASDAQ/AMEX) | 0 | 103 |
| India (NSE) | 17 | 103 |
| Indonesia (JKT) | 25 | 103 |
| Korea (KSC) | 21 | 103 |
| Saudi Arabia (SAU) | 29 | 103 |
Brazil stayed nearly fully invested (1 cash period). India had 17 on NSE alone (most in the early 2000s when fewer companies cleared the threshold). Indonesia and Korea went to cash 20-25% of the time. Cash drag is a real problem in smaller markets. Every period spent in cash dilutes the CAGR. Brazil's B3 is deep enough to consistently populate the portfolio.
Why Brazil Works for the Magic Formula
Three structural factors explain the strong results.
Commodity exposure. Brazil's economy is heavily tied to commodities: iron ore, soybeans, oil, beef, sugar. Commodity producers tend to have high ROCE during boom periods and cheap valuations during busts. The Magic Formula's ranking system naturally rotates into commodity-adjacent companies at the right time, buying them when earnings yields are high and selling when ROCE fades.
Market inefficiency. B3 has fewer analysts per stock than NYSE or NASDAQ. Small and mid-cap Brazilian companies get less coverage. The Magic Formula's edge comes from systematically finding cheap, high-quality stocks that the market hasn't fully priced. That edge is bigger when fewer people are looking.
Economic cyclicality. Brazil's boom-bust cycles (commodity boom 2003-2007, Dilma recession 2013-2015, reform rally 2016-2020) create wide valuation swings. The Magic Formula's quarterly rebalancing captures mean reversion within these cycles. It buys the beaten-down quality names during busts and rides them through recoveries.
Limitations
BRL volatility. The Real is one of the most volatile freely-traded currencies. A US investor would experience dramatic year-to-year swings from currency alone, separate from equity returns. The excess return vs Bovespa is currency-neutral, but absolute returns in USD would be lower.
Survivorship bias. Exchange membership uses current company profiles. Delisted B3 companies aren't captured retrospectively. Brazil had several large delistings (OGX, Oi) that could affect early-period results.
Market cap threshold. R$1B (~$200M USD at current rates) targets small-to-mid cap companies in the B3 universe. With ~21.8 stocks per period on average, the portfolio is more concentrated than the US version.
Concentration risk. B3 is a smaller exchange than NYSE or NASDAQ. With an average of 21.8 stocks per period, sector concentration can be high. A few large positions in commodities or consumer names can dominate returns in any given quarter.
ROCE vs ROIC. Greenblatt's original formula uses Return on Invested Capital. We use ROCE (Return on Capital Employed), the closest available metric in FMP data. The two are similar but not identical.
Political risk not modeled. The 2013-2015 drawdown was driven by political events (corruption scandals, fiscal mismanagement). No quantitative screen can anticipate these. The backtest assumes you hold through them.
Takeaway
The Magic Formula produced strong, consistent results on Brazilian stocks. 19.67% CAGR over 25 years, 10.72% excess return over the Bovespa, measured in the same currency. The strategy was invested in 102 of 103 quarters, meaning it continuously found cheap, capital-efficient companies on B3.
The results reflect Brazil's structural characteristics: deep commodity exposure, economic cyclicality, and a market with enough companies to fill the portfolio but few enough analysts to leave pricing gaps. The Magic Formula exploits all three.
The 2013-2015 recession is the stress test. Three consecutive losing years. Anyone investing this strategy in Brazil needs to accept that political and macro risk can overwhelm stock selection for extended periods. The recovery, when it came, was powerful: +41.9% in 2016, +70.1% in 2017. But you had to survive the drawdown first.
Part of a Series
This analysis is part of our Magic Formula global exchange comparison: - Magic Formula on US Stocks (NYSE + NASDAQ + AMEX) - 9.26% CAGR, the baseline - Magic Formula on Indian Stocks - 17.14% CAGR on NSE stocks - Magic Formula on Indonesian Stocks - JKT analysis - Magic Formula: Global Comparison - 16-exchange comparison table
Run This Screen Yourself
Via web UI: Run the Magic Formula screen on Ceta Research. Filter by exchange (SAO) and see what passes today.
Via Python:
# Clone the backtest repo
git clone https://github.com/ceta-research/backtests.git
cd backtests

# Run the screen (requires CR_API_KEY)
export CR_API_KEY="your-api-key"
python3 magic-formula/screen.py --exchange SAO

# Run the backtest
python3 magic-formula/backtest.py --exchange SAO --verbose
Get your API key at cetaresearch.com. The full backtest code (Python + DuckDB) is on GitHub.
Data: Ceta Research (FMP financial data warehouse). Universe: B3/Bovespa (SAO), market cap > R$1B (~$200M USD). Quarterly rebalance, equal weight, next-day close (MOC) execution, 2000-2025. Size-tiered transaction costs. Benchmark: Bovespa (^BVSP). Returns in BRL.
Past performance does not guarantee future results. This is educational content, not investment advice.


