
Oversold Quality China: Beats SSE Composite by +3.02% Annually (2000-2025)
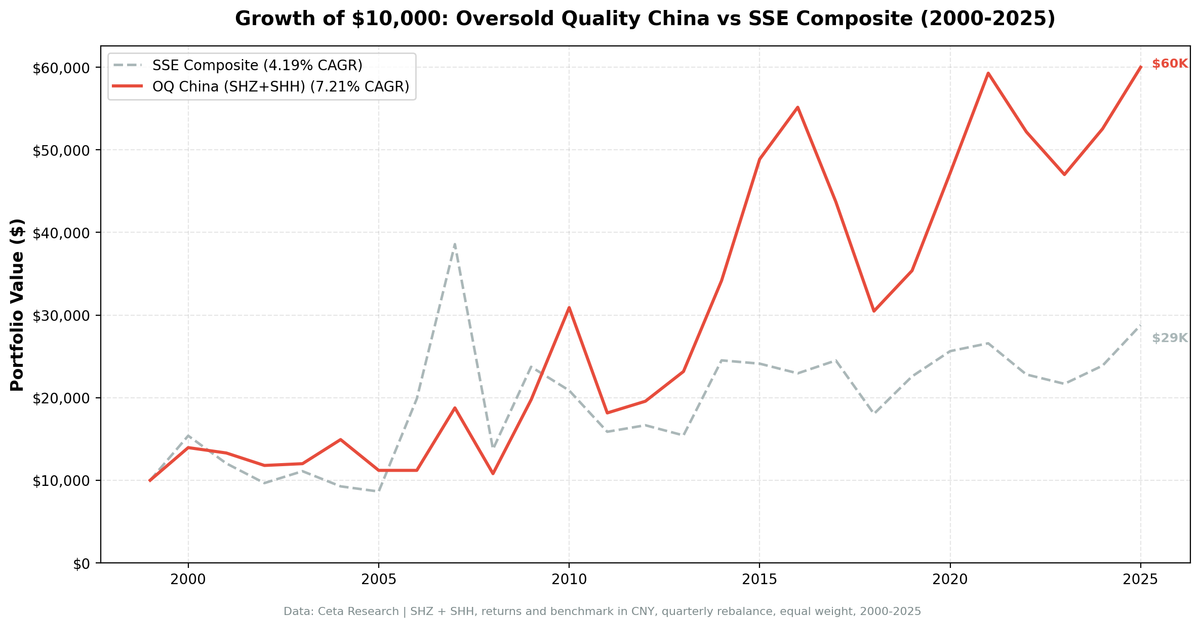
The Oversold Quality strategy on Chinese A-shares (SHZ+SHH) delivered 7.21% CAGR vs 4.19% for the SSE Composite over 25 years. One of the exchanges in our global series where the strategy clearly beats the local benchmark, with strong downside protection.

title: "Oversold Quality China: Beats SSE Composite by +3.02% Annually (2000-2025)" slug: oversold-quality-china-backtest publish_date: 2026-01-24 tags: [backtests, china-markets, quality-investing, RSI, emerging-markets] post_access: public excerpt: "The Oversold Quality strategy on Chinese A-shares (SHZ+SHH) delivered 7.21% CAGR vs 4.19% for the SSE Composite over 25 years. One of the exchanges in our global series where the strategy clearly beats the local benchmark, with strong downside protection." authors: [Swas] feature_image: 1_china_cumulative_growth.png feature_image_alt: "Growth of 10,000: Oversold Quality China vs SSE Composite (2000-2025)" meta_title: "Oversold Quality China Backtest: Piotroski + RSI < 30 (2000-2025)" meta_description: "25-year backtest on Chinese A-shares (SHZ+SHH). 7.21% CAGR vs SSE Composite 4.19%. +3.02% annual excess, 53.4% win rate, 75.7% down-capture. Beats the local benchmark." canonical_url: https://blog.tradingstudio.finance/oversold-quality-china-backtest og_title: "Oversold Quality China: +3.02% Above SSE Composite on A-Shares (2000-2025)" og_description: "Quality filter + RSI oversold on Chinese A-shares beats the SSE Composite by +3.02% annually over 25 years. 53.4% win rate, Sharpe 0.155, 75.7% down-capture." twitter_title: "Oversold Quality China: Beats SSE Composite by +3.02% Annually" twitter_description: "7.21% CAGR on Chinese A-shares vs SSE Composite 4.19%. +3.02% annual excess, 53.4% quarterly win rate. Quality filter + RSI screen adds genuine value on A-shares."
Contents
- The Strategy
- Methodology
- Results
- When It Works
- When It Struggles
- Run It Yourself
- Limitations
- Part of a Series
Data: FMP financial data warehouse, 2000–2025. Updated March 2026.
The Oversold Quality strategy on Chinese A-shares produced 7.21% CAGR over 25 years, compared to 4.19% for the SSE Composite index. That's a +3.02% annual excess return, sustained over 103 quarterly rebalances. China is one of the clearest results in our global series: a strategy that beats its local benchmark and does most of the beating during the market's worst years. The mechanism works because quality A-share companies that get oversold during China's policy-driven volatility cycles tend to recover.
The Strategy
The Oversold Quality strategy combines two independent signals. Both must be true at each quarterly rebalance date for a stock to enter the portfolio.
Piotroski F-Score >= 7 (out of 9): Developed by Joseph Piotroski in a 2000 accounting research paper, the score checks nine binary conditions across three financial dimensions:
- Profitability (4 signals): Return on assets positive, ROA improving year-over-year, operating cash flow positive, accruals negative (meaning cash earnings exceed reported earnings, a sign of earnings quality)
- Leverage and liquidity (3 signals): Debt-to-assets ratio declining, current ratio improving, no new shares issued in the past year
- Operating efficiency (2 signals): Gross margin improving, asset turnover improving
A score of 7 or higher means the company passes at least seven of the nine tests, indicating broad financial improvement across multiple dimensions simultaneously.
RSI-14 < 30: The Relative Strength Index, introduced by J. Welles Wilder (1978), measures price momentum on a 0-100 scale. Values below 30 indicate a stock has fallen faster than its historical norm over the past 14 trading periods. The hypothesis is that fundamentally sound companies at RSI < 30 have been oversold by the market, creating a temporary mispricing.
The portfolio holds the top 30 qualifying stocks by lowest RSI, equally weighted, rebalanced each quarter.
For a full methodology description, see the US flagship blog.
Methodology
- Universe: Shenzhen Stock Exchange (SHZ) and Shanghai Stock Exchange (SHH), A-shares only
- Market cap filter: ¥2B+ (roughly $276M USD-equivalent at current rates)
- Rebalancing: Quarterly (January, April, July, October rebalance dates)
- Execution: Signals computed at the rebalance date, positions filled at the next trading day's close
- Portfolio size: Up to 30 stocks, equal weight. Holds cash if fewer than 5 stocks qualify.
- RSI lookback: 14 trading periods, computed from daily price data
- Transaction costs: Size-tiered model based on market cap at time of trade
- Data period: January 2000 through December 2025 (25.8 years, 103 quarterly periods)
- Cash periods: 22 of 103 quarters (21%). The RSI < 30 condition is moderately restrictive even in China's large A-share universe.
- Benchmark: SSE Composite Index (000001.SS), China's primary broad market index. Using a local-currency benchmark gives a cleaner picture of whether the strategy adds value relative to passive A-share exposure.
- Returns: All results are in CNY. Currency effects between CNY and USD are not reflected.
- Data source: Ceta Research FMP financial data warehouse
Full methodology, including metric definitions and cost modeling, is at backtests/METHODOLOGY.md.
Results
| Metric | Oversold Quality (China) | SSE Composite |
|---|---|---|
| CAGR | 7.21% | 4.19% |
| Total return (25.8yr) | 500.2% | 187.9% |
| Max drawdown | -47.5% | -67.0% |
| Sharpe ratio | 0.155 | 0.060 |
| Volatility (annualized) | 30.28% | — |
| Up capture vs SSE | 96.6% | — |
| Down capture vs SSE | 75.7% | — |
| Win rate vs SSE | 53.4% | — |
| Excess CAGR vs SSE | +3.02% | — |
| Cash periods | 22 of 103 quarters | — |
| Avg stocks (when invested) | 25.0 | — |
A 10,000 yuan investment in January 2000 grew to roughly 60,000 yuan by end of 2025 under this strategy. The same investment in the SSE Composite grew to roughly 28,800 yuan. The strategy more than doubled the index's terminal value while taking less drawdown (-47.5% vs -67.0%).
The +3.02% annual excess over the SSE Composite is the headline. It's sustained over 25 years of volatile A-share cycles. The Piotroski quality filter combined with RSI oversold timing genuinely adds value relative to passive Chinese equity exposure, and the 75.7% down-capture shows where the value comes from: the portfolio fell about three-quarters as much as the index in down quarters.
The 53.4% quarterly win rate vs the SSE confirms this isn't a fluke of one good period. The strategy beats the local benchmark in more than half of all 103 quarters, including during China's sharp bear cycles when the quality filter provides genuine downside protection.
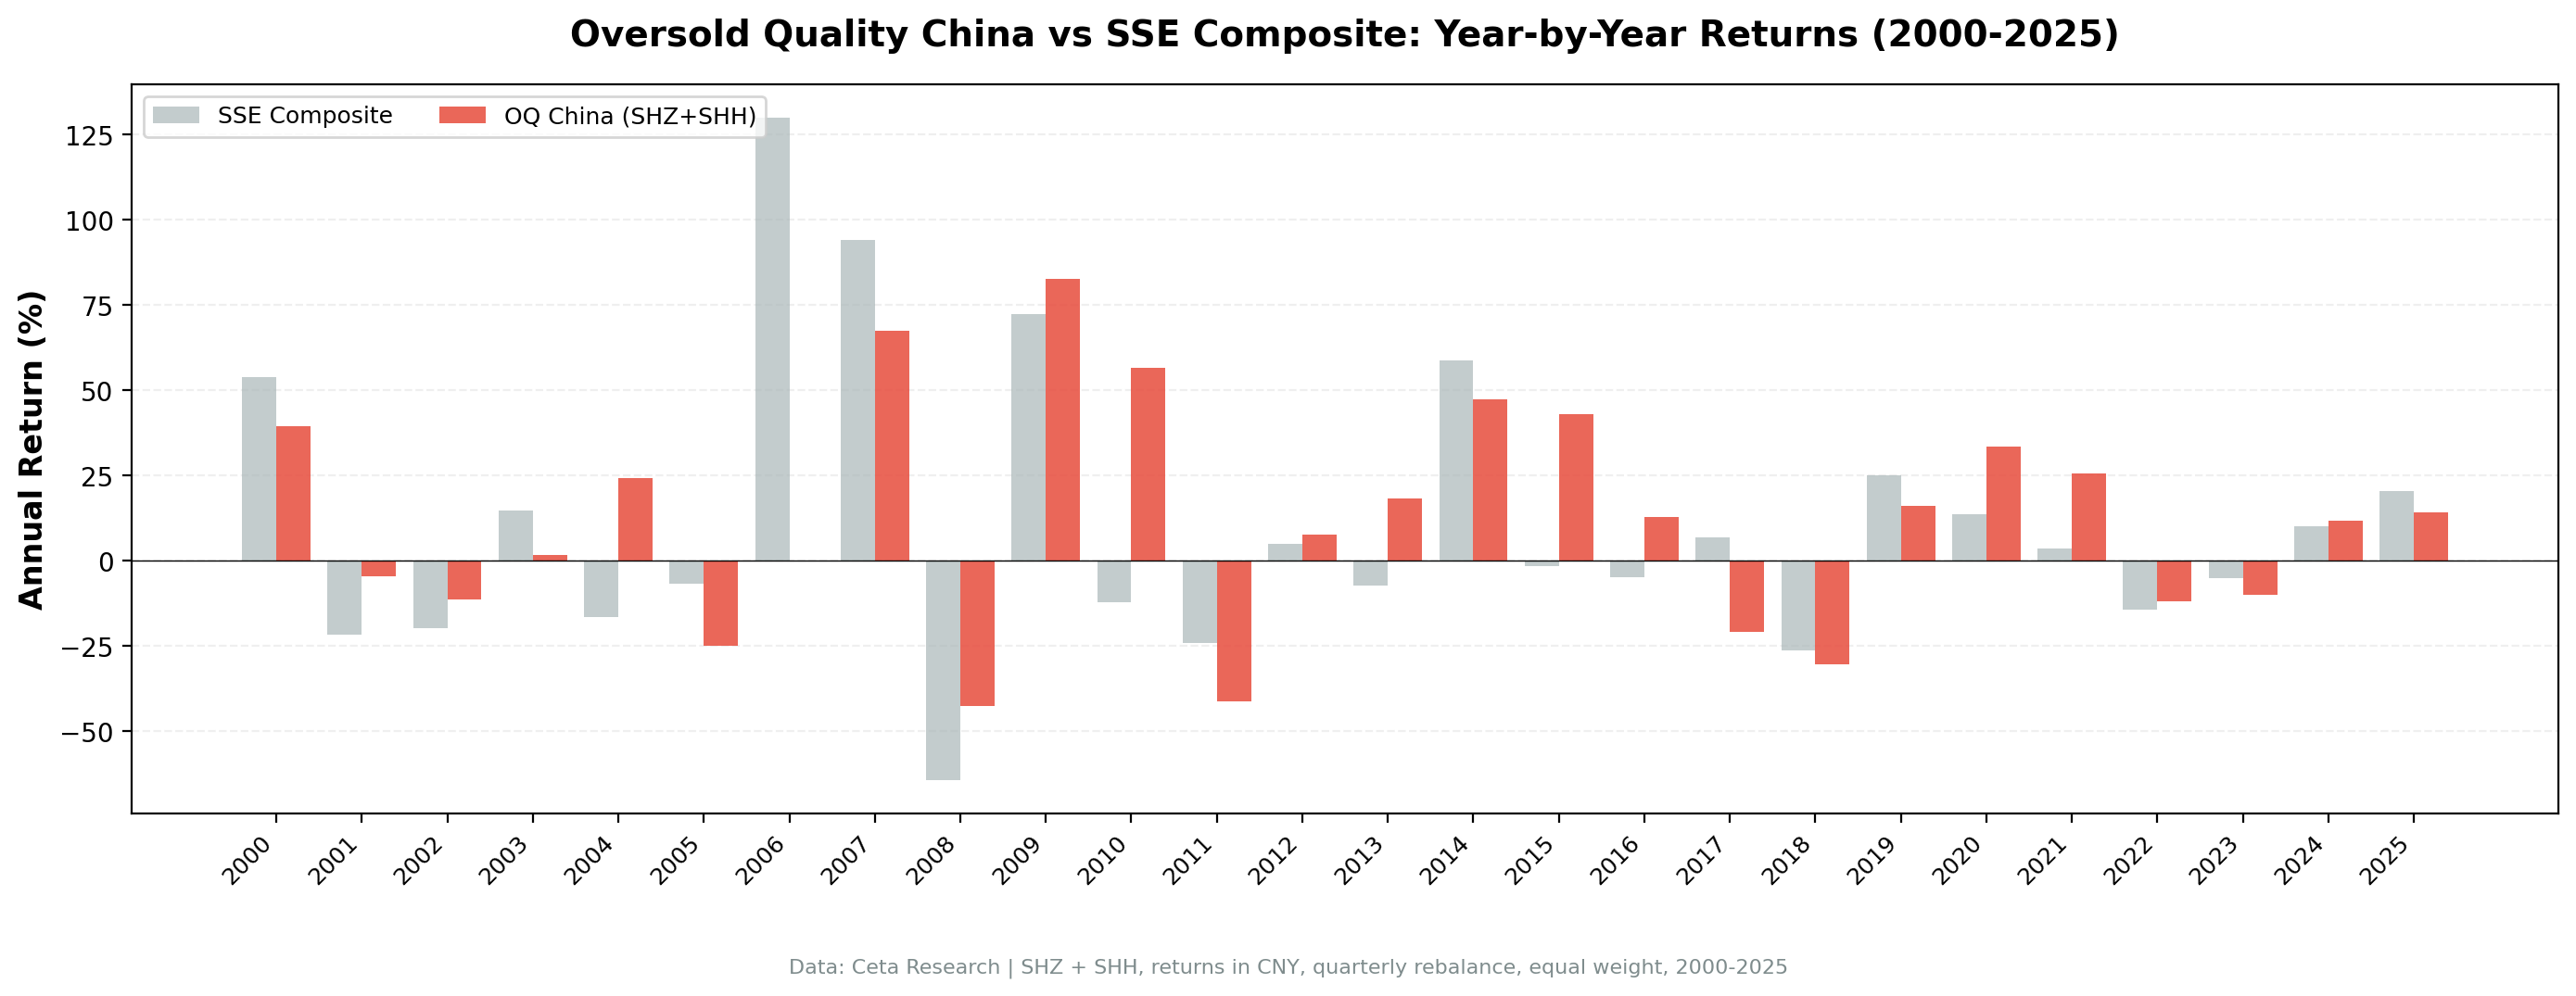
Annual returns:
| Year | Portfolio (CNY) | SSE Composite | Excess |
|---|---|---|---|
| 2000 | +39.56% | +53.92% | -14.36% |
| 2001 | -4.66% | -21.75% | +17.09% |
| 2002 | -11.34% | -19.77% | +8.43% |
| 2003 | +1.81% | +14.88% | -13.08% |
| 2004 | +24.31% | -16.52% | +40.83% |
| 2005 | -24.98% | -6.75% | -18.23% |
| 2006 | 0.00% | +129.96% | -129.96% |
| 2007 | +67.54% | +94.16% | -26.62% |
| 2008 | -42.43% | -64.33% | +21.91% |
| 2009 | +82.71% | +72.47% | +10.24% |
| 2010 | +56.57% | -12.06% | +68.62% |
| 2011 | -41.26% | -23.95% | -17.30% |
| 2012 | +7.80% | +4.96% | +2.84% |
| 2013 | +18.41% | -7.36% | +25.78% |
| 2014 | +47.47% | +58.84% | -11.37% |
| 2015 | +43.02% | -1.62% | +44.64% |
| 2016 | +12.86% | -4.86% | +17.72% |
| 2017 | -20.77% | +6.77% | -27.54% |
| 2018 | -30.26% | -26.37% | -3.89% |
| 2019 | +16.08% | +25.15% | -9.07% |
| 2020 | +33.41% | +13.54% | +19.87% |
| 2021 | +25.61% | +3.69% | +21.92% |
| 2022 | -11.98% | -14.20% | +2.22% |
| 2023 | -9.91% | -4.95% | -4.96% |
| 2024 | +11.77% | +10.14% | +1.63% |
| 2025 | +14.20% | +20.58% | -6.38% |
When It Works
Quality filtering during bear cycles. The 2008 result is instructive: portfolio -42.43% vs SSE -64.33%, a +21.91% excess. When the Chinese market cratered, the quality filter protected meaningfully. Similar protection in 2001 (+17.09% excess vs SSE) and 2002 (+8.43% excess).
China-specific recoveries. 2010 is the clearest example: portfolio +56.57% against SSE -12.06%, a +68.62% excess. In 2013 (portfolio +18.41% vs SSE -7.36%, +25.78% excess) and 2015 (portfolio +43.02% vs SSE -1.62%, +44.64% excess), the strategy bought quality names during oversold periods and held through significant recoveries.
Post-crisis snapback. The portfolio returned -42.43% in 2008, then +82.71% in 2009 and +56.57% in 2010. The bear year was significantly better than the SSE (-64.33%), and the two recovery years were far ahead. The quality filter kept the portfolio in companies that survived and recovered, avoiding the speculative names that drove the SSE's worst losses.
The 2020-2021 cycle. +33.41% in 2020 (+19.87% excess) and +25.61% in 2021 (+21.92% excess). While the SSE drifted, oversold quality A-shares from the COVID selloff recovered strongly.
When It Struggles
Macro-driven crashes without discrimination. The 2011 result (-41.26% vs SSE -23.95%, -17.30% excess) is the clearest example of the strategy failing. Tightening monetary policy drove a broad selloff that hit quality and non-quality stocks alike. The Piotroski filter can't protect against systemic macro risk.
2006 cash miss. The portfolio held 100% cash in 2006, missing the SSE Composite's +129.96% gain. The RSI < 30 filter fired on fewer than 5 names during China's speculative bull run. The strategy correctly identified that conditions weren't right for oversold buying, but in a year the index more than doubled, sitting in cash was the single largest drag in the entire 25-year record.
2017 downcycle. The portfolio returned -20.77% against the SSE's +6.77%, a -27.54% excess. Chinese A-shares were in a domestic policy-driven selloff that the strategy couldn't anticipate. Oversold conditions during this period reflected genuine deterioration, not temporary panic.
High volatility. The 30.28% annualized volatility is nearly double a typical US equity portfolio. Individual A-shares are volatile, and even the quality and oversold filters don't fully dampen that. The Sharpe of 0.155 is positive and ahead of the SSE's 0.060, but the ride is rough.
Run It Yourself
Current screen (live data for China A-shares):
-- Current Oversold Quality Screen (China A-shares)
-- Quality proxy: Piotroski-style TTM filters
SELECT
    k.symbol,
    p.companyName,
    p.exchange,
    ROUND(k.returnOnAssetsTTM * 100, 1) AS roa_pct,
    ROUND(k.returnOnEquityTTM * 100, 1) AS roe_pct,
    ROUND(k.incomeQualityTTM, 2) AS income_quality,
    ROUND(k.currentRatioTTM, 2) AS current_ratio,
    ROUND(k.netDebtToEBITDATTM, 2) AS net_debt_ebitda
FROM key_metrics_ttm k
JOIN profile p ON k.symbol = p.symbol
WHERE k.returnOnAssetsTTM > 0
  AND k.returnOnEquityTTM > 0.10
  AND k.incomeQualityTTM > 1.0
  AND k.currentRatioTTM > 1.0
  AND k.netDebtToEBITDATTM BETWEEN -10 AND 3.0
  AND k.marketCap > 2000000000  -- ¥2B+ (~$276M USD) for China
  AND p.exchange IN ('SHZ', 'SHH')
ORDER BY k.symbol
Run this query on Ceta Research Data Explorer
Note: RSI is computed from daily price data at each quarterly rebalance date and isn't available directly in this quality screen. The SQL above identifies the quality-passing universe; RSI filtering happens in the backtest engine.
Run the full historical backtest:
git clone https://github.com/ceta-research/backtests.git
cd backtests
pip install -r requirements.txt
python3 oversold-quality/backtest.py --preset china --output results.json --verbose
Limitations
Currency: All returns are computed in CNY. A US investor holding Chinese A-shares would experience additional CNY/USD currency volatility. CNY appreciated against USD during parts of the backtest period and depreciated in others. The 7.21% CAGR in CNY translates to a different number in USD depending on the period.
A-share market access: Foreign investors can't freely buy Chinese A-shares directly. Access historically required QFII quotas or Stock Connect programs. This backtest assumes direct access at each quarterly rebalance, which overstates the practical opportunity for most non-Chinese investors.
Data coverage: FMP's coverage of Chinese A-shares, particularly for the 2000-2005 period, may be less complete than US data. Stocks with partial data histories are more likely to be excluded from the backtest universe, which may introduce a mild survivorship effect.
Benchmark: We use the SSE Composite (000001.SS) as the local benchmark. The portfolio beats it by +3.02% annually. A tighter comparison against the CSI 300 (large-cap only) might show a different result since our strategy includes small and mid-cap names.
Data quality: Raw end-of-day A-share data carries occasional bad rows, single-day adjusted-close values that spike and revert. We filter these before computing returns. This matters more for individual stocks than for the index itself.
Volatility: The 30.28% annualized volatility reflects the underlying A-share market, not just the strategy. Investors with low volatility tolerance will find this uncomfortable regardless of the long-term CAGR.
Part of a Series
This is part of our Oversold Quality backtest series, testing the combination of Piotroski F-Score >= 7 and RSI-14 < 30 across global markets.
- Oversold Quality US (flagship methodology): NYSE + NASDAQ + AMEX, 25.8 years. 8.17% CAGR, matches SPY.
- Oversold Quality Germany: XETRA, +2.05% above DAX, best Sharpe in the series (0.308).
- Oversold Quality Global Comparison: 18 exchanges, full results.
Data: Ceta Research (FMP financial data warehouse), January 2000 through December 2025. Returns in CNY. Full methodology: github.com/ceta-research/backtests/blob/main/METHODOLOGY.md.
Academic references: Piotroski, J.D. (2000). "Value Investing: The Use of Historical Financial Statement Information to Separate Winners from Losers." Journal of Accounting Research, 38. Wilder, J.W. (1978). New Concepts in Technical Trading Systems. Trend Research.
Past performance does not guarantee future results. This is educational content, not investment advice.


