NCAV
Graham Net-Nets on the NSE: Boom-Bust Deep Value in India
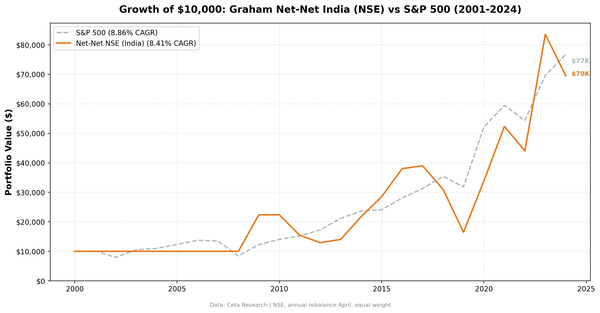
NCAV screen on Indian stocks from 2001 to 2024. 8.28% CAGR with 42% volatility. Recovery years hit +133%, +106%, and +81%. The trade-off is a -57.7% max drawdown.

NCAV
NCAV screen on Indian stocks from 2001 to 2024. 8.28% CAGR with 42% volatility. Recovery years hit +133%, +106%, and +81%. The trade-off is a -57.7% max drawdown.
NCAV
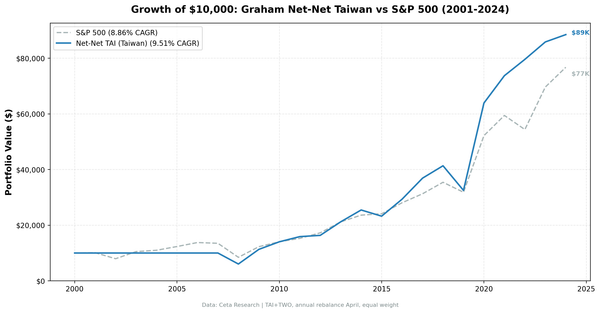
We backtested Graham net-net stocks on Taiwan exchanges from 2001 to 2024. The strategy returned 9.75% CAGR with a Sortino of 0.888, only 12.5% negative periods, and 39% down capture. Taiwan's small manufacturer ecosystem creates ideal conditions for net-net investing.
NCAV
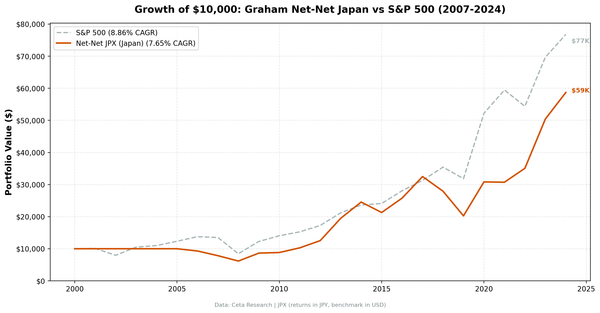
We ran the NCAV screen on Japan from 2007 to 2024. CAGR of 8.85% matched SPY with lower drawdown (-33.7% vs -40.3%) and a Sortino of 1.167. Japan's cash-heavy balance sheets make NCAV a better predictor of liquidation value than in any other developed market.
NCAV
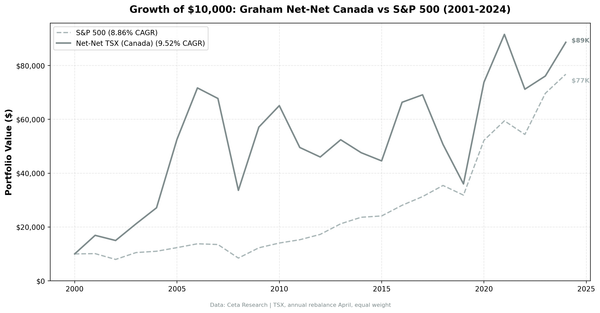
NCAV screen on Canadian stocks from 2001 to 2024. 7.49% CAGR. The only exchange with zero cash years out of 24. Resource-heavy TSX produces net-nets every year, but the ride includes a -55.9% max drawdown.
NCAV
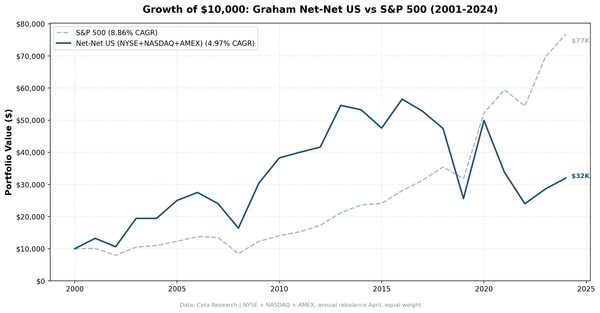
We computed NCAV for every US stock from 2001 to 2024 and bought the ones trading below liquidation value. CAGR was 5.02% vs 8.84% for SPY. The real finding is what NCAV reveals as a balance sheet tool, which current assets matter, and why the formula uses them instead of total assets.
ROIC
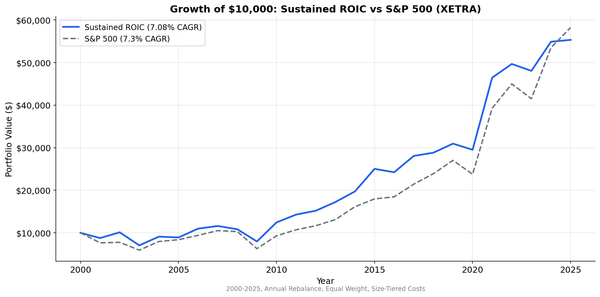
Sustained high ROIC on XETRA stocks from 2000 to 2025. 7.08% CAGR vs 7.30% SPY. No alpha, but the best max drawdown (-31.4%) and lowest volatility (20.37%) of any exchange tested. Quality as risk reducer, not return booster.
ROIC
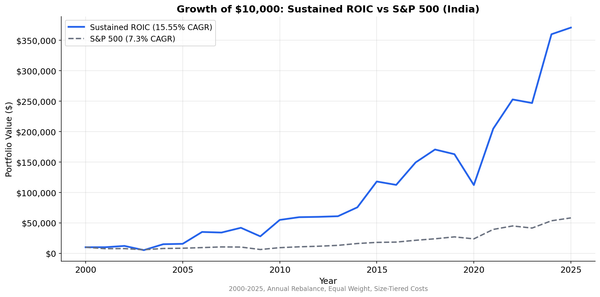
Sustained high ROIC on BSE+NSE from 2000 to 2025. 15.55% CAGR vs 7.30% SPY. India is the only market where persistence alpha (+4.98%) is positive. The trade-off: 52% volatility and -56.9% max drawdown.
asset-light
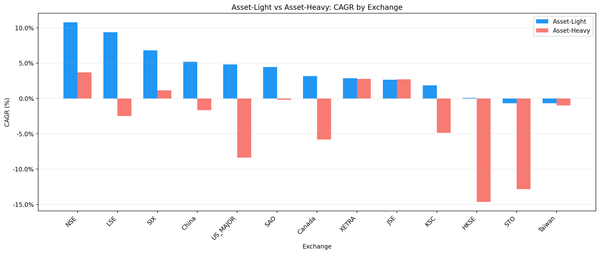
We tested the asset-light composite score across 13 exchanges over 25 years. The light-heavy spread was positive on all 13 markets, ranging from +0.82% (Taiwan) to +16.22% (US). Capital efficiency separates winners from losers globally.
asset-light
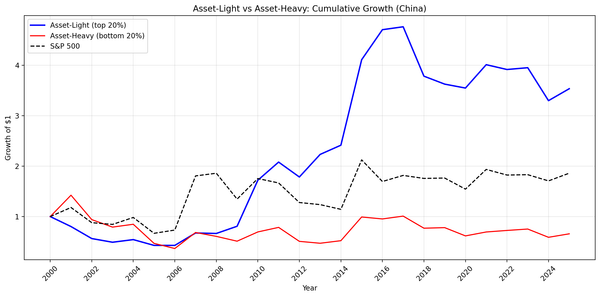
We tested the asset-light composite score on Chinese A-shares (SHH + SHZ) over 25 years. Asset-light returned 3.17% vs -1.29% for asset-heavy: a 4.46% spread. SOE dynamics and the 2021 tech crackdown complicate the picture.
asset-light
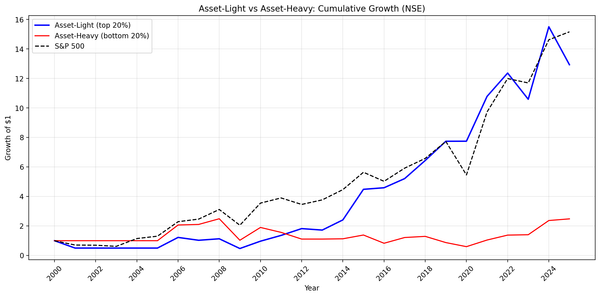
We tested the asset-light composite score on Indian stocks (BSE + NSE) over 25 years. Asset-light returned 5.39% annually vs 1.60% for asset-heavy: a 3.79% spread. Smaller than the US, and India's capex-led growth cycle creates a headwind.
free cash flow
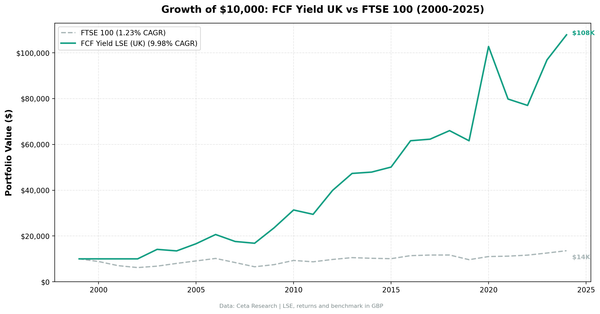
We screened for high FCF yield on London Stock Exchange stocks from 2000 to 2025. 9.98% CAGR, +8.75% excess over FTSE 100. In 2008, the portfolio fell only 4.4% while FTSE 100 dropped 22%. Down capture of 23% with 196% up capture. Quality-filtered cash generators dominate flat UK markets.
asset-light
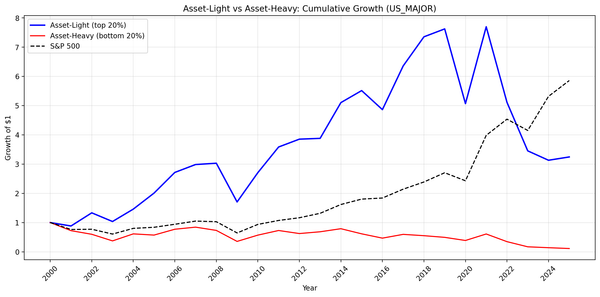
We scored US stocks on asset turnover, capex intensity, and gross margin over 25 years. Asset-light (top 20%) returned 4.82% annually, asset-heavy (bottom 20%) -8.38%. The 13% annual spread is consistent across every decade, but the signal works better as a filter than a standalone strategy.