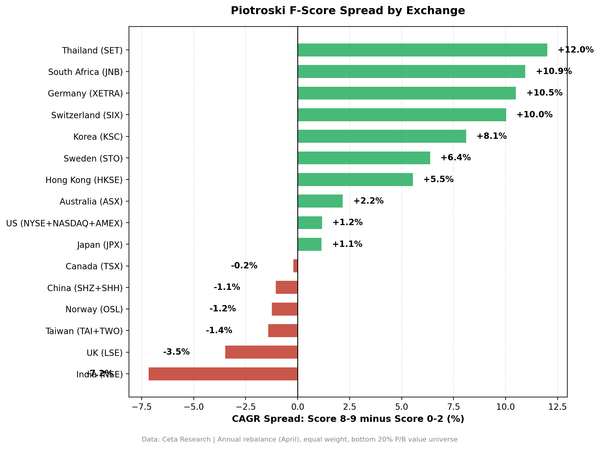
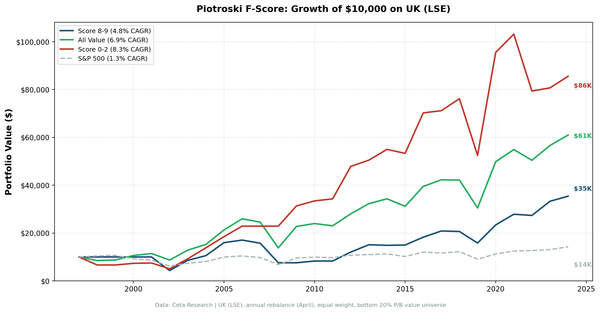
Cash Flow
India: 13% Annual Return, +0.9% Alpha Over Sensex, -21% Max Drawdown
Operating cash flow momentum returned 13.0% annually on NSE stocks from 2000-2025, vs the Sensex's 12.1%. Max drawdown: -20.6% vs Sensex's -32.2%. $10,000 → $201,000.
Cash Flow
Operating cash flow momentum returned 13.0% annually on NSE stocks from 2000-2025, vs the Sensex's 12.1%. Max drawdown: -20.6% vs Sensex's -32.2%. $10,000 → $201,000.
Cash Flow
OCF momentum returned 3.2% annually on Japanese stocks, underperforming SPY by 4.6%. 24% cash drag + weak shareholder orientation = signal failure. Cash generation without value creation.
Cash Flow
OCF momentum returned 6.2% annually on Swiss stocks, -1.6% vs SPY but with solid Sharpe (0.37) and lowest volatility (15.7%). Defensive quality, no alpha.
Cash Flow
OCF momentum returned 2.1% annually on Thai stocks, worst performance of any market tested. -5.7% vs SPY, negative Sharpe, 24% cash drag. Political instability + weak governance = signal irrelevant.
Cash Flow
OCF momentum returned 7.7% annually on UK stocks, essentially matching SPY's 7.8%. Extreme volatility (+66% best year, -27% worst) with no alpha. Developed market reality check.
Cash Flow
We tested a cash flow quality screen on 25 years of US stock data. The strategy matched the S&P 500's 7.8% return, crushing the market during the dot-com bust but struggling in growth-dominated years.
dividend investing
A 5-factor dividend sustainability score backtested on ASX from 2000-2025. 5.96% CAGR, +2.07% annual excess over ASX 200, 64% win rate. Lowest volatility in our global comparison at 14.48%.
dividend investing
The dividend sustainability screen on TSX stocks returned 9.54% CAGR over 25 years with 5.59% annual excess over the TSX Composite. 72% win rate vs local benchmark, 21.6% down capture.
dividend investing
A 5-factor dividend sustainability score backtested on Shanghai and Shenzhen from 2000-2025. 6.66% CAGR, +4.23% annual excess over SSE Composite, 76% win rate vs local benchmark. High volatility (31.66%) is the main cost.
dividend investing
We scored dividend stocks across 13 exchanges on five dimensions: payout, leverage, FCF coverage, ROE, and Piotroski F-Score. 12 of 13 beat their local market index. India led at 15.81% CAGR (NSE), +3.75% above the Sensex. Germany had a 0.613 Sharpe. Korea was the only miss, trailing the KOSPI...
dividend investing
The dividend sustainability screen on XETRA stocks returned 11.53% CAGR with a 0.613 Sharpe ratio and 6.49% annual excess over the DAX. Down capture of just -6.7% vs the local benchmark.
dividend investing
A 5-factor dividend sustainability score backtested on HKSE from 2000-2025. 6.50% CAGR, +4.86% annual excess over the Hang Seng Index, 60% win rate. The screen consistently beat Hong Kong's own market over 25 years.