China P/E Compression: -0.68% CAGR, -8.32% vs SPY

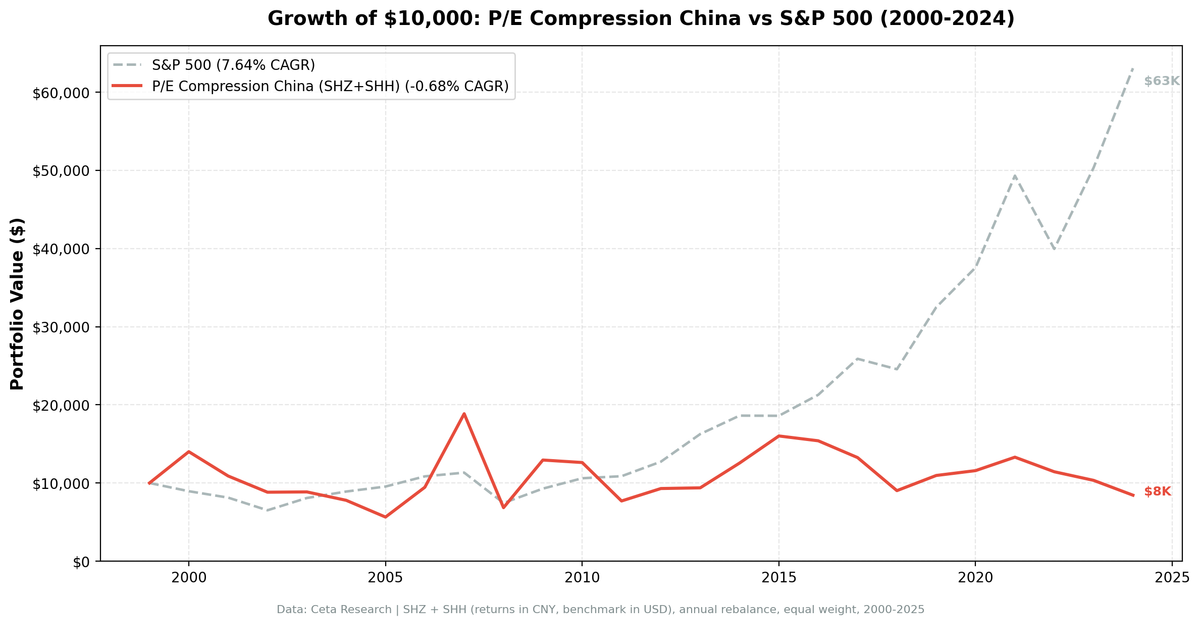
P/E compression on Chinese stocks delivers -0.68% CAGR, the worst absolute performance among all 21 tested markets. The strategy underperforms SPY by 8.32% annually with negative Sharpe ratio and -63.70% max drawdown. P/E dynamics differ in Chinese markets: government policy, state ownership, and speculative trading make compressed multiples unreliable mean reversion signals.
Contents
Method
- Universe: SHZ + SHH (Shanghai + Shenzhen), market cap > ¥10B
- Period: 2000-2025 (25 years)
- Benchmark: S&P 500 Total Return (SPY, USD)
Returns in CNY. Benchmark in USD.
What We Found

| Metric | China | S&P 500 |
|---|---|---|
| CAGR | -0.68% | 7.64% |
| Excess | -8.32% | - |
| Sharpe | -0.083 | 0.322 |
| MaxDD | -63.70% | -34.90% |
| Down-Cap | 84.76% | 100% |
| Avg Stocks | 23.9 | - |
| Cash | 0/25 | - |
Negative absolute CAGR means $10,000 shrank to $9,834 over 25 years. Negative Sharpe ratio. Max drawdown of -63.70% is catastrophic. This strategy failed completely.
Why China Is the Worst
Policy-driven markets. Chinese stocks move on government policy, not fundamentals. P/E compression can persist for years if policy doesn't favor the sector.
State ownership. Many Chinese companies are state-owned enterprises with unclear governance. P/E compression often reflects genuine concern about capital allocation and shareholder treatment.
Speculative trading. Chinese retail investors drive massive volatility. P/E ratios swing based on momentum and speculation, not earnings expectations.
Earnings quality. Financial reporting in China is less reliable. A compressed P/E may reflect skepticism about reported earnings, not temporary undervaluation.
Methodology
- Screen: P/E compression ratio below 0.85 (current P/E at least 15% below 5-year average)
- Quality filters: ROE above 10%, debt-to-equity below 2.0
- Rebalancing: Annual, equal-weight top 30 qualifying stocks
- Period: 25 years of out-of-sample data (2000-2025)
Despite zero cash periods and 23.9 stocks on average, diversification didn't help. The problem isn't sample size. It's that Chinese P/E dynamics don't follow mean-reversion patterns.
Run It Yourself
Screen Chinese stocks with P/E compression filters on Ceta Research. Market cap threshold: CNY 10B, P/E compression ratio below 0.85, ROE above 10%, D/E below 2.0.
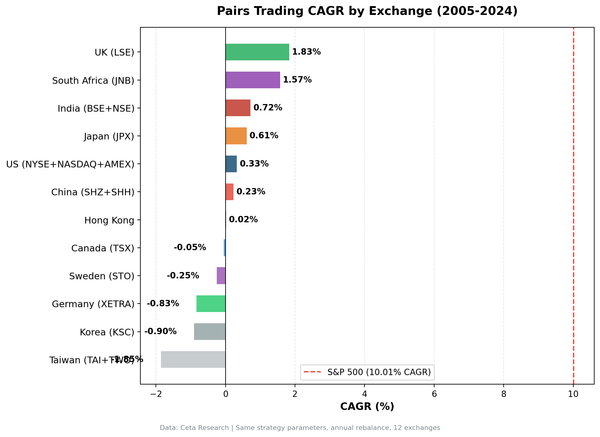
Part of a Series: US +2.32% | UK +1.38% | Hong Kong -7.91% | India -3.50%
Conclusion
China's P/E compression strategy delivers -0.68% CAGR, the worst absolute return among all tested markets. Underperformance of 8.32% annually shows the signal doesn't work when policy, governance, and speculative trading dominate pricing. Mean reversion requires stable, predictable P/E dynamics. China doesn't provide that.
Run It Yourself
Explore the data behind this analysis on Ceta Research. Query our financial data warehouse with SQL, build custom screens, and run your own backtests across 70,000+ stocks on 20 exchanges.
Data: Ceta Research. Returns in CNY. github.com/ceta-research/backtests