
Small-Cap Value on Indian Stocks: 22.48% CAGR, the Highest of Any Exchange We Tested
We backtested small-cap value on Indian exchanges (BSE + NSE) from 2000 to 2025. 22.48% CAGR, beating the Sensex by 10.42% per year. The highest absolute return of any exchange in our 14-market comparison.


Small-Cap Value on Indian Stocks: 20.89% CAGR, the Highest of Any Exchange We Tested
We backtested a small-cap value screen on Indian exchanges (NSE) from 2000 to 2025. Buy the 30 cheapest small-cap stocks by Price-to-Book ratio, require ROE > 5% and D/E < 2.5, rebalance annually in July. The result: 20.89% CAGR, beating the Sensex by 8.83% per year. India produced the highest absolute return of any exchange in our 14-market global comparison.
Contents
- Method
- What is Small-Cap Value?
- What We Found
- 20.89% CAGR. 8.83% excess return per year over the Sensex.
- Year-by-year returns
- 2013: +130.4%, the best single year we found anywhere
- The post-COVID rally: +110.4% in 2020
- Cash periods and data coverage
- Why India produces the highest returns
- Currency caveat
- Backtest Methodology
- Limitations
- Takeaway
- Part of a Series
- References
- Run This Screen Yourself
Data: FMP financial data warehouse, 2000–2025. Updated March 2026.
Method
Data source: Ceta Research (FMP financial data warehouse) Universe: NSE (Indian exchanges), small-cap range (market cap 5-200% of exchange threshold) Period: 2000-2025 (25 years, annual rebalance in July) Rebalancing: Annual (July), equal weight top 30 by P/B ascending Benchmark: Sensex Cash rule: Hold cash if fewer than 10 stocks qualify Execution: Next-day close (MOC) Currency: Returns in INR
45-day lag on financial data to prevent look-ahead bias. Trades execute at next-day close (MOC) to avoid same-day entry bias.
What is Small-Cap Value?
Small-cap value targets the intersection of two Fama-French factors: size and value. The pure size premium has weakened since 1980, but cheap small-cap stocks continue to outperform expensive small-cap stocks. This screen buys the cheapest by P/B ratio with basic quality controls.
Filters:
| Criterion | Metric | Threshold |
|---|---|---|
| Valuation | Price-to-Book | 0 to 1.5 |
| Profitability | Return on Equity | > 5% |
| Leverage | Debt-to-Equity | < 2.5 |
| Size | Market Cap | Small-cap range |
Ranking: P/B ascending, top 30 stocks.
What We Found
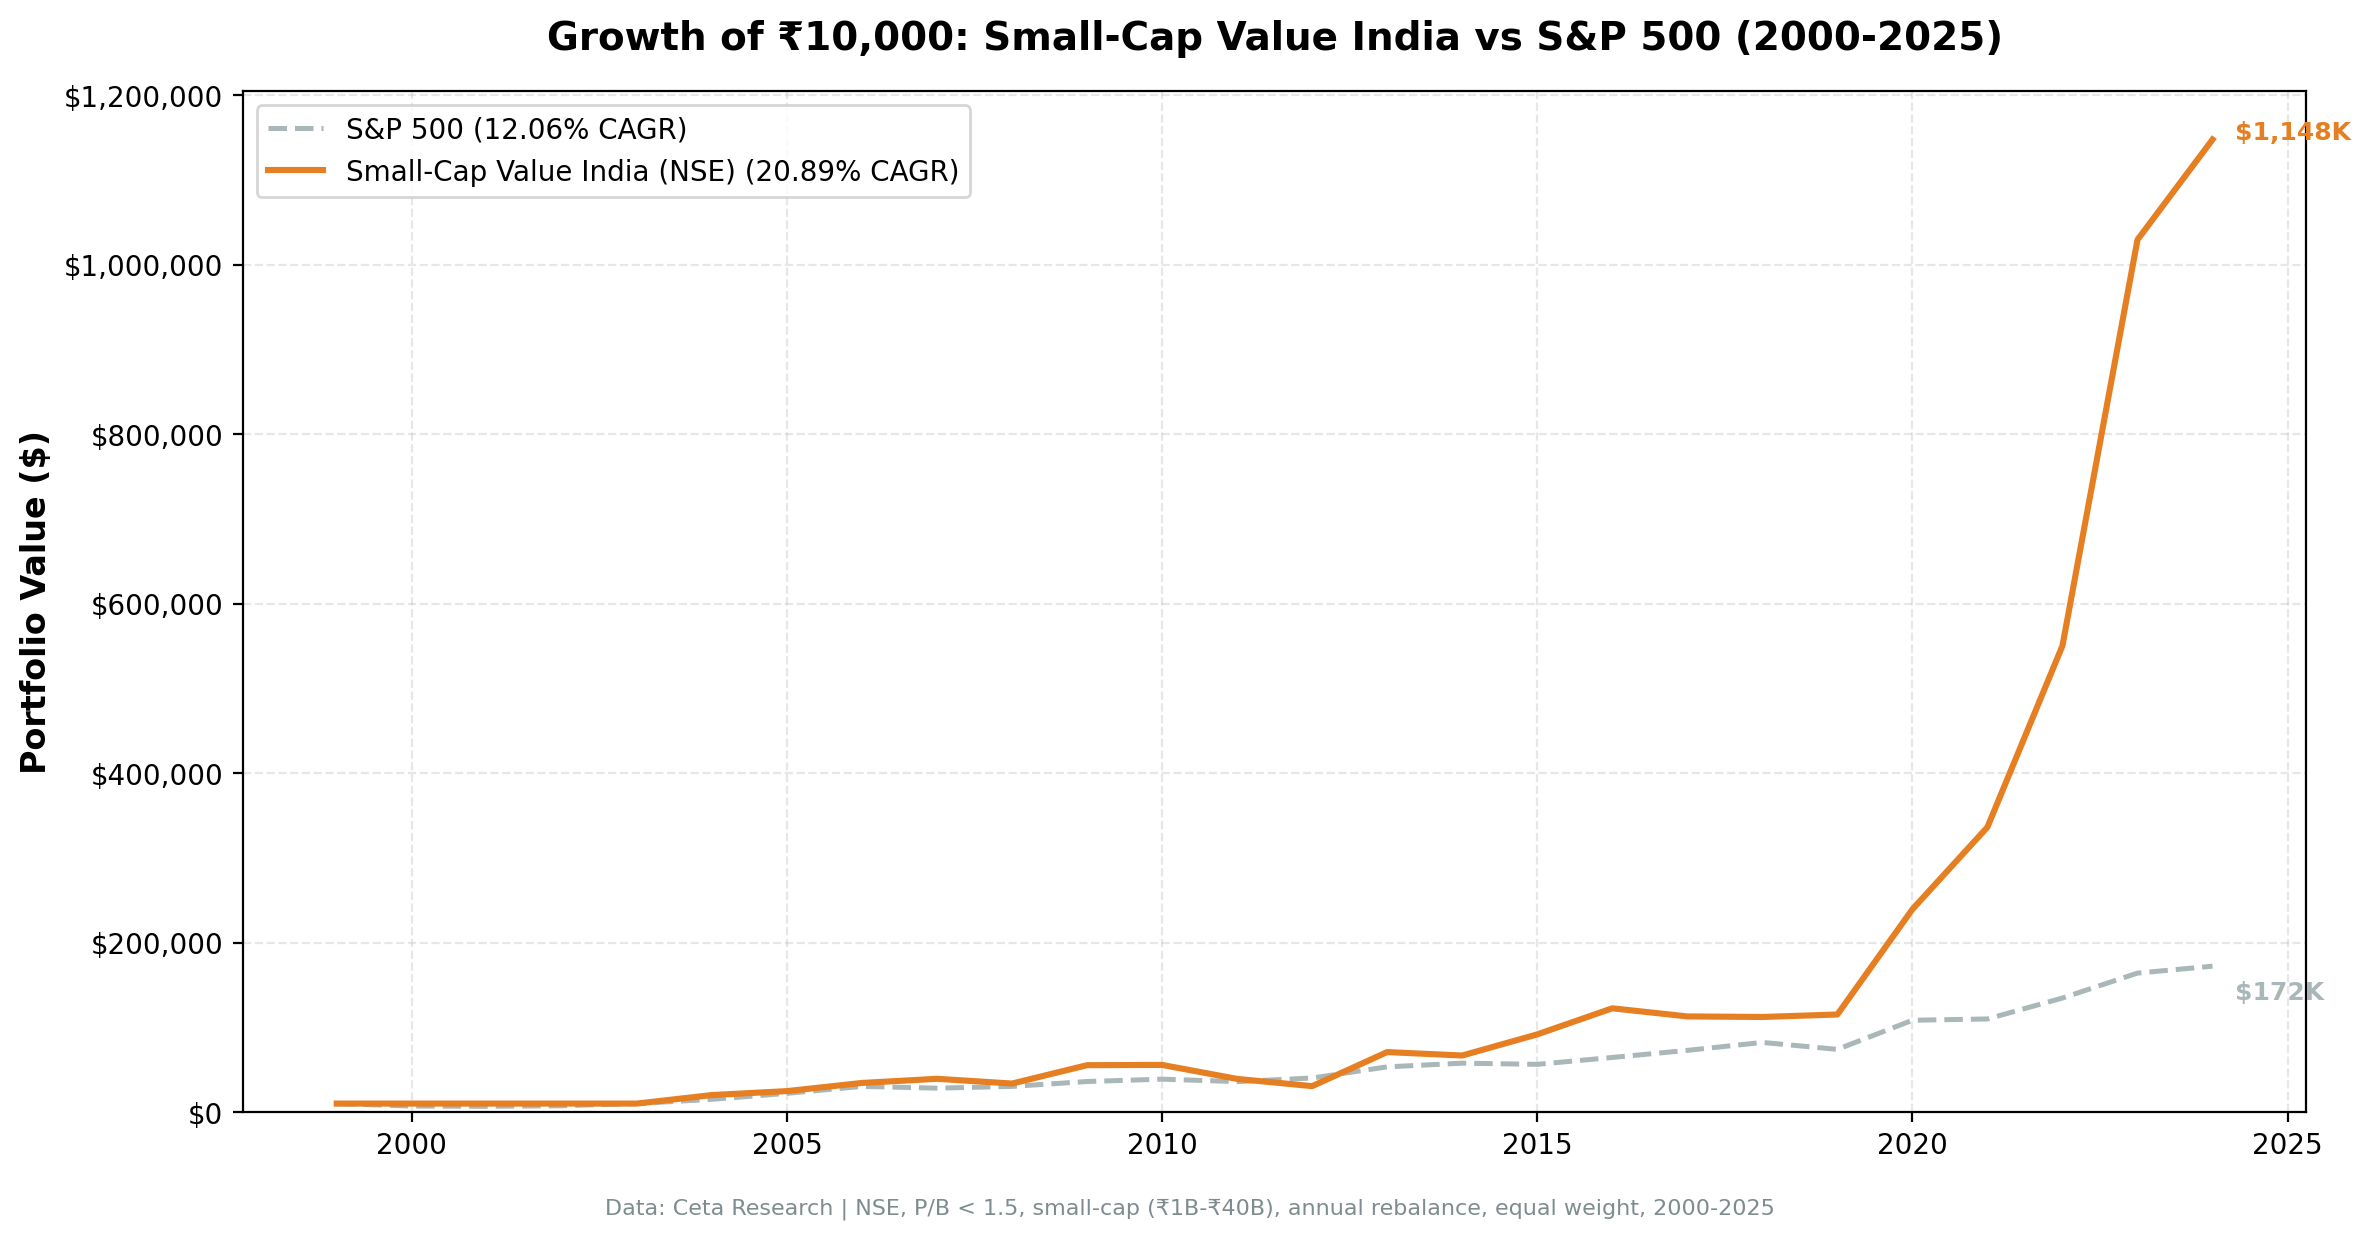
20.89% CAGR. 8.83% excess return per year over the Sensex.
| Metric | Small-Cap Value (India) | Sensex |
|---|---|---|
| CAGR | 20.89% | 12.06% |
| Excess vs Sensex | +8.83% | - |
| Max Drawdown | -45.03% | - |
| Sharpe Ratio | 0.334 | - |
| Avg Stocks per Period | 24.3 | - |
| Cash Periods | 16% | - |
The raw return is staggering. 20.89% compounded annually for 25 years. The Sharpe ratio (0.334) is lower than what you'd get buying the Sensex passively, which means the higher return comes with proportionally higher volatility. That's the emerging market small-cap tradeoff. But +8.83% annual excess over the Sensex is still a large premium.
Year-by-year returns
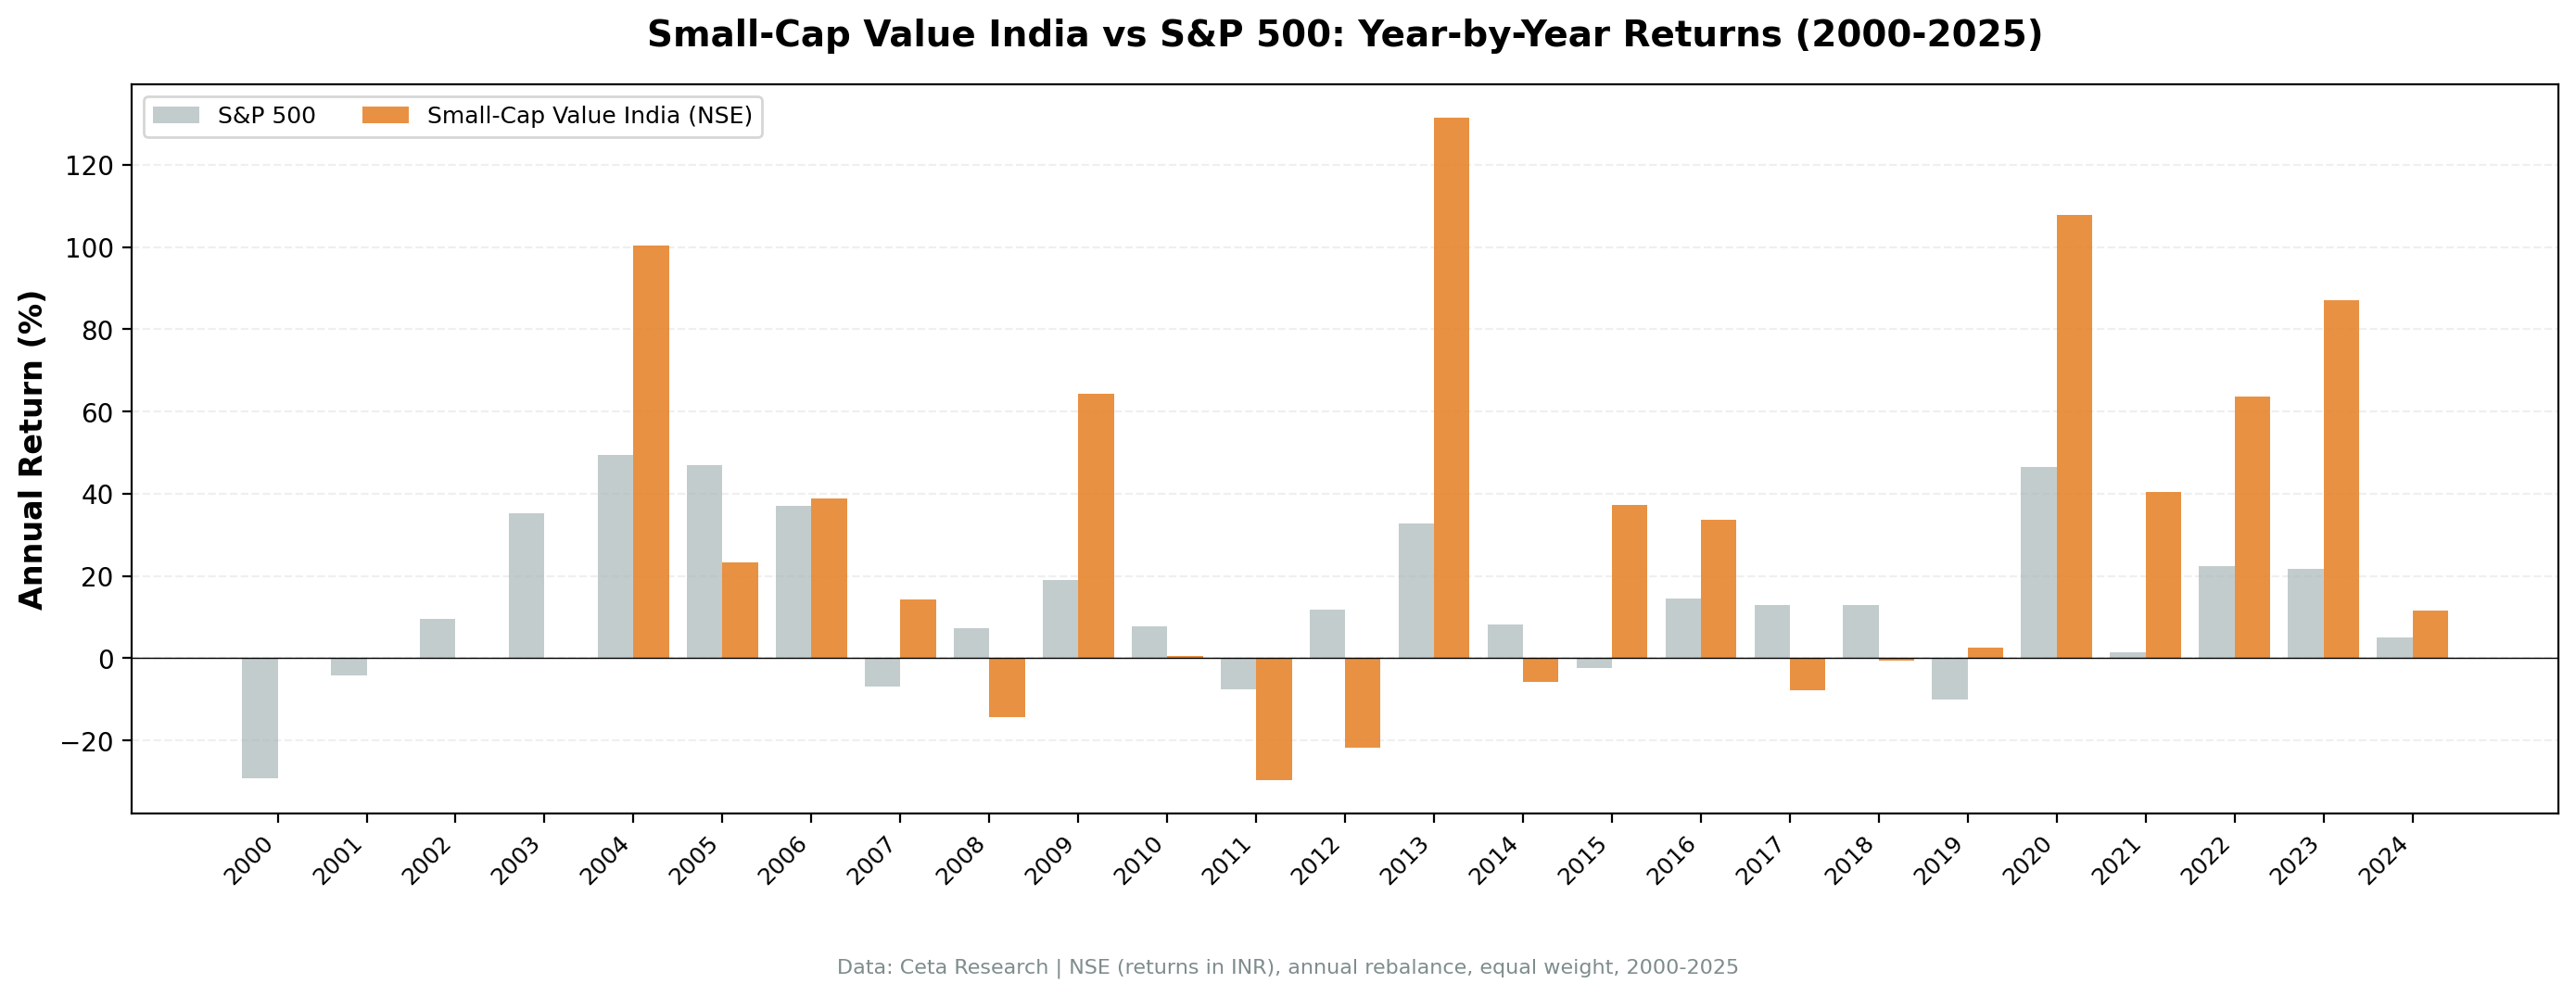
The headline numbers from specific years tell the story.
| Year | Small-Cap Value (India) | Context |
|---|---|---|
| 2004 | +102.0% | Post-reform rally, NDA government boost |
| 2009 | +68.4% | Post-GFC recovery |
| 2013 | +130.4% | Best single year across all 14 exchanges |
| 2020 | +110.4% | Post-COVID small-cap explosion |
| 2023 | +81.6% | India bull market continuation |
2013: +130.4%, the best single year we found anywhere
No other exchange, no other year, came close. Indian small-cap value stocks more than doubled in 2013. The backdrop was a combination of factors: compressed valuations from the 2011-2012 correction, improving corporate earnings, and a wave of domestic retail investor participation. Companies trading below book value with positive ROE saw their P/B ratios normalize rapidly.
This is what happens when the small-value premium ignites in a market with deep undervaluation. The rerating was extreme. Stocks that were ignored at P/B 0.3-0.5 repriced to P/B 1.0-2.0 in twelve months.
The post-COVID rally: +110.4% in 2020
The COVID crash hit Indian small caps hard. The March 2020 lows created valuations not seen since the GFC. Then the recovery was equally violent. Retail investor participation surged (Demat accounts doubled in 2020-2021). Government stimulus and RBI rate cuts flooded the market with liquidity. Small-cap value was the primary beneficiary.
Cash periods and data coverage
The strategy was in cash 16% of the time. The early years (2000-2002) had thinner data coverage for Indian small caps. FMP's historical data for NSE improved significantly after 2003. From 2003 onward, the portfolio averaged 23+ stocks per period, well above the 10-stock minimum.
Why India produces the highest returns
Three structural reasons:
Quality dispersion is wider. In developed markets, the difference between the best and worst companies (by ROE, leverage, profitability) is narrow. In India, the spread is enormous. An ROE > 5% filter in India eliminates genuinely distressed companies in a way that matters more than in the US, where most listed companies clear that bar easily.
Valuation spreads are larger. Indian small caps regularly trade at P/B ratios of 0.2-0.5, well below anything you'd find on NYSE or NASDAQ. When these companies rerate, the percentage moves are huge. A stock going from P/B 0.3 to P/B 1.0 is a 233% increase in price relative to book value.
Information asymmetry is extreme. Indian small caps get almost no analyst coverage. Institutional investors focus on Nifty 50 and Nifty Next 50 names. The thousands of NSE-listed small caps are effectively invisible to professional capital. This creates persistent mispricings that take quarters or years to correct.
Currency caveat
All returns are in INR. The Indian Rupee depreciated roughly 60% against the USD over this 25-year period (approximately 2-3% annual depreciation). A US-based investor would see USD-adjusted CAGR of approximately 19-20%. Still exceptional, still the highest of any exchange we tested, but worth noting.
Backtest Methodology
| Parameter | Choice |
|---|---|
| Universe | NSE, small-cap range |
| Signal | P/B 0-1.5, ROE > 5%, D/E < 2.5 |
| Portfolio | Top 30 by P/B ascending, equal weight |
| Rebalancing | Annual (July) |
| Cash rule | Hold cash if < 10 qualify |
| Benchmark | Sensex |
| Execution | Next-day close (MOC) |
| Period | 2000-2025 (25 years) |
| Data | Point-in-time (45-day lag) |
Limitations
Currency risk. Returns in INR. USD-adjusted returns are 2-3% lower annually due to rupee depreciation. Indian inflation also runs higher than US inflation, so real returns are closer to the US result than nominal returns suggest.
Data coverage gaps in early years. 2000-2002 had thin data, resulting in cash periods. The strategy's CAGR benefits from the 2003+ period where data coverage improved and returns were strongest.
Survivorship bias is more acute. Indian small caps delist, merge, and go bankrupt at higher rates than US large caps. The backtest uses current exchange profiles, which likely overstates returns by excluding companies that failed.
Liquidity constraints. Many Indian small caps trade thin volumes. A 30-stock portfolio in this market cap range would face real execution challenges. Market impact costs could be 0.5-1.0% per trade in the least liquid names.
Regulatory risk. SEBI regulations on short selling, circuit breakers, and foreign investor limits create frictions not present in US markets. These don't appear in the backtest but affect real-world implementation.
Takeaway
India produced the highest small-cap value returns of any exchange we tested. 20.89% CAGR over 25 years, with individual years exceeding 100%. The combination of wide quality dispersion, extreme valuation spreads, and information asymmetry creates a fertile environment for factor investing in small caps.
The numbers include some caveats: INR returns, data coverage gaps in the early years, and survivorship bias that likely inflates the result. But even after adjusting for currency, the CAGR is approximately 20%. That's still dramatically higher than any developed market.
The pattern is consistent with academic research on emerging market factor premiums. Quality and value factors produce larger returns in markets with weaker institutional coverage and wider information gaps. India is the clearest example in our dataset.
Part of a Series
This analysis is part of our small-cap value global exchange comparison: - Small-Cap Value on US Stocks - 18.28% CAGR, the flagship result - Small-Cap Value on UK Stocks - Best risk-adjusted (0.750 Sharpe, -10.89% MaxDD) - Small-Cap Value: 14-Exchange Global Comparison - All 14 beat their local benchmark
References
- Fama, E. & French, K. (1993). "Common Risk Factors in the Returns on Stocks and Bonds." Journal of Financial Economics, 33(1), 3-56.
- Israel, R. & Moskowitz, T. (2013). "The Role of Shorting, Firm Size, and Time on Market Anomalies." Journal of Financial Economics, 108(2), 275-301.
- Banz, R. (1981). "The Relationship Between Return and Market Value of Common Stocks." Journal of Financial Economics, 9(1), 3-18.
Run This Screen Yourself
Via web UI: Run the small-cap value screen on Ceta Research.
Get your API key at cetaresearch.com. The full backtest code (Python + DuckDB) is on GitHub.
Data: Ceta Research, FMP financial data warehouse. Universe: NSE small caps. Annual rebalance (July), equal weight top 30, 2000-2025. Returns in INR.
Past performance does not guarantee future results. This is educational content, not investment advice.


