
Small-Cap Value on US Stocks: 18.10% CAGR Over 25 Years of NYSE, NASDAQ, and AMEX Data
We backtested a small-cap value screen on US stocks from 2000 to 2025. Buy the 30 cheapest small caps by P/B with quality controls. Result: 18.10% CAGR vs 7.85% for SPY, with half the drawdown.

We built a small-cap value screen and backtested it on all US exchanges (NYSE, NASDAQ, AMEX) from 2000 to 2025. Buy the 30 cheapest small-cap stocks by Price-to-Book ratio, require positive ROE and controlled leverage, rebalance annually. The result: 18.10% CAGR vs 7.85% for the S&P 500, using next-day execution to avoid look-ahead bias. The portfolio was fully invested in every single period.
Contents
- Method
- What is Small-Cap Value?
- The Screen
- Small-Cap Value Screen (SQL)
- What We Found
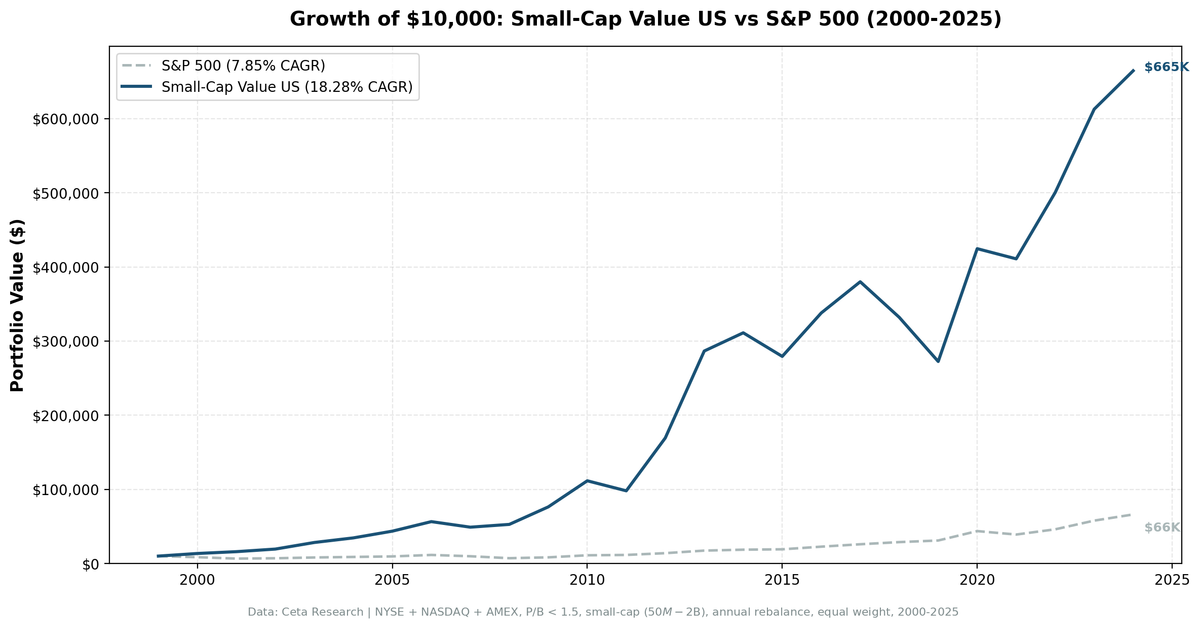
- 25 years of data. 10.25% annual excess return over the S&P 500.
- Year-by-year returns
- The dot-com era: where small-cap value proved itself
- The 2008 financial crisis: +7.7% while SPY lost 27%
- 2012: the best single year at +72.7%
- 2020: post-COVID small-cap rally at +55.8%
- Where it struggles: 2019
- Backtest Methodology
- Limitations
- Takeaway
- Part of a Series
- References
- Run This Screen Yourself
Data: FMP financial data warehouse, 2000–2025. Updated March 2026.
Method
Data source: Ceta Research (FMP financial data warehouse) Universe: All US exchanges (NYSE, NASDAQ, AMEX), small-cap range (market cap 5-200% of exchange threshold) Period: 2000-2025 (25 years, annual rebalance in July) Rebalancing: Annual (July), equal weight top 30 by P/B ascending Benchmark: S&P 500 Total Return (SPY) Cash rule: Hold cash if fewer than 10 stocks qualify
45-day lag on financial data to prevent look-ahead bias. Next-day close execution (MOC) to avoid same-day entry bias. All returns in USD.
What is Small-Cap Value?
The Fama-French three-factor model identified two persistent return drivers beyond the market: size (small beats large) and value (cheap beats expensive). Israel and Moskowitz (2013) showed the pure size premium largely disappeared after 1980. But the interaction survived. Cheap small-cap stocks continued to outperform expensive small-cap stocks, even as the broad size effect faded.
This screen targets that interaction directly. Not small caps in general. Cheap small caps with basic quality controls.
Filters:
| Criterion | Metric | Threshold |
|---|---|---|
| Valuation | Price-to-Book | 0 to 1.5 |
| Profitability | Return on Equity | > 5% |
| Leverage | Debt-to-Equity | < 2.5 |
| Size | Market Cap | Small-cap range (5-200% of exchange threshold) |
Ranking: P/B ascending (cheapest first). Top 30 enter the portfolio.
Three filters working together. P/B < 1.5 finds stocks trading near or below book value. ROE > 5% removes distressed companies that are cheap for good reasons. D/E < 2.5 keeps heavily leveraged balance sheets out. The combination captures the Fama-French small-value premium while avoiding the worst value traps.
The Screen
Small-Cap Value Screen (SQL)
SELECT
    k.symbol,
    p.companyName,
    p.exchange,
    p.sector,
    ROUND(f.priceToBookRatioTTM, 3) AS pb_ratio,
    ROUND(k.returnOnEquityTTM * 100, 1) AS roe_pct,
    ROUND(COALESCE(f.debtToEquityRatioTTM, 0), 2) AS de_ratio,
    ROUND(k.marketCap / 1e9, 3) AS mktcap_b
FROM key_metrics_ttm k
JOIN profile p ON k.symbol = p.symbol
JOIN financial_ratios_ttm f ON k.symbol = f.symbol
WHERE f.priceToBookRatioTTM > 0
  AND f.priceToBookRatioTTM < 1.5
  AND k.returnOnEquityTTM > 0.05
  AND (f.debtToEquityRatioTTM IS NULL OR (f.debtToEquityRatioTTM >= 0 AND f.debtToEquityRatioTTM < 2.5))
  AND k.marketCap >= 50000000
  AND k.marketCap <= 2000000000
  AND p.exchange IN ('NYSE', 'NASDAQ', 'AMEX')
QUALIFY ROW_NUMBER() OVER (PARTITION BY k.symbol ORDER BY f.priceToBookRatioTTM ASC) = 1
ORDER BY f.priceToBookRatioTTM ASC
LIMIT 30
Run this screen on Ceta Research
What We Found
25 years of data. 10.25% annual excess return over the S&P 500.
| Metric | Small-Cap Value (US) | S&P 500 |
|---|---|---|
| CAGR | 18.10% | 7.85% |
| Max Drawdown | -28.29% | -38.01% |
| Sharpe Ratio | 0.641 | 0.352 |
| Avg Stocks per Period | 15.4 | - |
| Cash Periods | 0% | - |
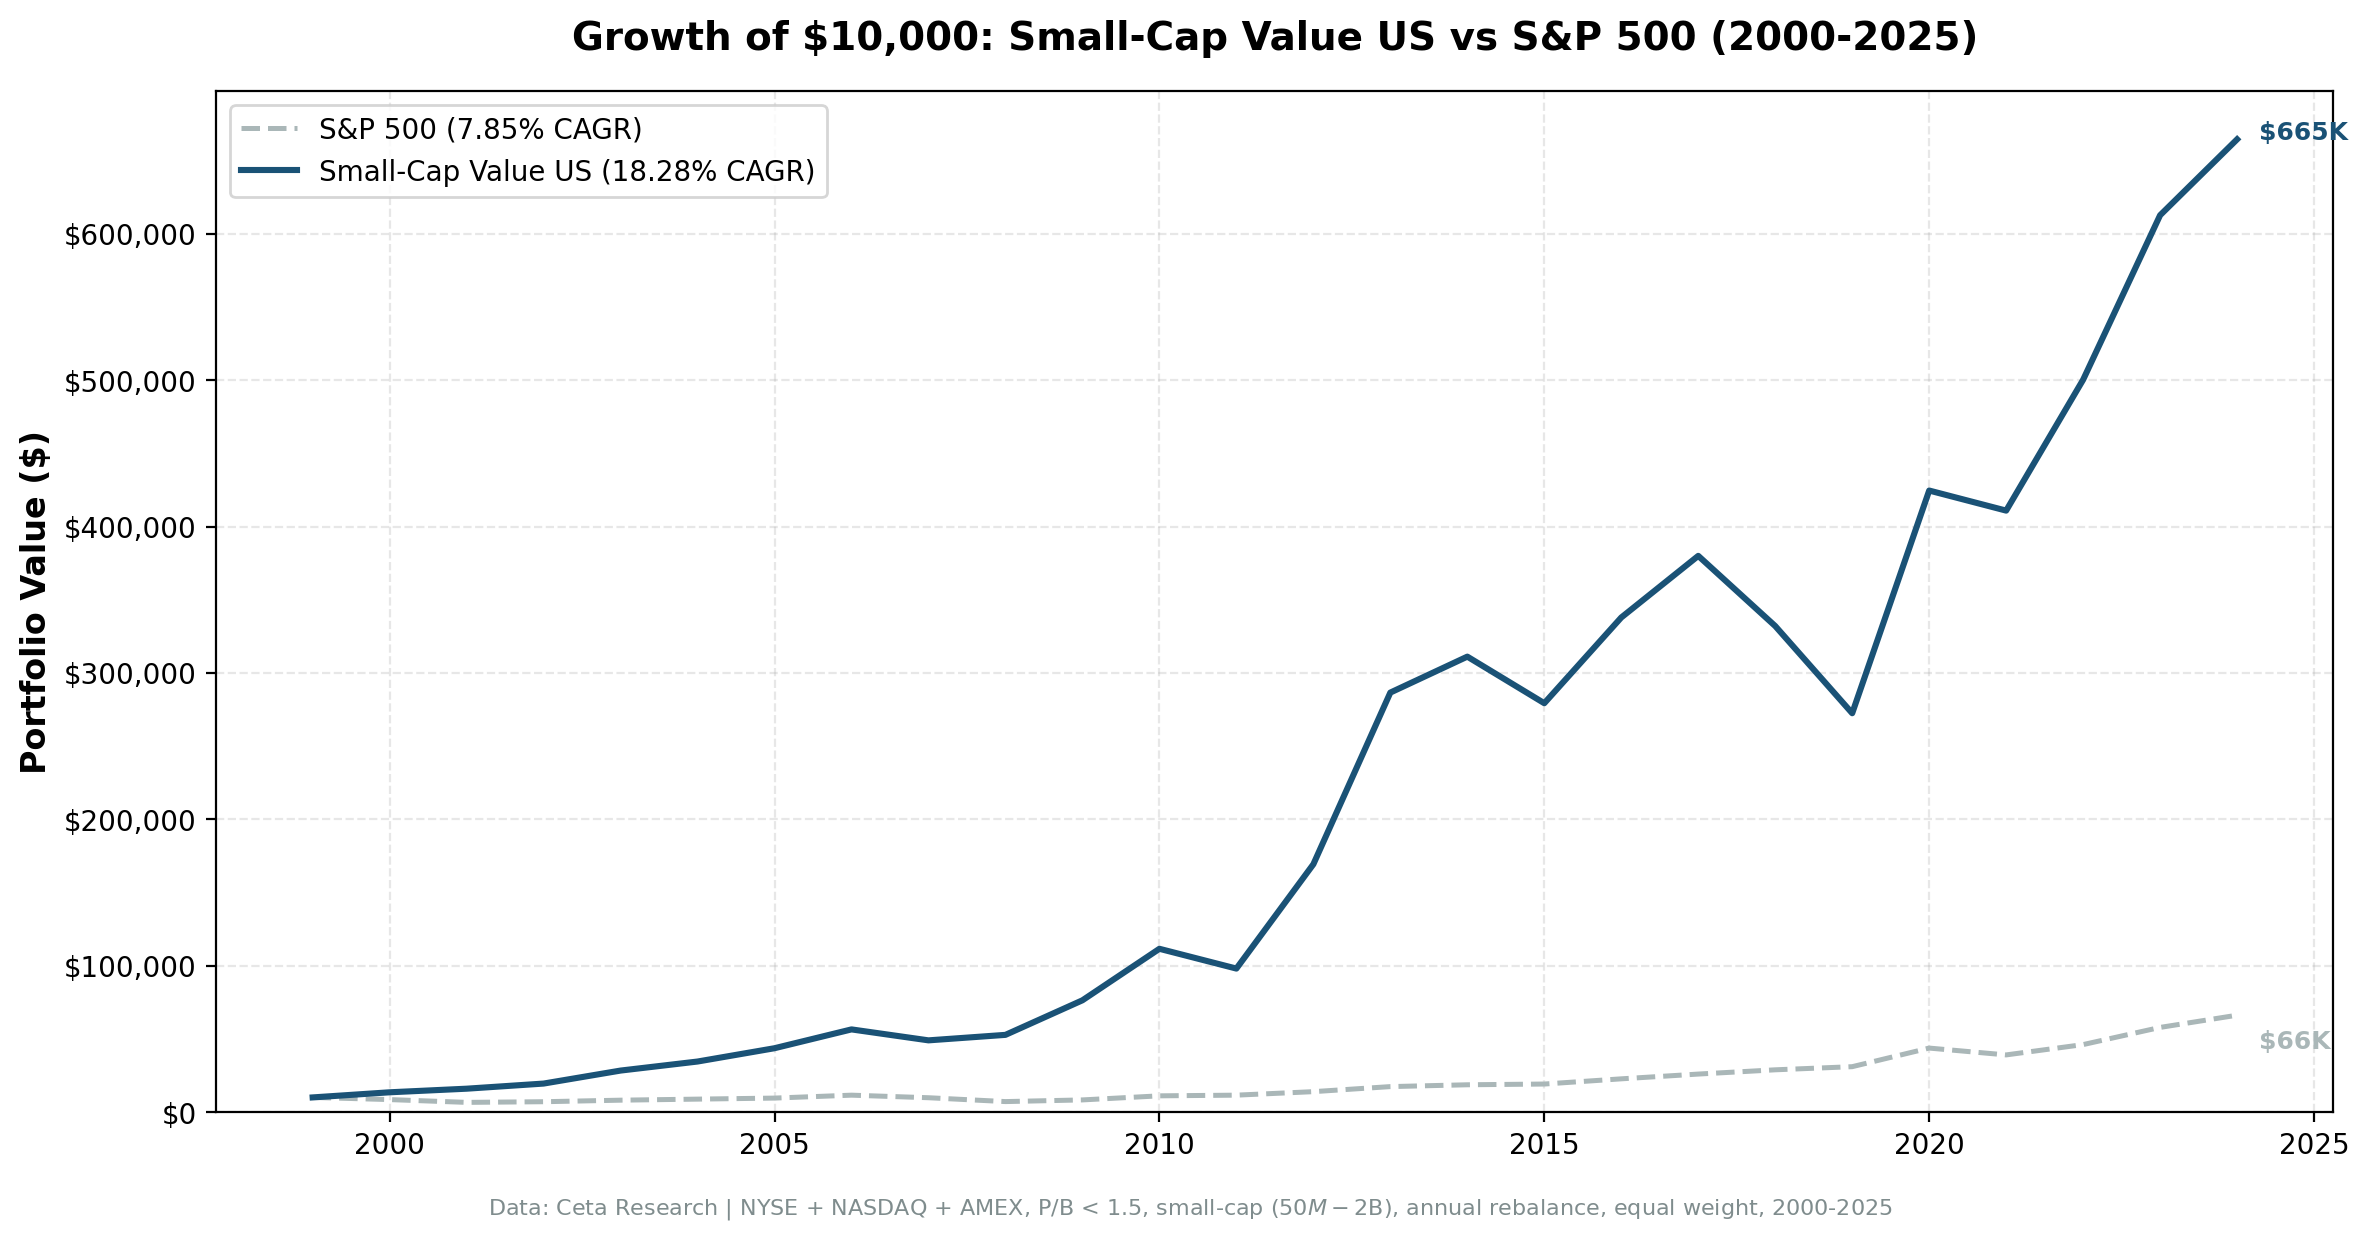
$10,000 invested in this strategy in 2000 would have grown to roughly $640,000. The same amount in SPY would be about $66,000. That's not a typo. The compounding difference between 18.10% and 7.85% over 25 years is that large.
The Sharpe ratio is the standout number. 0.641 means the strategy delivered substantially more return per unit of risk than SPY's 0.352. And the max drawdown was -28.29% vs SPY's -38.01%. Lower drawdown, more than double the CAGR.
Year-by-year returns
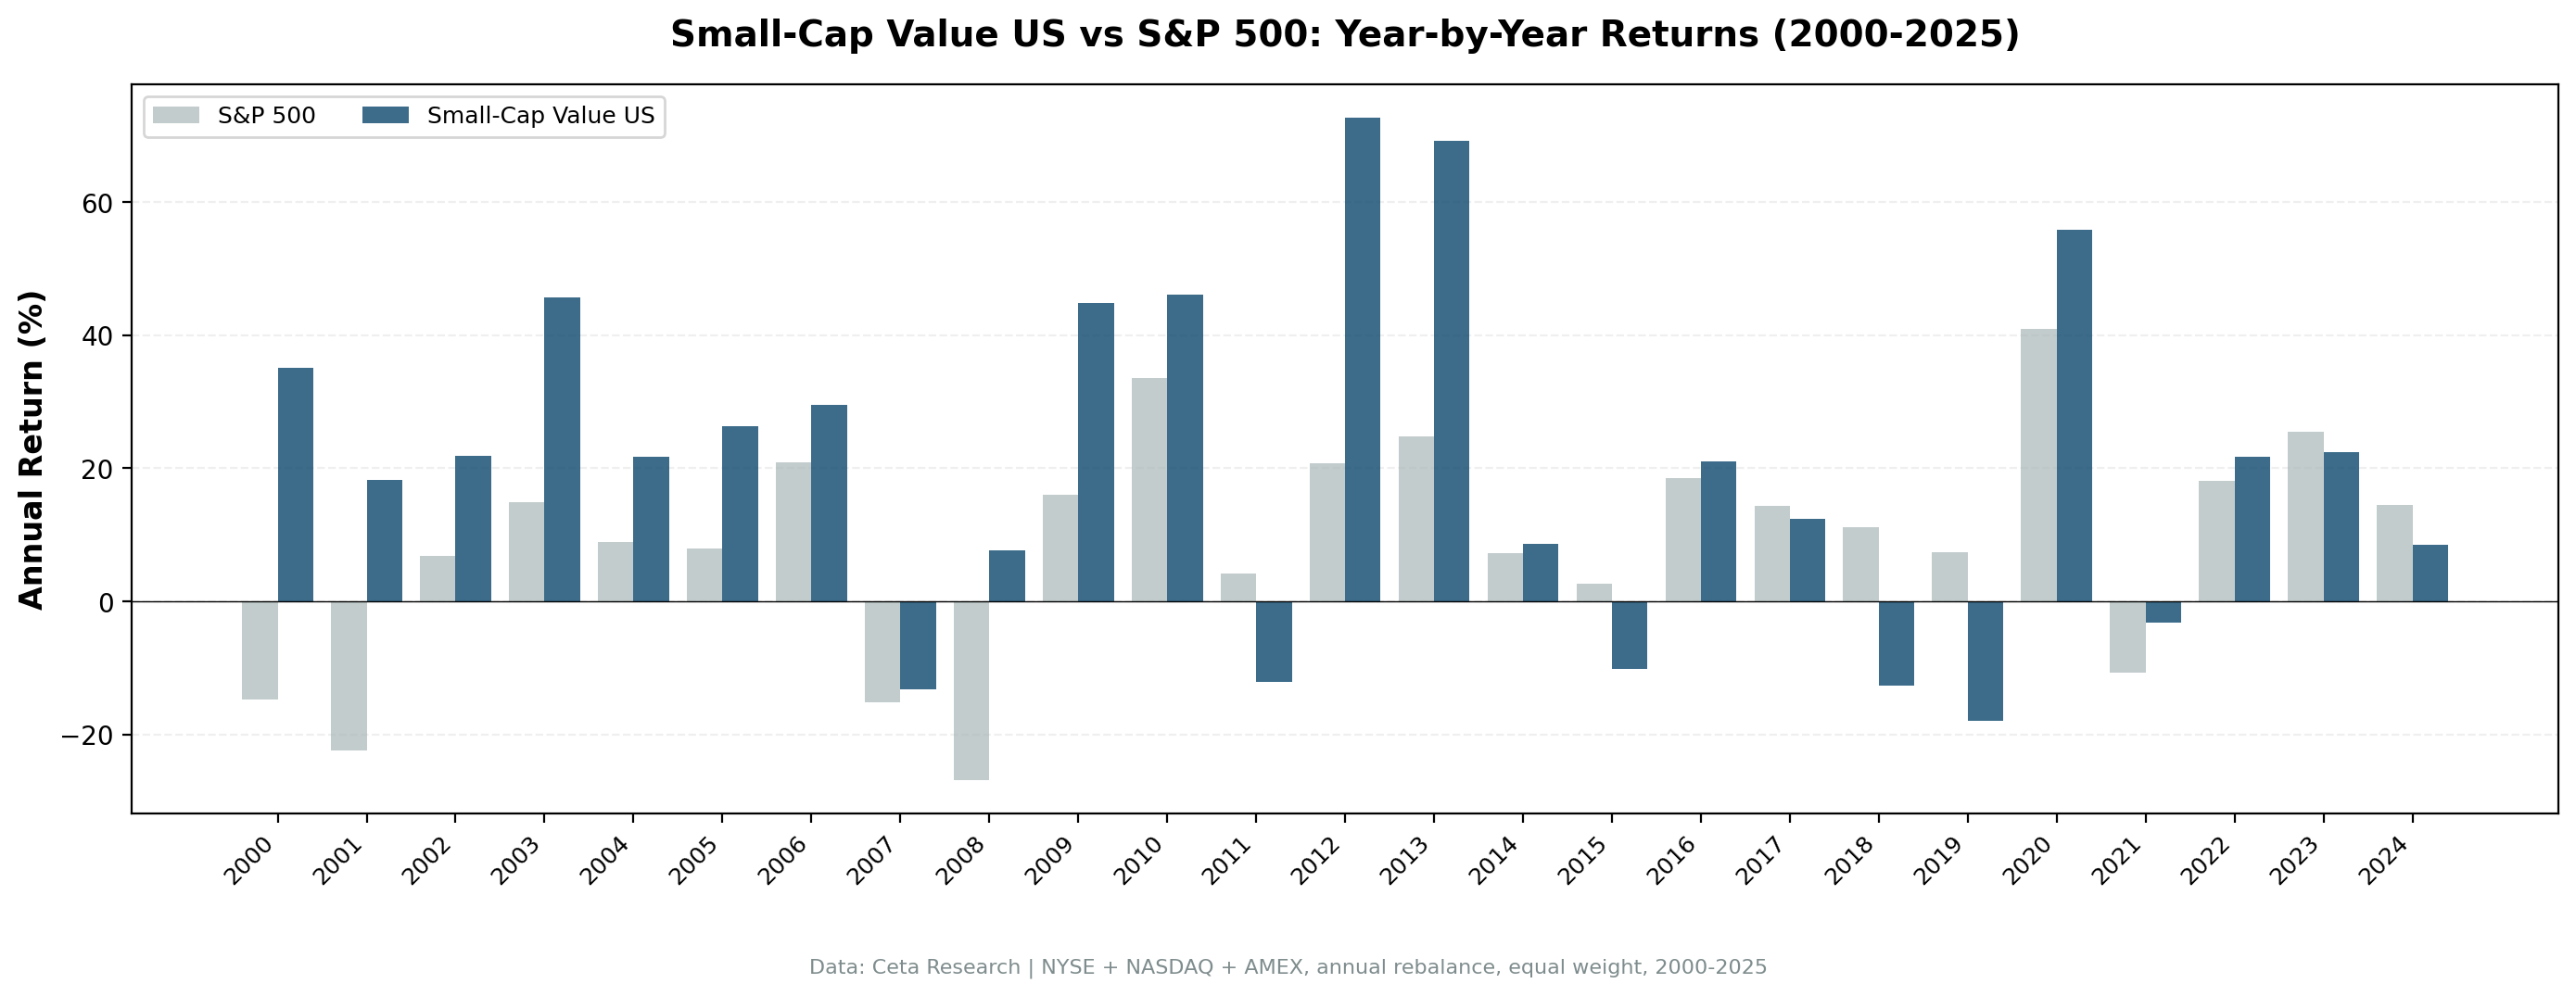
| Year | Small-Cap Value | S&P 500 | Excess |
|---|---|---|---|
| 2000 | +35.0% | -14.8% | +49.8% |
| 2001 | +18.2% | -22.4% | +40.7% |
| 2003 | +45.6% | +14.9% | +30.7% |
| 2008 | +7.7% | -26.9% | +34.6% |
| 2012 | +72.7% | +20.7% | +52.0% |
| 2013 | +69.3% | +24.7% | +44.5% |
| 2019 | -17.9% | +7.4% | -25.4% |
| 2020 | +55.8% | +41.0% | +14.9% |
The dot-com era: where small-cap value proved itself
| Year | Small-Cap Value | S&P 500 | Excess |
|---|---|---|---|
| 2000 | +35.0% | -14.8% | +49.8% |
| 2001 | +18.2% | -22.4% | +40.7% |
The S&P 500 was getting destroyed. Tech stocks with no earnings were imploding. Small-cap value stocks, trading at fractions of book value with actual profits, went the other direction. This isn't a coincidence. When the market punishes overvaluation, undervalued stocks get a tailwind. The portfolio gained 35% in 2000 while SPY lost 15%.
The 2008 financial crisis: +7.7% while SPY lost 27%
This is the single most impressive data point. The worst financial crisis since the Great Depression. Banks collapsing. Credit markets frozen. The S&P 500 lost 26.9%. Small-cap value returned +7.7%.
How? These are companies trading below book value with low leverage (D/E < 2.5). When the financial system deleverages, companies with clean balance sheets survive. The ones with P/B under 1.5 were already priced for distress. When the distress arrived, they had nowhere to fall. The overleveraged growth stocks did the falling instead.
2012: the best single year at +72.7%
The post-GFC recovery was massive for small-cap value. Companies that survived the crisis with intact businesses but depressed stock prices saw their valuations normalize. The market realized these weren't distressed. They were just cheap. The rerating was violent and fast.
2020: post-COVID small-cap rally at +55.8%
Same pattern. Crisis hits, small cheap stocks get oversold, then snap back harder than anything else. The COVID crash created extreme dislocations in small-cap value, and the recovery was equally extreme.
Where it struggles: 2019
The worst year was 2019 at -17.9% while SPY gained 7.4%. Growth-dominated markets are the strategy's weakness. When mega-cap tech drives returns, small-cap value gets left behind. But the losses are bounded. The worst single year was -17.9%. SPY's worst year was -26.9%. Even when small-cap value underperforms, the downside is more contained.
Backtest Methodology
| Parameter | Choice |
|---|---|
| Universe | NYSE + NASDAQ + AMEX, small-cap range |
| Signal | P/B 0-1.5, ROE > 5%, D/E < 2.5 |
| Portfolio | Top 30 by P/B ascending, equal weight |
| Rebalancing | Annual (July) |
| Cash rule | Hold cash if < 10 qualify |
| Execution | Next-day close (MOC) |
| Benchmark | S&P 500 Total Return (SPY) |
| Period | 2000-2025 (25 years) |
| Data | Point-in-time (45-day lag for financial statements) |
Limitations
Concentrated portfolio. 15.4 stocks on average means significant idiosyncratic risk. Single-stock blowups can materially impact returns. A 30-stock target with only 15 qualifying on average means the filters are tight. Some periods had fewer stocks and more concentration.
Size-tiered transaction costs included. Costs vary by market cap: 0.3% for stocks above $500M, 0.5% for smaller names. These are applied to all results. With annual rebalancing, the drag is approximately 0.6-1.0% annually.
Book value limitations. P/B was the original Fama-French value metric, but book value has become less meaningful as the economy shifted toward intangible assets. Tech and healthcare companies with intellectual property that doesn't appear on the balance sheet get systematically excluded.
Survivorship bias. Exchange membership uses current profiles. Delisted companies, bankruptcies, and acquisitions aren't fully tracked historically. This matters more for small caps, which delist at higher rates.
The 2012/2013 cluster. +72.7% and +69.3% in consecutive years is exceptional and unlikely to repeat. These years inflate the CAGR. Strip them out and the strategy still beats SPY comfortably, but by a smaller margin.
Takeaway
Small-cap value on US stocks delivered 18.10% CAGR over 25 years with a Sharpe ratio of 0.641 and a max drawdown of -28.29%. Those numbers are better than SPY on every dimension: higher return, lower drawdown, better risk-adjusted performance.
The strategy's edge comes from the Fama-French small-value interaction. The pure size premium may be dead, but buying cheap small caps with basic quality controls still works. The ROE > 5% filter keeps out the worst value traps. The D/E < 2.5 filter avoids overleveraged balance sheets. P/B < 1.5 identifies genuine undervaluation.
The pattern is consistent. Crash, recovery, outperformance. 2000-2001, 2008, 2020. Small-cap value thrives when the market punishes excess and rewards fundamentals. It lags during growth rallies. That's the tradeoff. If you can hold through the growth-dominated years, the math works in your favor over a full cycle.
Part of a Series
This analysis is part of our small-cap value global exchange comparison. We tested the same screen on 14 exchanges worldwide: - Small-Cap Value on Indian Stocks - 20.89% CAGR, the highest globally - Small-Cap Value on UK Stocks - Best risk-adjusted returns (0.750 Sharpe) - Small-Cap Value on Canadian Stocks - Strong returns, resource sector risk - Small-Cap Value on Taiwan Stocks - Low drawdown, steady performance - Small-Cap Value on German Stocks - Solid European result - Small-Cap Value on Swedish Stocks - Nordic small-value premium - Small-Cap Value: 14-Exchange Global Comparison - All 14 beat their local benchmark
References
- Fama, E. & French, K. (1993). "Common Risk Factors in the Returns on Stocks and Bonds." Journal of Financial Economics, 33(1), 3-56.
- Banz, R. (1981). "The Relationship Between Return and Market Value of Common Stocks." Journal of Financial Economics, 9(1), 3-18.
- Israel, R. & Moskowitz, T. (2013). "The Role of Shorting, Firm Size, and Time on Market Anomalies." Journal of Financial Economics, 108(2), 275-301.
Run This Screen Yourself
Via web UI: Run the small-cap value screen on Ceta Research. The query is pre-loaded. Hit "Run" and see what passes today.
Via Python:
import requests, time

API_KEY = "your_api_key"  # get one at cetaresearch.com
BASE = "https://api.cetaresearch.com/api/v1"

# Submit the small-cap value screen query
resp = requests.post(f"{BASE}/data-explorer/execute", headers={
    "X-API-Key": API_KEY, "Content-Type": "application/json"
}, json={
    "query": """
        SELECT k.symbol, p.companyName, p.sector,
            ROUND(f.priceToBookRatioTTM, 3) AS pb_ratio,
            ROUND(k.returnOnEquityTTM * 100, 1) AS roe_pct,
            ROUND(COALESCE(f.debtToEquityRatioTTM, 0), 2) AS de_ratio,
            ROUND(k.marketCap / 1e9, 3) AS mktcap_b
        FROM key_metrics_ttm k
        JOIN profile p ON k.symbol = p.symbol
        JOIN financial_ratios_ttm f ON k.symbol = f.symbol
        WHERE f.priceToBookRatioTTM > 0 AND f.priceToBookRatioTTM < 1.5
            AND k.returnOnEquityTTM > 0.05
            AND (f.debtToEquityRatioTTM IS NULL OR (f.debtToEquityRatioTTM >= 0 AND f.debtToEquityRatioTTM < 2.5))
            AND k.marketCap >= 50000000 AND k.marketCap <= 2000000000
            AND p.exchange IN ('NYSE', 'NASDAQ', 'AMEX')
        QUALIFY ROW_NUMBER() OVER (PARTITION BY k.symbol ORDER BY f.priceToBookRatioTTM ASC) = 1
        ORDER BY f.priceToBookRatioTTM ASC
        LIMIT 30
    """,
    "options": {"format": "json", "limit": 100}
})
task_id = resp.json()["taskId"]

# Poll until complete
while True:
    result = requests.get(f"{BASE}/tasks/data-query/{task_id}",
                          headers={"X-API-Key": API_KEY}).json()
    if result["status"] in ("completed", "failed"):
        break
    time.sleep(2)

for r in result["result"]["rows"][:10]:
    print(f"{r['symbol']:8s} P/B={r['pb_ratio']:.2f} ROE={r['roe_pct']:.1f}% D/E={r['de_ratio']:.2f}")
Get your API key at cetaresearch.com. The full backtest code (Python + DuckDB) is on GitHub.
Data: Ceta Research, FMP financial data warehouse. Universe: NYSE + NASDAQ + AMEX small caps. Annual rebalance (July), equal weight top 30, 2000-2025.
Past performance does not guarantee future results. This is educational content, not investment advice.


