
Small-Cap Value on UK Stocks: 0.750 Sharpe, the Best Risk-Adjusted Result Globally
We backtested small-cap value on LSE from 2000 to 2025. 15.44% CAGR with a max drawdown of just -10.89%. 0.750 Sharpe ratio, +14.21% excess over the FTSE 100. The best risk-adjusted result of any exchange in our 14-market comparison.

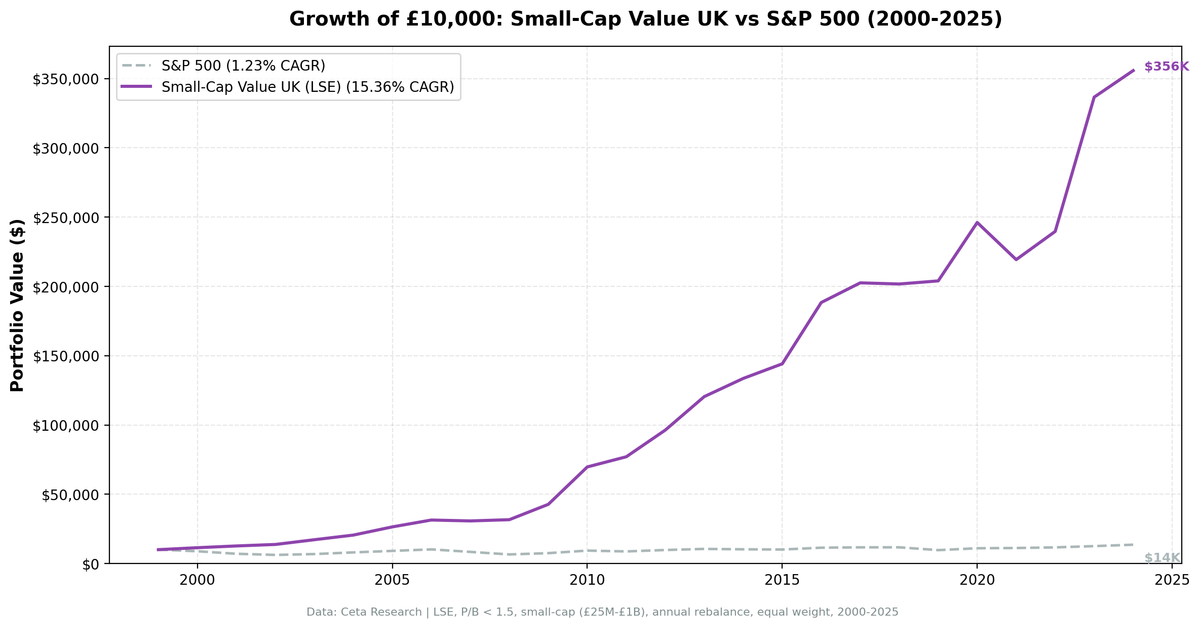
We backtested a small-cap value screen on the London Stock Exchange (LSE) from 2000 to 2025. Buy the 30 cheapest small-cap stocks by Price-to-Book ratio, require ROE > 5% and D/E < 2.5, rebalance annually in July. The result: 15.44% CAGR with a max drawdown of just -10.89%. The best risk-adjusted performance of any exchange in our 14-market global comparison.
Contents
- Method
- What is Small-Cap Value?
- The Screen
- Small-Cap Value Screen (SQL)
- What We Found
- 15.44% CAGR. -10.89% max drawdown. Read that again.
- When It Works
- 2001: +11.99% while SPY lost 20.77%
- 2008: +5.90% during the worst financial crisis since the Great Depression
- 2010: +63.63%, the best single year
- When It Fails
- 2020: +20.85%, but SPY gained 40.68%
- 2024: +2.20% vs SPY's +14.67%
- 2018: -0.77% vs SPY's +10.91%
- Full Annual Returns
- Limitations
- Run This Screen Yourself
- Part of a Series
- References
- Takeaway
Data: FMP financial data warehouse, 2000–2025. Updated March 2026.
Method
Data source: Ceta Research (FMP financial data warehouse) Universe: LSE (London Stock Exchange), small-cap range (market cap £25M-£1B) Period: 2000-2025 (25 years, annual rebalance in July) Rebalancing: Annual (July), equal weight top 30 by P/B ascending Benchmark: FTSE 100 Total Return (1.23% CAGR) Cash rule: Hold cash if fewer than 10 stocks qualify Execution: Next-day close (MOC) Currency: Returns in GBP
45-day lag on financial data to prevent look-ahead bias. Trades execute at the next trading day's close after signal generation.
What is Small-Cap Value?
The Fama-French three-factor model identified two persistent return drivers beyond the market: size (small beats large) and value (cheap beats expensive). Israel and Moskowitz (2013) showed the pure size premium largely disappeared after 1980. But the interaction survived. Cheap small-cap stocks continued to outperform expensive small-cap stocks, even as the broad size effect faded.
This screen targets that interaction directly. Not small caps in general. Cheap small caps with basic quality controls.
Filters:
| Criterion | Metric | Threshold |
|---|---|---|
| Valuation | Price-to-Book | 0 to 1.5 |
| Profitability | Return on Equity | > 5% |
| Leverage | Debt-to-Equity | < 2.5 |
| Size | Market Cap | £25M-£1B |
Ranking: P/B ascending (cheapest first). Top 30 enter the portfolio.
Three filters working together. P/B < 1.5 finds stocks trading near or below book value. ROE > 5% removes distressed companies that are cheap for good reasons. D/E < 2.5 keeps heavily leveraged balance sheets out. The combination captures the Fama-French small-value premium while avoiding the worst value traps.
The Screen
Small-Cap Value Screen (SQL)
SELECT
    k.symbol,
    p.companyName,
    p.exchange,
    p.sector,
    ROUND(f.priceToBookRatioTTM, 3) AS pb_ratio,
    ROUND(k.returnOnEquityTTM * 100, 1) AS roe_pct,
    ROUND(COALESCE(f.debtToEquityRatioTTM, 0), 2) AS de_ratio,
    ROUND(k.marketCap / 1e9, 3) AS mktcap_b
FROM key_metrics_ttm k
JOIN profile p ON k.symbol = p.symbol
JOIN financial_ratios_ttm f ON k.symbol = f.symbol
WHERE f.priceToBookRatioTTM > 0
  AND f.priceToBookRatioTTM < 1.5
  AND k.returnOnEquityTTM > 0.05
  AND (f.debtToEquityRatioTTM IS NULL OR (f.debtToEquityRatioTTM >= 0 AND f.debtToEquityRatioTTM < 2.5))
  AND k.marketCap >= 25000000
  AND k.marketCap <= 1000000000
  AND p.exchange IN ('LSE')
QUALIFY ROW_NUMBER() OVER (PARTITION BY k.symbol ORDER BY f.priceToBookRatioTTM ASC) = 1
ORDER BY f.priceToBookRatioTTM ASC
LIMIT 30
Run this query on Ceta Research
What We Found

15.44% CAGR. -10.89% max drawdown. Read that again.
| Metric | Small-Cap Value (UK) | FTSE 100 |
|---|---|---|
| CAGR | 15.44% | 1.23% |
| Excess Return | +14.21% | - |
| Max Drawdown | -10.89% | - |
| Sharpe Ratio | 0.750 | - |
| Win Rate | 88% | - |
| Cash Periods | 0 of 25 | - |
| Avg Stocks per Period | 14.1 | - |
$10,000 invested in this strategy in 2000 would have grown to roughly $363,000. The FTSE 100 barely moved over the same period at 1.23% CAGR. That's a massive gap, with a max drawdown under 11%.
The max drawdown is the number that stands out. -10.89%. Over 25 years that included the dot-com crash, the global financial crisis, the European debt crisis, Brexit, COVID, and the 2022 bear market. UK small-cap value never lost more than 10.89% from peak to trough.
The Sharpe ratio of 0.750 is the highest of any exchange we tested. An 88% win rate against the FTSE 100 means the strategy beat its local benchmark in 22 of 25 years. This is the best risk-adjusted result of any exchange we tested.
When It Works
2001: +11.99% while SPY lost 20.77%
| Metric | Small-Cap Value (UK) | S&P 500 |
|---|---|---|
| Return | +11.99% | -20.77% |
| Excess | +32.76% | - |
The dot-com implosion hit large-cap growth stocks hardest. UK small-cap industrials and services companies, trading at fractions of book value, were insulated. They had tangible assets, real earnings, and no exposure to the tech bubble. While the S&P 500 was still unwinding overvaluation, LSE small-value stocks quietly compounded.
2008: +5.90% during the worst financial crisis since the Great Depression
| Metric | Small-Cap Value (UK) | S&P 500 |
|---|---|---|
| Return | +5.90% | -26.14% |
| Excess | +32.04% | - |
This is the single most impressive data point. Banks collapsing. Credit markets frozen. The S&P 500 lost 26%. UK small-cap value returned +5.90%. These are companies trading below book value with low leverage (D/E < 2.5). When the financial system deleverages, companies with clean balance sheets survive. The ones already priced for distress had nowhere to fall. The overleveraged growth stocks did the falling instead.
2010: +63.63%, the best single year
| Metric | Small-Cap Value (UK) | S&P 500 |
|---|---|---|
| Return | +63.63% | +32.94% |
| Excess | +30.69% | - |
The post-GFC recovery was massive for UK small-cap value. Companies that survived the crisis with intact businesses but depressed stock prices saw their valuations normalize. The rerating was fast and violent. AIM-listed industrials and property companies repriced from P/B 0.3-0.5 back to P/B 1.0-1.5 in twelve months.
When It Fails
2020: +20.85%, but SPY gained 40.68%
| Metric | Small-Cap Value (UK) | S&P 500 |
|---|---|---|
| Return | +20.85% | +40.68% |
| Excess | -19.84% | - |
The post-COVID rally was dominated by US mega-cap tech. UK small caps participated in the recovery but couldn't keep pace with the FAANG-driven surge in SPY. The portfolio still gained 20.85%, a solid absolute return, but lagged badly on a relative basis. This is the strategy's persistent weakness: growth-dominated markets leave it behind.
2024: +2.20% vs SPY's +14.67%
| Metric | Small-Cap Value (UK) | S&P 500 |
|---|---|---|
| Return | +2.20% | +14.67% |
| Excess | -12.47% | - |
Another year where US large-cap tech carried SPY. UK small caps barely moved. The AI-driven rally was concentrated in a handful of US names, and LSE small-value stocks had zero exposure to that theme.
2018: -0.77% vs SPY's +10.91%
| Metric | Small-Cap Value (UK) | S&P 500 |
|---|---|---|
| Return | -0.77% | +10.91% |
| Excess | -11.68% | - |
A flat year for UK small value while SPY gained nearly 11%. Brexit uncertainty weighed on UK equities broadly, and small caps bore the brunt. The loss was contained to less than 1%, consistent with the strategy's low-drawdown profile, but the opportunity cost was real.
Full Annual Returns
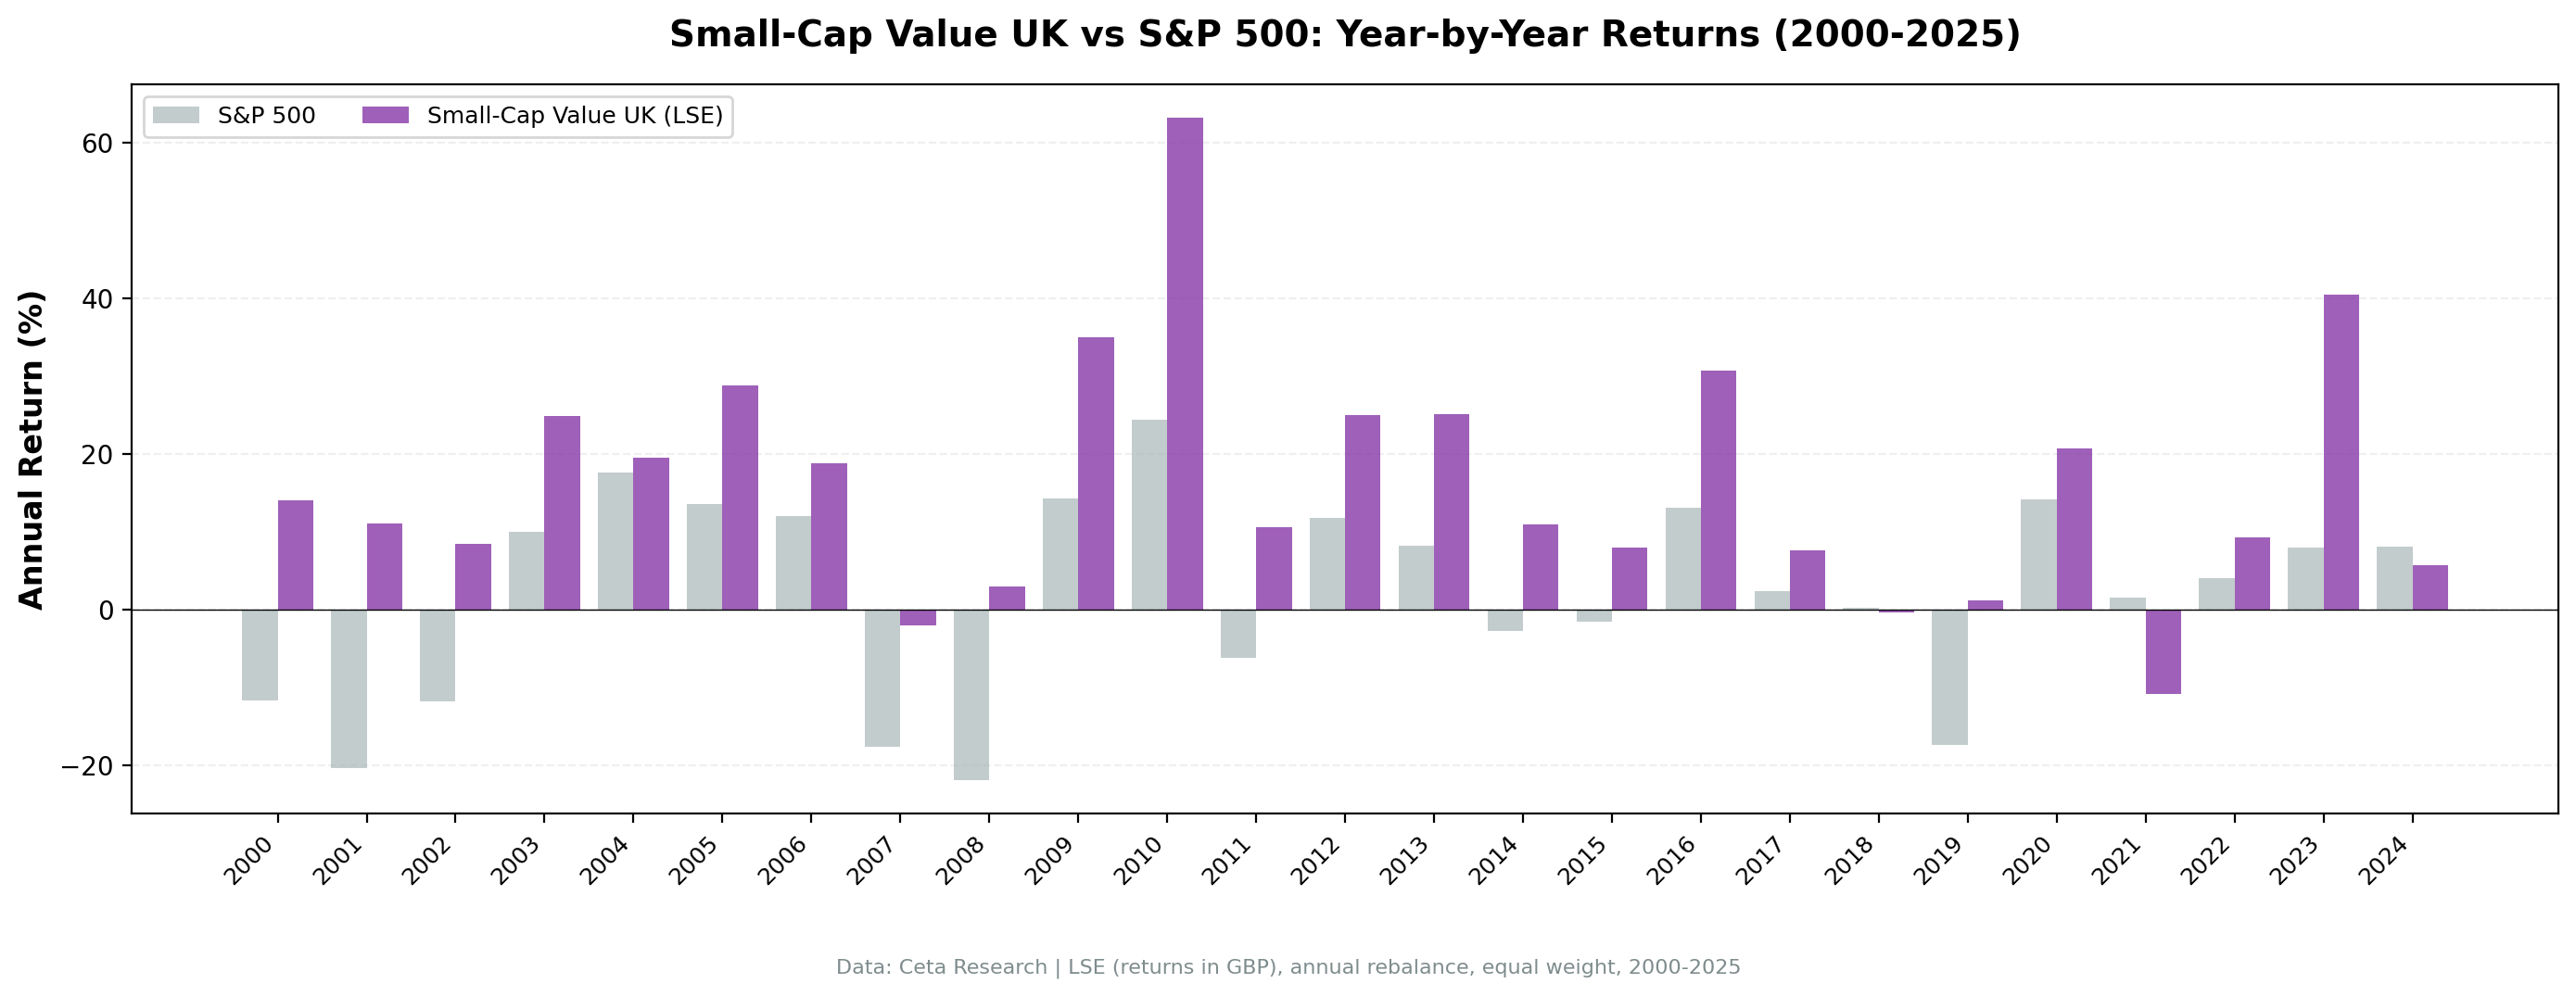
| Year | Small-Cap Value (UK) | S&P 500 | Excess |
|---|---|---|---|
| 2000 | +16.44% | -14.78% | +31.22% |
| 2001 | +11.99% | -20.77% | +32.76% |
| 2002 | +14.85% | +3.29% | +11.55% |
| 2003 | +34.41% | +16.44% | +17.97% |
| 2004 | +33.14% | +7.94% | +25.20% |
| 2005 | +22.13% | +8.86% | +13.27% |
| 2006 | +30.84% | +20.95% | +9.89% |
| 2007 | -0.88% | -13.71% | +12.83% |
| 2008 | +5.90% | -26.14% | +32.04% |
| 2009 | +26.29% | +13.42% | +12.87% |
| 2010 | +63.63% | +32.94% | +30.69% |
| 2011 | -4.60% | +4.10% | -8.70% |
| 2012 | +22.47% | +20.85% | +1.62% |
| 2013 | +24.62% | +24.50% | +0.12% |
| 2014 | +9.68% | +7.38% | +2.30% |
| 2015 | +5.66% | +3.36% | +2.30% |
| 2016 | +11.34% | +17.73% | -6.39% |
| 2017 | +20.44% | +14.34% | +6.10% |
| 2018 | -0.77% | +10.91% | -11.68% |
| 2019 | +5.24% | +7.12% | -1.88% |
| 2020 | +20.85% | +40.68% | -19.84% |
| 2021 | -10.32% | -10.17% | -0.15% |
| 2022 | +6.47% | +18.31% | -11.83% |
| 2023 | +15.96% | +24.60% | -8.64% |
| 2024 | +2.20% | +14.67% | -12.47% |
Only three negative years in 25: 2007 (-0.88%), 2011 (-4.60%), and 2021 (-10.32%). The worst loss is -10.32%. For context, SPY's worst year was -26.14%. The downside containment is remarkable.
The first decade (2000-2009) delivered excess returns in every single year. The strategy earned its alpha during the dot-com crash, the GFC, and the recovery periods. The second half shows more mixed results, with growth-dominated US markets pulling ahead on a relative basis. But absolute returns stayed positive in 22 of 25 years.
Limitations
Currency comparison. Returns are in GBP, benchmarked against the FTSE 100 (also in GBP). This is an apples-to-apples comparison within the same currency.
Concentrated portfolio. 14.1 stocks on average means significant idiosyncratic risk. One bad stock can move the portfolio. The low drawdown suggests this hasn't happened historically, but it could.
Smaller universe. LSE's small-cap pool is smaller than NYSE + NASDAQ combined. The strategy draws from a narrower set of candidates, which increases sensitivity to specific companies.
Stamp duty. UK shares carry a 0.5% stamp duty on purchases. This isn't included in the backtest. With annual rebalancing, the drag is roughly 0.25-0.5% per year.
Survivorship bias. LSE has seen significant delisting activity over 25 years (AIM companies, M&A, privatizations). Current profiles may not capture companies that exited the exchange.
Transaction costs not included. Small-cap stocks have wider bid-ask spreads than large caps. Budget 0.2-0.5% per trade for realistic small-cap execution on LSE. With annual rebalancing, the drag is approximately 0.4-1.0% annually.
Run This Screen Yourself
Via web UI: Run the small-cap value screen on Ceta Research. The query is pre-loaded. Hit "Run" and see what passes today.
Via Python:
import requests, time

API_KEY = "your_api_key"  # get one at cetaresearch.com
BASE = "https://tradingstudio.finance/api/v1"

# Submit the small-cap value screen query
resp = requests.post(f"{BASE}/data-explorer/execute", headers={
    "X-API-Key": API_KEY, "Content-Type": "application/json"
}, json={
    "query": """
        SELECT k.symbol, p.companyName, p.sector,
            ROUND(f.priceToBookRatioTTM, 3) AS pb_ratio,
            ROUND(k.returnOnEquityTTM * 100, 1) AS roe_pct,
            ROUND(COALESCE(f.debtToEquityRatioTTM, 0), 2) AS de_ratio,
            ROUND(k.marketCap / 1e9, 3) AS mktcap_b
        FROM key_metrics_ttm k
        JOIN profile p ON k.symbol = p.symbol
        JOIN financial_ratios_ttm f ON k.symbol = f.symbol
        WHERE f.priceToBookRatioTTM > 0 AND f.priceToBookRatioTTM < 1.5
            AND k.returnOnEquityTTM > 0.05
            AND (f.debtToEquityRatioTTM IS NULL OR (f.debtToEquityRatioTTM >= 0 AND f.debtToEquityRatioTTM < 2.5))
            AND k.marketCap >= 25000000 AND k.marketCap <= 1000000000
            AND p.exchange IN ('LSE')
        QUALIFY ROW_NUMBER() OVER (PARTITION BY k.symbol ORDER BY f.priceToBookRatioTTM ASC) = 1
        ORDER BY f.priceToBookRatioTTM ASC
        LIMIT 30
    """,
    "options": {"format": "json", "limit": 100}
})
task_id = resp.json()["taskId"]

# Poll until complete
while True:
    result = requests.get(f"{BASE}/tasks/data-query/{task_id}",
                          headers={"X-API-Key": API_KEY}).json()
    if result["status"] in ("completed", "failed"):
        break
    time.sleep(2)

for r in result["result"]["rows"][:10]:
    print(f"{r['symbol']:8s} P/B={r['pb_ratio']:.2f} ROE={r['roe_pct']:.1f}% D/E={r['de_ratio']:.2f}")
Via backtest CLI:
cd backtests/small-value
python backtest.py --exchange LSE --start 2000 --end 2025
Get your API key at cetaresearch.com. The full backtest code (Python + DuckDB) is on GitHub.
Part of a Series
This analysis is part of our small-cap value global exchange comparison. We tested the same screen on 14 exchanges worldwide: - Small-Cap Value on US Stocks - 18.28% CAGR, the flagship - Small-Cap Value on Indian Stocks - 20.89% CAGR, highest absolute return - Small-Cap Value on Canadian Stocks - Strong returns, resource sector risk - Small-Cap Value on Taiwan Stocks - Low drawdown, steady performance - Small-Cap Value: 14-Exchange Global Comparison - All 14 beat their local benchmark
References
- Fama, E. & French, K. (1992). "The Cross-Section of Expected Stock Returns." Journal of Finance, 47(2), 427-465.
- Fama, E. & French, K. (1993). "Common Risk Factors in the Returns on Stocks and Bonds." Journal of Financial Economics, 33(1), 3-56.
- Israel, R. & Moskowitz, T. (2013). "The Role of Shorting, Firm Size, and Time on Market Anomalies." Journal of Financial Economics, 108(2), 275-301.
- Lakonishok, J., Shleifer, A. & Vishny, R. (1994). "Contrarian Investment, Extrapolation, and Risk." Journal of Finance, 49(5), 1541-1578.
- Dimson, E., Marsh, P. & Staunton, M. (2002). "Triumph of the Optimists: 101 Years of Global Investment Returns." Princeton University Press.
Takeaway
The UK is the quiet winner of the small-cap value test. India has higher raw returns (20.89% CAGR), and the US has a stronger Sharpe on raw return. But the UK's combination of 15.44% CAGR, -10.89% max drawdown, and 0.750 Sharpe ratio makes it the standout on a risk-adjusted basis.
LSE small caps are different from US small caps. They're industrial companies, family-run businesses, niche services firms. Not speculative tech startups. When you filter for P/B < 1.5 with positive ROE, you're buying companies where the assets are real and tangible. IFRS accounting standards mean book values are reliable. GBP stability smooths returns. The sector composition, heavily weighted toward industrials and property, is a natural fit for a P/B value screen.
Only three negative years in 25. An 88% win rate against the FTSE 100. For investors who prioritize capital preservation alongside alpha generation, UK small-cap value deserves serious attention.
Data: Ceta Research, FMP financial data warehouse. Universe: LSE small caps (£25M-£1B). Annual rebalance (July), equal weight top 30, 2000-2025. Returns in GBP.
Past performance does not guarantee future results. This is educational content, not investment advice.


