
Small-Cap Value on Swedish Stocks: 11.70% CAGR with Post-Crisis Recoveries That Rival Any Market
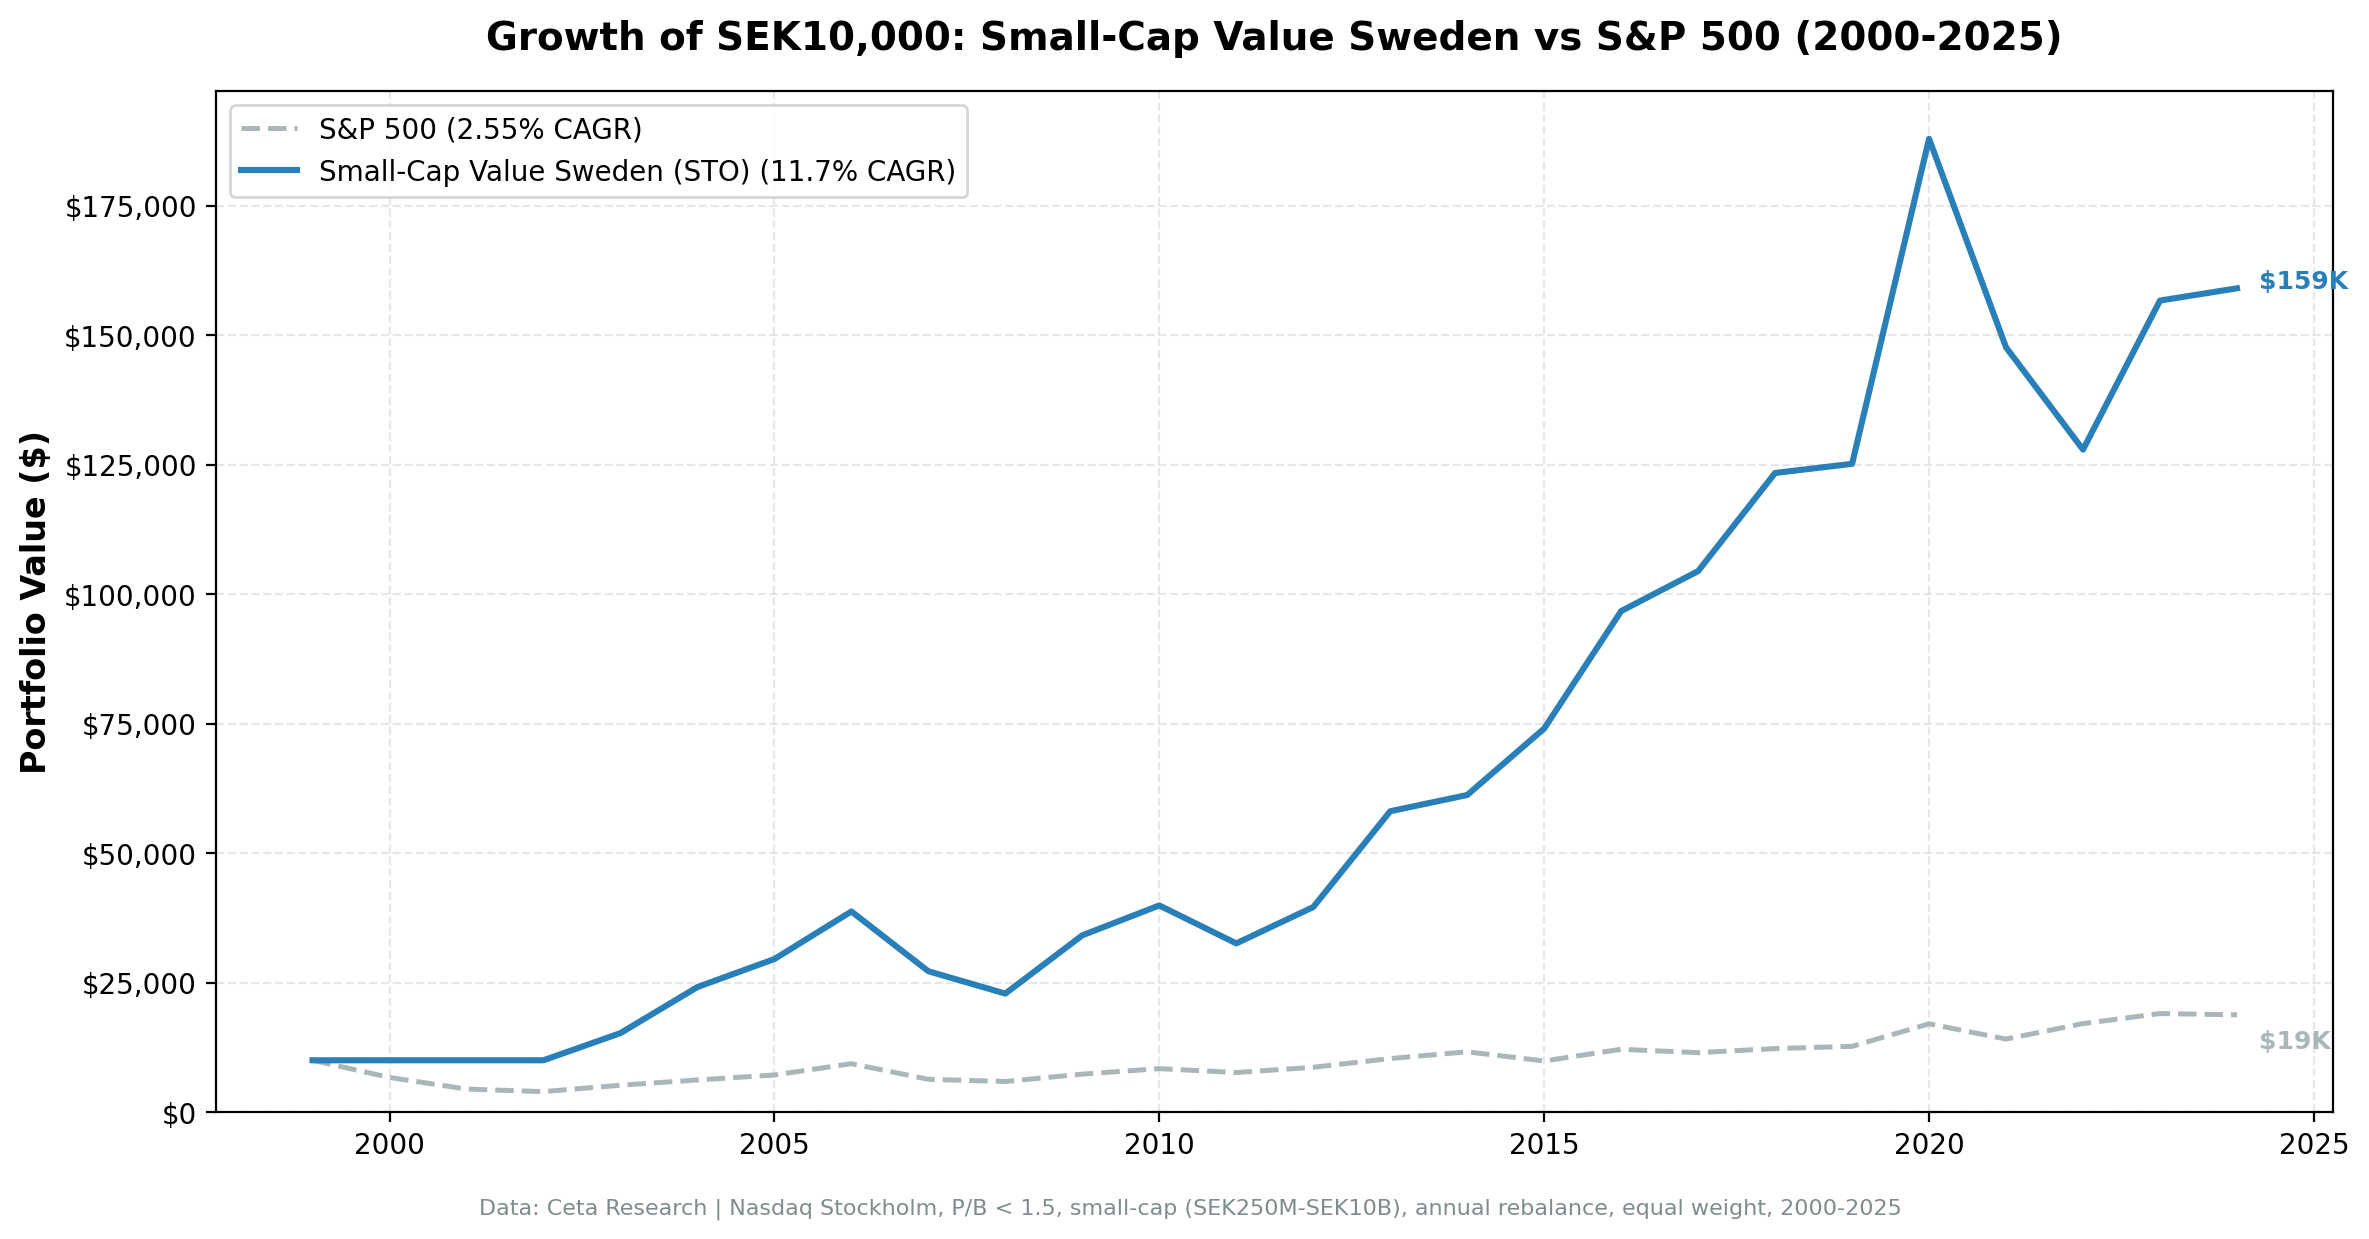
We backtested small-cap value on Nasdaq Stockholm from 2000 to 2025. 11.70% CAGR, +9.15% over the OMX Stockholm 30. Post-crisis recoveries are explosive, but the -40.95% max drawdown is real.


We backtested a small-cap value screen on Nasdaq Stockholm (STO) from 2000 to 2025. Buy the 30 cheapest small-cap stocks by Price-to-Book ratio, require ROE > 5% and D/E < 2.5, rebalance annually in July. The result: 11.70% CAGR with +9.15% annual excess over the OMX Stockholm 30. Sweden's strength is in the recoveries. The worst years are rough, but the snapbacks more than compensate.
Contents
- Method
- What is Small-Cap Value?
- What We Found
- 11.70% CAGR. +9.15% excess over the OMX Stockholm 30. The Nordic small-value premium is real, but volatile.
- Year-by-year returns
- Why Sweden works (and why it's volatile)
- When It Works
- Best excess return years
- When It Fails
- Worst excess return years
- Full Annual Returns
- Backtest Methodology
- Limitations
- Run It Yourself
- Small-Cap Value Screen (SQL)
- Backtest command
- Part of a Series
- Takeaway
- References
Data: FMP financial data warehouse, 2000–2025. Updated March 2026.
Method
Data source: Ceta Research (FMP financial data warehouse) Universe: STO (Nasdaq Stockholm), small-cap range (market cap 5-200% of exchange threshold) Period: 2000-2025 (25 years, annual rebalance in July) Rebalancing: Annual (July), equal weight top 30 by P/B ascending Benchmark: OMX Stockholm 30 Total Return (2.55% CAGR) Cash rule: Hold cash if fewer than 10 stocks qualify Execution: Next-day close (MOC) Currency: Returns in SEK
45-day lag on financial data to prevent look-ahead bias. Trades execute at the next trading day's close after signal generation.
What is Small-Cap Value?
The Fama-French small-value interaction targets cheap small-cap stocks with basic quality controls. The pure size premium largely disappeared after 1980, but the cheapest small caps continue to outperform the most expensive small caps. This screen captures that premium.
Filters:
| Criterion | Metric | Threshold |
|---|---|---|
| Valuation | Price-to-Book | 0 to 1.5 |
| Profitability | Return on Equity | > 5% |
| Leverage | Debt-to-Equity | < 2.5 |
| Size | Market Cap | Small-cap range (SEK 250M-10B) |
Ranking: P/B ascending, top 30 stocks.
What We Found
11.70% CAGR. +9.15% excess over the OMX Stockholm 30. The Nordic small-value premium is real, but volatile.
| Metric | Small-Cap Value (Sweden) | OMX Stockholm 30 |
|---|---|---|
| CAGR | 11.70% | 2.55% |
| Excess Return | +9.15% | - |
| Max Drawdown | -40.95% | - |
| Sharpe Ratio | 0.391 | - |
| Win Rate | 76% | - |
| Avg Stocks per Period | 23.6 | - |
| Cash Periods | 3 of 25 (12%) | - |
The CAGR beats the OMX Stockholm 30 by 9.15% per year. That's a massive premium over the local benchmark. But the max drawdown at -40.95% is deep. The Sharpe ratio of 0.391 reflects the cost of that volatility. The 76% win rate against the OMX 30 is encouraging, meaning the strategy beats its local benchmark in three out of four years.
The strategy was in cash for 3 of 25 periods (2000-2002) due to early data coverage gaps. From 2003 onward, the portfolio averaged 23+ stocks per period.
Year-by-year returns
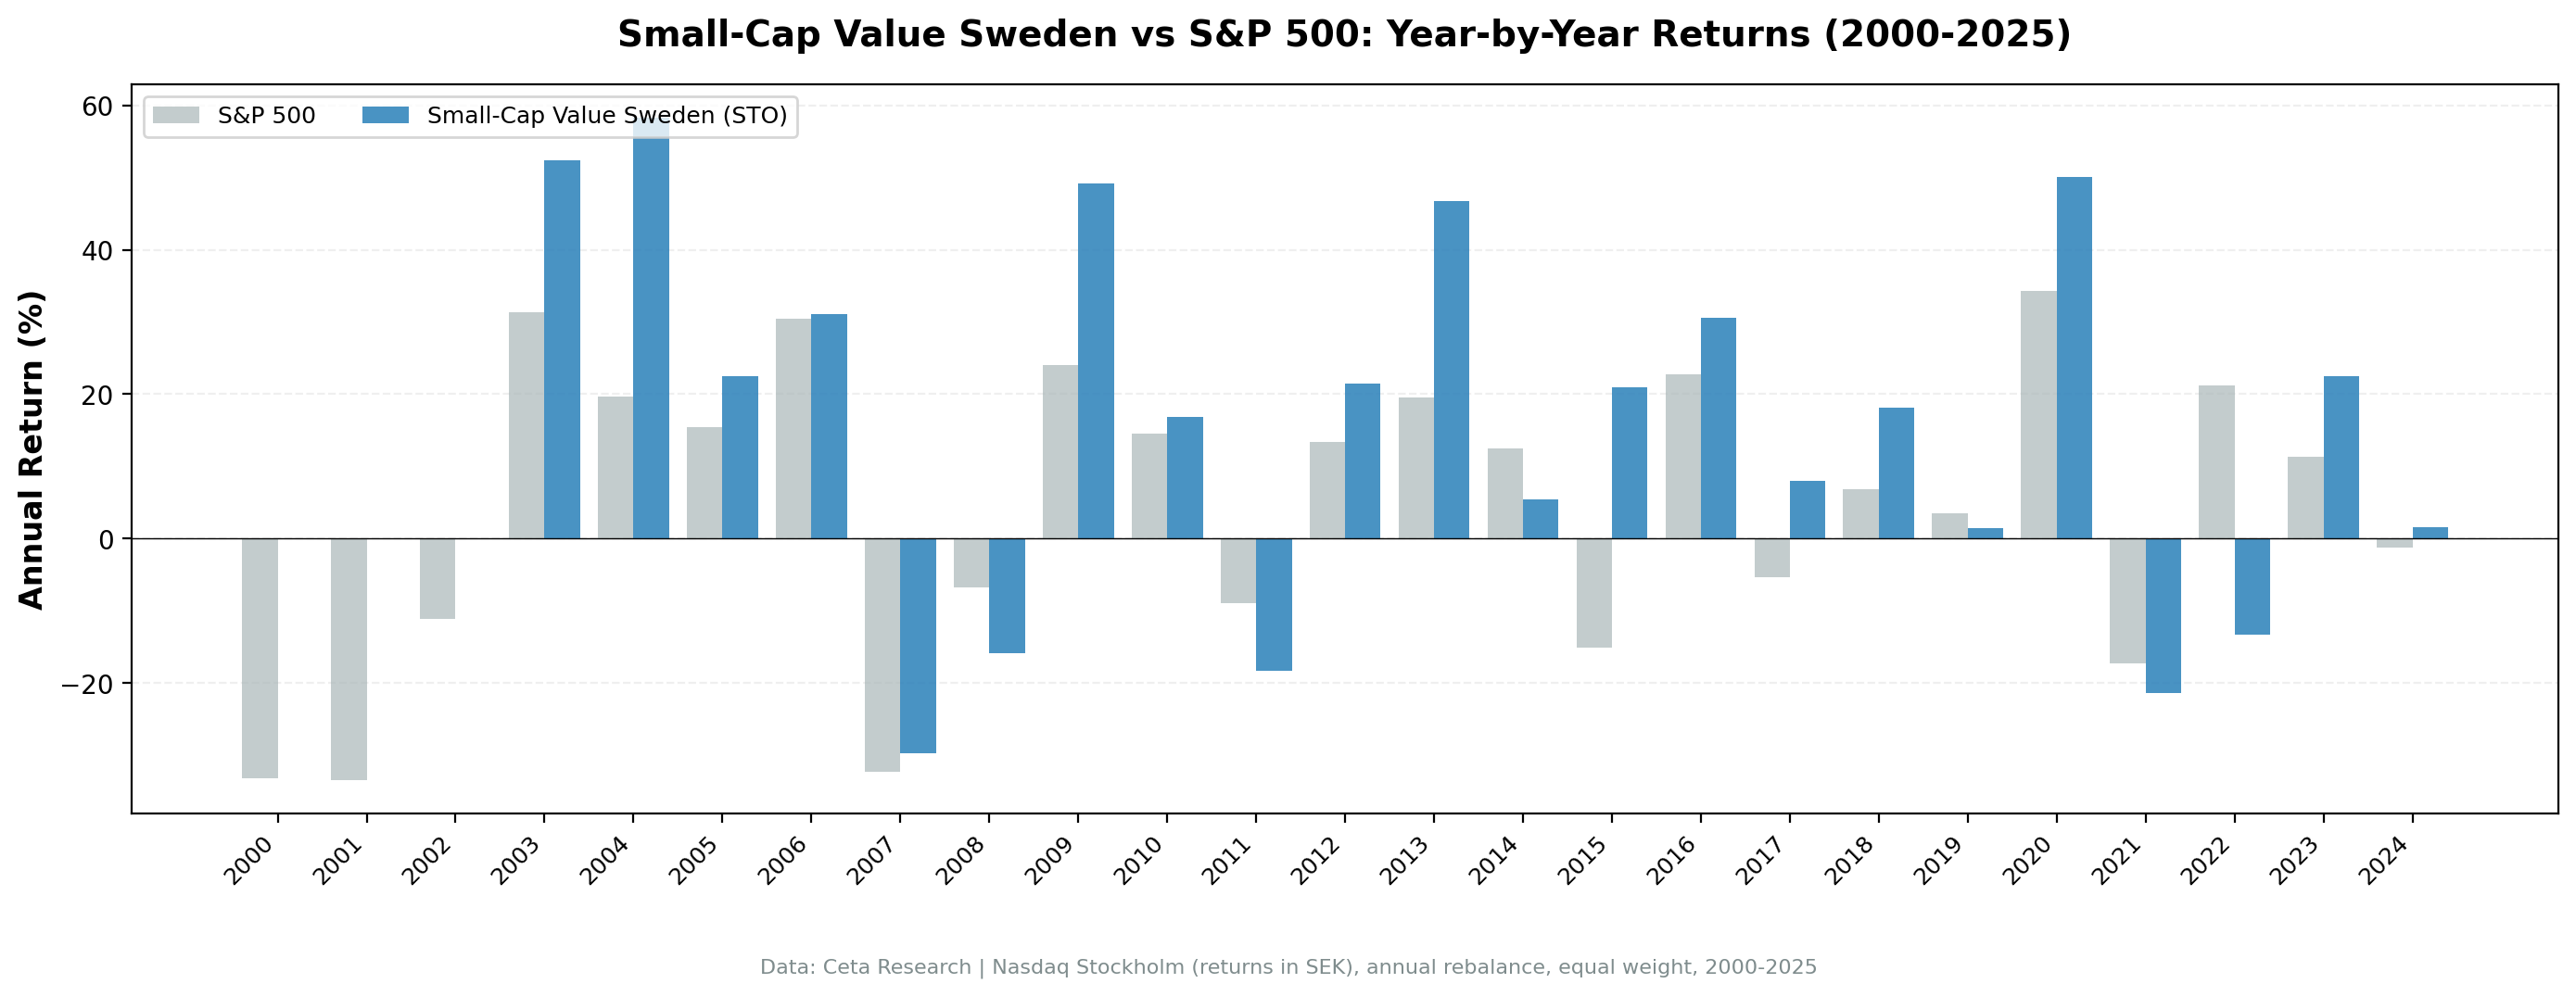
Sweden's return pattern is feast or famine. The best years are spectacular. The worst years are painful. But a 76% win rate against the OMX Stockholm 30 shows the strategy beats its local benchmark consistently.
Why Sweden works (and why it's volatile)
Nasdaq Stockholm has a deep small-cap ecosystem. Sweden lists more companies per capita than almost any country. The Stockholm exchange has a massive pool of small-cap names, from niche industrials to healthcare startups to specialized tech firms. The screen finds 23+ qualifying stocks in most years.
Swedish small caps are globally exposed. Many Stockholm-listed small caps earn the majority of their revenue outside Sweden. They're small by market cap but global by operations. This creates a sensitivity to global trade cycles and currency movements that amplifies both gains and losses.
SEK adds volatility. The Swedish krona is one of the more volatile developed market currencies. When SEK weakens, export revenues get inflated in local terms. When it strengthens, they compress. This currency overlay affects absolute returns but not the comparison with the OMX Stockholm 30 (also in SEK).
Upside capture is strong (135.34%), but downside capture is too high (76.78%). Compare this to Germany's 46.48% downside capture. Sweden participates heavily in both rallies and selloffs. The asymmetry is less favorable.
When It Works
Sweden's best years are post-crisis recoveries where small-cap value gets a massive rerating.
Best excess return years
| Year | Small-Cap Value | SPY | Excess | Context |
|---|---|---|---|---|
| 2004 | +56.98% | +7.94% | +49.04% | Post-dot-com recovery, Nordic industrial boom |
| 2003 | +54.64% | +16.44% | +38.20% | First year invested, massive catch-up |
| 2009 | +45.94% | +13.42% | +32.52% | Post-GFC recovery |
2004 stands out: +57% return while SPY gained 8%. Swedish small-cap value stocks were deeply compressed after the 2001-2002 downturn. The recovery was explosive. Nordic industrial companies with export exposure benefited from the global trade rebound, and the cheapest names rerated fastest.
2021 deserves mention too: +42.42% vs SPY's -10.17%, a +52.59% excess. Swedish small caps rallied hard while US large caps pulled back. That kind of divergence is rare and reflects how different the underlying exposures are.
When It Fails
The strategy's worst years happen when European small caps lag a US-led rally, or when global risk aversion hits Nordic markets harder than the US.
Worst excess return years
| Year | Small-Cap Value | SPY | Excess | Context |
|---|---|---|---|---|
| 2022 | -13.11% | +18.31% | -31.42% | Rising rates, European energy crisis, SEK weakness |
| 2011 | -18.29% | +4.10% | -22.39% | European debt crisis, Nordic banks under pressure |
| 2007 | -29.47% | -13.71% | -15.75% | Pre-GFC, credit tightening hit small caps first |
2022 was the worst relative year. European small caps got crushed by the energy crisis, rising ECB rates, and a weakening SEK. SPY gained 18% while the Swedish portfolio lost 13%. That's a 31-point gap in a single year. The -40.95% max drawdown likely includes this period combined with the 2007 selloff.
2011 is the European debt crisis showing up in Nordic markets. Swedish banks had exposure to Baltic economies, and contagion fears dragged small caps down while SPY posted a modest gain. The -18.29% loss wasn't catastrophic in absolute terms, but the relative gap hurt.
2007 is instructive. Both the strategy and SPY lost money, but Swedish small caps fell nearly 30% while SPY lost 14%. Small caps in Sweden started pricing the credit crisis earlier than US large caps, and the losses were sharper.
Full Annual Returns
| Year | Small-Cap Value (Sweden) | S&P 500 | Excess |
|---|---|---|---|
| 2000 | 0.00% | -14.78% | +14.78% |
| 2001 | 0.00% | -20.77% | +20.77% |
| 2002 | 0.00% | +3.29% | -3.29% |
| 2003 | +54.64% | +16.44% | +38.20% |
| 2004 | +56.98% | +7.94% | +49.04% |
| 2005 | +12.07% | +8.86% | +3.21% |
| 2006 | +16.80% | +20.95% | -4.15% |
| 2007 | -29.47% | -13.71% | -15.75% |
| 2008 | -20.48% | -26.14% | +5.66% |
| 2009 | +45.94% | +13.42% | +32.52% |
| 2010 | +35.95% | +32.94% | +3.01% |
| 2011 | -18.29% | +4.10% | -22.39% |
| 2012 | +8.55% | +20.85% | -12.31% |
| 2013 | +32.26% | +24.50% | +7.76% |
| 2014 | +5.55% | +7.38% | -1.83% |
| 2015 | -1.54% | +3.36% | -4.90% |
| 2016 | +30.00% | +17.73% | +12.27% |
| 2017 | +14.38% | +14.34% | +0.04% |
| 2018 | -5.06% | +10.91% | -15.96% |
| 2019 | +21.35% | +7.12% | +14.23% |
| 2020 | +36.42% | +40.68% | -4.26% |
| 2021 | +42.42% | -10.17% | +52.59% |
| 2022 | -13.11% | +18.31% | -31.42% |
| 2023 | +7.87% | +24.60% | -16.73% |
| 2024 | +10.30% | +14.67% | -4.37% |
Win rate: 76% of years beat the OMX Stockholm 30.
Backtest Methodology
| Parameter | Choice |
|---|---|
| Universe | STO (Nasdaq Stockholm), small-cap range (SEK 250M-10B) |
| Signal | P/B 0-1.5, ROE > 5%, D/E < 2.5 |
| Portfolio | Top 30 by P/B ascending, equal weight |
| Rebalancing | Annual (July) |
| Cash rule | Hold cash if < 10 qualify |
| Benchmark | OMX Stockholm 30 Total Return |
| Execution | Next-day close (MOC) |
| Period | 2000-2025 (25 years) |
| Data | Point-in-time (45-day lag) |
Limitations
Max drawdown is deep. -40.95% is a significant drawdown. Investors need to accept that the higher CAGR comes with deeper valleys.
Same-currency comparison. Returns in SEK, benchmarked against the OMX Stockholm 30 (also in SEK). This is an apples-to-apples comparison.
European crisis sensitivity. Swedish small caps correlate with European macro conditions. The 2011 debt crisis and 2022 energy crisis both produced large drawdowns. Investors in Swedish small-cap value are implicitly taking European macro risk.
76% win rate. The strategy beats the OMX Stockholm 30 in three out of four years. That consistency is encouraging, even though the losing years can be large.
Survivorship bias. Nasdaq Stockholm has seen delistings, particularly among smaller names that don't survive cyclical downturns. Current profiles may overstate historical performance.
Run It Yourself
Small-Cap Value Screen (SQL)
SELECT
    k.symbol,
    p.companyName,
    p.sector,
    ROUND(f.priceToBookRatioTTM, 3) AS pb_ratio,
    ROUND(k.returnOnEquityTTM * 100, 1) AS roe_pct,
    ROUND(COALESCE(f.debtToEquityRatioTTM, 0), 2) AS de_ratio,
    ROUND(k.marketCap / 1e9, 3) AS mktcap_b
FROM key_metrics_ttm k
JOIN profile p ON k.symbol = p.symbol
JOIN financial_ratios_ttm f ON k.symbol = f.symbol
WHERE f.priceToBookRatioTTM > 0
  AND f.priceToBookRatioTTM < 1.5
  AND k.returnOnEquityTTM > 0.05
  AND (f.debtToEquityRatioTTM IS NULL OR (f.debtToEquityRatioTTM >= 0 AND f.debtToEquityRatioTTM < 2.5))
  AND k.marketCap >= 250000000
  AND k.marketCap <= 10000000000
  AND p.exchange = 'STO'
QUALIFY ROW_NUMBER() OVER (PARTITION BY k.symbol ORDER BY f.priceToBookRatioTTM ASC) = 1
ORDER BY f.priceToBookRatioTTM ASC
LIMIT 30
Run this query on Ceta Research
Backtest command
python backtest.py --preset sto --start 2000 --end 2025
Get your API key at cetaresearch.com. The full backtest code (Python + DuckDB) is on GitHub.
Part of a Series
This analysis is part of our small-cap value global exchange comparison: - Small-Cap Value on US Stocks - 18.28% CAGR, the flagship result - Small-Cap Value on German Stocks - 11.45% CAGR, Mittelstand premium - Small-Cap Value on UK Stocks - Best risk-adjusted (0.750 Sharpe) - Small-Cap Value: 14-Exchange Global Comparison - All 14 beat their local benchmark
Takeaway
Sweden is the high-volatility version of European small-cap value. 11.70% CAGR, +9.15% excess over the OMX Stockholm 30, but with a -40.95% max drawdown. The strategy wins because the good years are much larger than the bad years, and the 76% win rate against the local benchmark shows it delivers consistently.
The post-crisis recoveries are where the returns get made. 2003-2004 delivered back-to-back years of +55% and +57%. 2009 added another +46%. 2021 produced +42% while SPY declined. These explosive rebounds, all in small-cap value stocks repricing from compressed valuations, drive the long-term outperformance.
The -40.95% max drawdown means this isn't a comfortable strategy. It requires conviction through the painful years. For investors who can hold through the bad years, the math works. For those who can't, Germany or the UK offer better risk-adjusted alternatives within Europe.
References
- Fama, E. & French, K. (1992). "The Cross-Section of Expected Stock Returns." Journal of Finance, 47(2), 427-465.
- Fama, E. & French, K. (1993). "Common Risk Factors in the Returns on Stocks and Bonds." Journal of Financial Economics, 33(1), 3-56.
- Israel, R. & Moskowitz, T. (2013). "The Role of Shorting, Firm Size, and Time on Market Anomalies." Journal of Financial Economics, 108(2), 275-301.
- Lakonishok, J., Shleifer, A. & Vishny, R. (1994). "Contrarian Investment, Extrapolation, and Risk." Journal of Finance, 49(5), 1541-1578.
Data: Ceta Research, FMP financial data warehouse. Universe: STO small caps (SEK 250M-10B). Annual rebalance (July), equal weight top 30, 2000-2025. Returns in SEK.
Past performance does not guarantee future results. This is educational content, not investment advice.


