
Small-Cap Value on Canadian Stocks: 13.21% CAGR, but -48% Drawdown Tells the Real Story
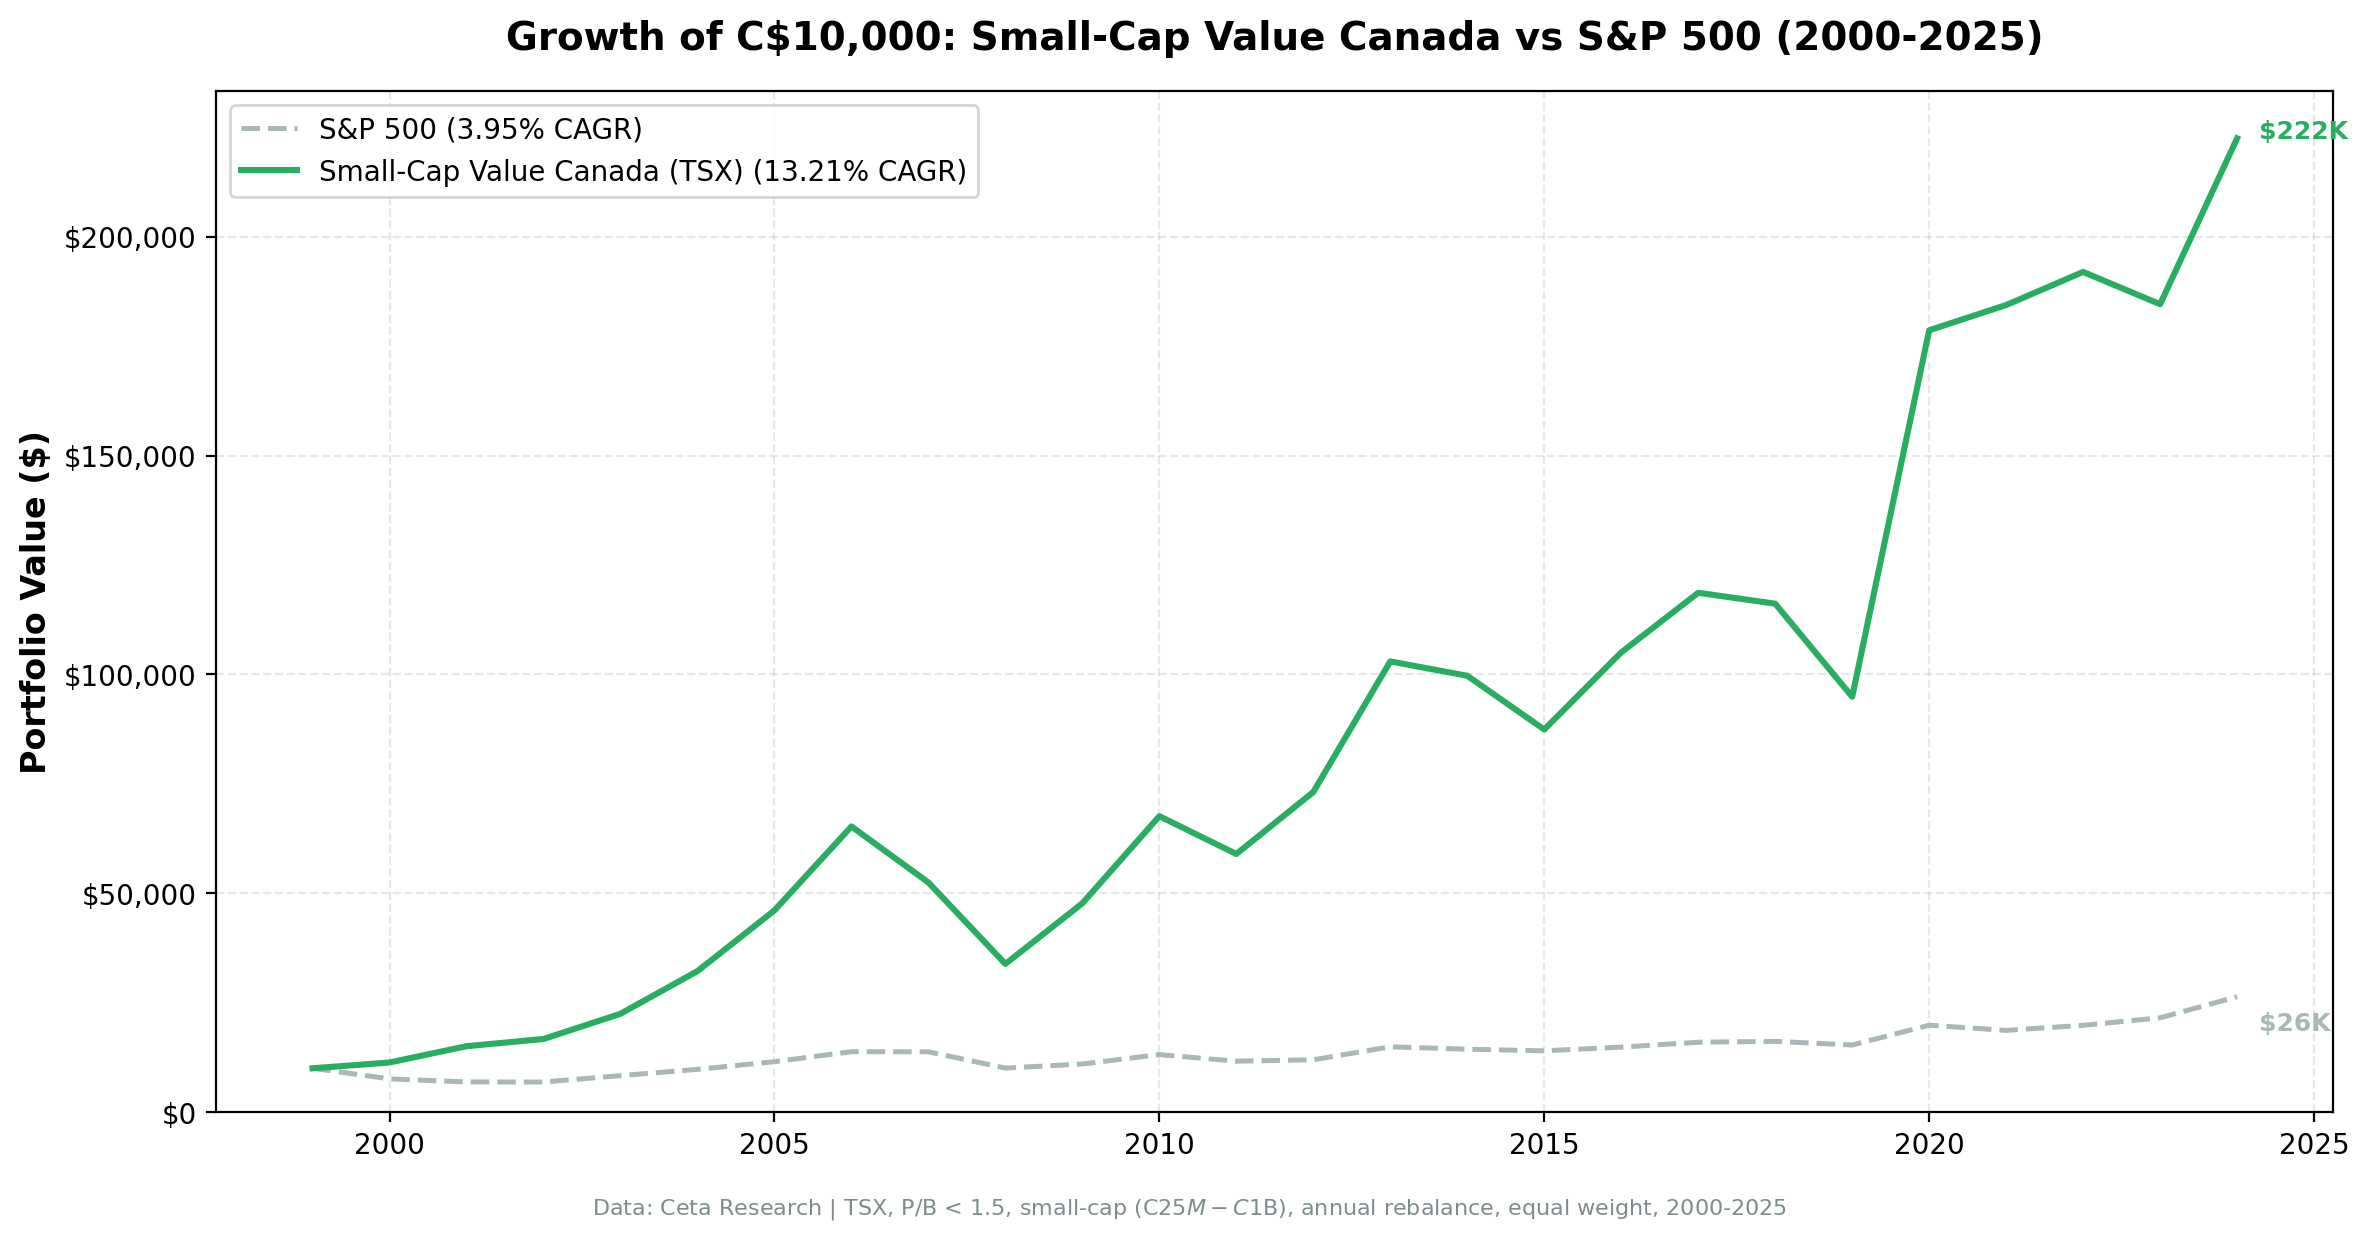
We backtested small-cap value on TSX from 2000 to 2025. 13.21% CAGR, +9.26% over the TSX Composite. But -48.13% max drawdown reveals heavy resource sector exposure. The highest-risk version of the strategy in our 14-exchange comparison.

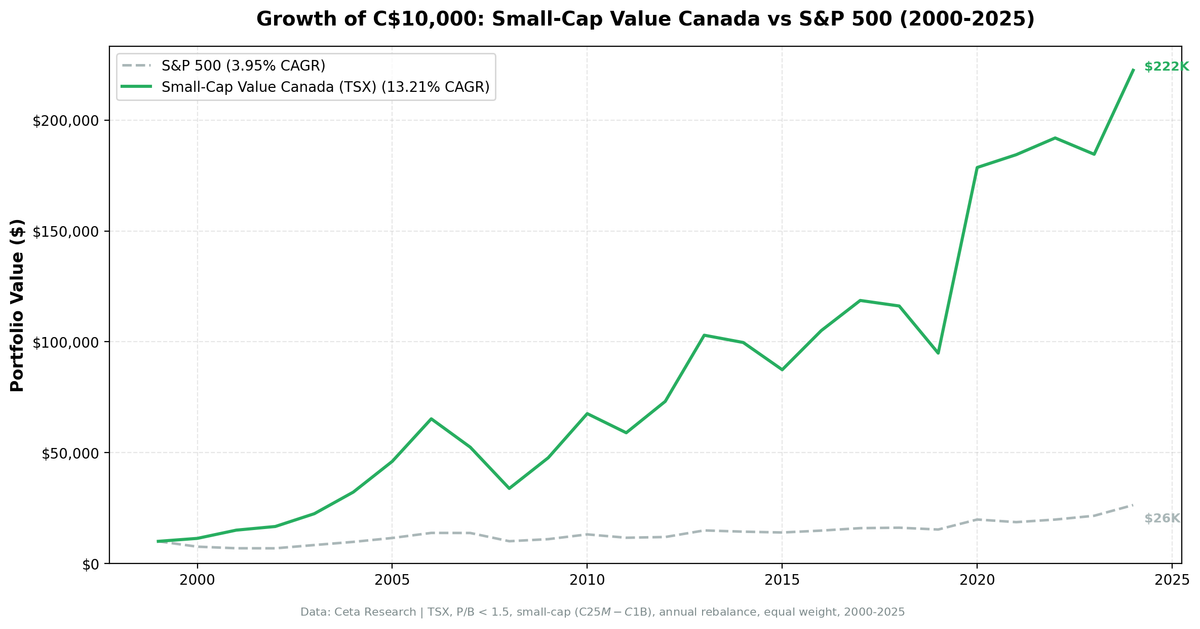
We backtested a small-cap value screen on the Toronto Stock Exchange (TSX) from 2000 to 2025. Buy the 30 cheapest small-cap stocks by Price-to-Book ratio, require ROE > 5% and D/E < 2.5, rebalance annually in July. The result: 13.21% CAGR vs 3.95% for the TSX Composite. Strong outperformance (+9.26% excess), but a -48.13% max drawdown driven by resource sector concentration makes this the highest-risk version of the strategy across all exchanges we tested.
Contents
- Method
- What is Small-Cap Value?
- The Screen
- Small-Cap Value Screen (SQL)
- What We Found
- 13.21% CAGR, but -48.13% max drawdown.
- When It Works
- 2001: +33.78% while SPY lost 20.77%
- 2020: +88.25%, the COVID recovery
- 2005: +43.06%, the commodity boom
- When It Fails
- 2023: -3.84% vs SPY's +24.60%
- 2019: -18.31% vs SPY's +7.12%
- 2011: -12.77% vs SPY's +4.10%
- Full Annual Returns
- Limitations
- Run This Screen Yourself
- Part of a Series
- Takeaway
- References
Data: FMP financial data warehouse, 2000–2025. Updated March 2026.
Method
Data source: Ceta Research (FMP financial data warehouse) Universe: TSX (Toronto Stock Exchange), small-cap range (market cap C$25M-C$1B) Period: 2000-2025 (25 years, annual rebalance in July) Rebalancing: Annual (July), equal weight top 30 by P/B ascending Benchmark: TSX Composite Total Return (3.95% CAGR) Cash rule: Hold cash if fewer than 10 stocks qualify Execution: Next-day close (MOC) Currency: Returns in CAD
45-day lag on financial data to prevent look-ahead bias. Trades execute at the next trading day's close after signal generation.
What is Small-Cap Value?
The Fama-French three-factor model identified two persistent return drivers beyond the market: size (small beats large) and value (cheap beats expensive). Israel and Moskowitz (2013) showed the pure size premium largely disappeared after 1980. But the interaction survived. Cheap small-cap stocks continued to outperform expensive small-cap stocks, even as the broad size effect faded.
This screen targets that interaction directly. Not small caps in general. Cheap small caps with basic quality controls.
Filters:
| Criterion | Metric | Threshold |
|---|---|---|
| Valuation | Price-to-Book | 0 to 1.5 |
| Profitability | Return on Equity | > 5% |
| Leverage | Debt-to-Equity | < 2.5 |
| Size | Market Cap | C$25M-C$1B |
Ranking: P/B ascending (cheapest first). Top 30 enter the portfolio.
Three filters working together. P/B < 1.5 finds stocks trading near or below book value. ROE > 5% removes distressed companies that are cheap for good reasons. D/E < 2.5 keeps heavily leveraged balance sheets out. On TSX, these filters pull heavily from the resource sector, where book values are tied to commodity reserves and physical assets.
The Screen
Small-Cap Value Screen (SQL)
SELECT
    k.symbol,
    p.companyName,
    p.exchange,
    p.sector,
    ROUND(f.priceToBookRatioTTM, 3) AS pb_ratio,
    ROUND(k.returnOnEquityTTM * 100, 1) AS roe_pct,
    ROUND(COALESCE(f.debtToEquityRatioTTM, 0), 2) AS de_ratio,
    ROUND(k.marketCap / 1e9, 3) AS mktcap_b
FROM key_metrics_ttm k
JOIN profile p ON k.symbol = p.symbol
JOIN financial_ratios_ttm f ON k.symbol = f.symbol
WHERE f.priceToBookRatioTTM > 0
  AND f.priceToBookRatioTTM < 1.5
  AND k.returnOnEquityTTM > 0.05
  AND (f.debtToEquityRatioTTM IS NULL OR (f.debtToEquityRatioTTM >= 0 AND f.debtToEquityRatioTTM < 2.5))
  AND k.marketCap >= 25000000
  AND k.marketCap <= 1000000000
  AND p.exchange IN ('TSX')
QUALIFY ROW_NUMBER() OVER (PARTITION BY k.symbol ORDER BY f.priceToBookRatioTTM ASC) = 1
ORDER BY f.priceToBookRatioTTM ASC
LIMIT 30
Run this query on Ceta Research
What We Found
13.21% CAGR, but -48.13% max drawdown.
| Metric | Small-Cap Value (Canada) | TSX Composite |
|---|---|---|
| CAGR | 13.21% | 3.95% |
| Excess Return | +9.26% | - |
| Max Drawdown | -48.13% | - |
| Sharpe Ratio | 0.390 | - |
| Win Rate | 64% | - |
| Cash Periods | 0 of 25 | - |
| Avg Stocks per Period | 24.0 | - |
$10,000 invested in this strategy in 2000 would have grown to roughly $220,000. The TSX Composite returned just 3.95% CAGR over the same period. A huge outperformance gap. But the path to get there was brutal.
The -48.13% max drawdown is the deepest of any exchange in our 14-market comparison. The Sharpe ratio of 0.390 reflects the cost of that volatility. Canada delivers strong excess returns (+9.26% over the TSX Composite) but with dramatically worse drawdowns than the UK or Taiwan.
The 64% win rate and zero cash periods are positives. The strategy found enough qualifying stocks in every single year, averaging 24.0 per period. TSX has a large small-cap universe. The problem isn't quantity. It's what those stocks are.
When It Works
2001: +33.78% while SPY lost 20.77%
| Metric | Small-Cap Value (Canada) | S&P 500 |
|---|---|---|
| Return | +33.78% | -20.77% |
| Excess | +54.55% | - |
The dot-com implosion destroyed US tech stocks. Canadian small-cap value stocks, concentrated in resources and industrials, had zero exposure to the tech bubble. Mining companies and oil producers trading below book value with positive ROE kept generating cash while NASDAQ collapsed. The 54.55% excess return is the largest single-year outperformance of any exchange in our study.
2020: +88.25%, the COVID recovery
| Metric | Small-Cap Value (Canada) | S&P 500 |
|---|---|---|
| Return | +88.25% | +40.68% |
| Excess | +47.57% | - |
The COVID crash hit commodity prices hard. Oil briefly went negative. Canadian small-cap resource stocks got crushed in March 2020. Then the recovery was equally violent. Fiscal stimulus, supply constraints, and a global commodity super-cycle drove energy and mining stocks to multi-year highs. The cheapest stocks by P/B ratio, the ones hit hardest in the crash, snapped back the fastest. An 88% return in a single year.
2005: +43.06%, the commodity boom
| Metric | Small-Cap Value (Canada) | S&P 500 |
|---|---|---|
| Return | +43.06% | +8.86% |
| Excess | +34.21% | - |
The mid-2000s commodity super-cycle was in full swing. China's infrastructure buildout drove demand for Canadian resources. Small-cap miners and energy producers with real assets and positive ROE saw their stock prices surge. The P/B screen captured companies whose book values (resource reserves, physical assets) were deeply undervalued by the market.
When It Fails
2023: -3.84% vs SPY's +24.60%
| Metric | Small-Cap Value (Canada) | S&P 500 |
|---|---|---|
| Return | -3.84% | +24.60% |
| Excess | -28.44% | - |
The worst relative year in 25. SPY gained nearly 25%, driven by the AI boom in US tech. Canadian small-cap value stocks, with zero exposure to artificial intelligence or mega-cap tech, delivered a small loss. The -28.44% excess is painful. This is the flip side of the commodity exposure coin: when the market rally is driven by technology, TSX small-value stocks get left behind completely.
2019: -18.31% vs SPY's +7.12%
| Metric | Small-Cap Value (Canada) | S&P 500 |
|---|---|---|
| Return | -18.31% | +7.12% |
| Excess | -25.44% | - |
A terrible year for Canadian small caps. Commodity prices were soft, pipeline politics dominated Canadian energy headlines, and investor sentiment toward Canadian resource stocks was deeply negative. The strategy lost 18% while US large caps gained 7%. This kind of drawdown, driven by sector-specific headwinds rather than broad market stress, is harder to stomach because the rest of the world is doing fine.
2011: -12.77% vs SPY's +4.10%
| Metric | Small-Cap Value (Canada) | S&P 500 |
|---|---|---|
| Return | -12.77% | +4.10% |
| Excess | -16.87% | - |
The European debt crisis didn't hit Canadian fundamentals directly, but risk-off sentiment crushed small-cap resource stocks. Gold miners and junior energy companies, the types of stocks this screen selects, saw capital flee to safe havens. The -12.77% loss is moderate in absolute terms, but the 17-point gap with SPY stings.
Full Annual Returns
| Year | Small-Cap Value (Canada) | S&P 500 | Excess |
|---|---|---|---|
| 2000 | +10.62% | -14.78% | +25.41% |
| 2001 | +33.78% | -20.77% | +54.55% |
| 2002 | +3.88% | +3.29% | +0.59% |
| 2003 | +34.11% | +16.44% | +17.67% |
| 2004 | +20.58% | +7.94% | +12.64% |
| 2005 | +43.06% | +8.86% | +34.21% |
| 2006 | +27.32% | +20.95% | +6.37% |
| 2007 | -6.59% | -13.71% | +7.12% |
| 2008 | -19.61% | -26.14% | +6.53% |
| 2009 | +62.33% | +13.42% | +48.91% |
| 2010 | +18.78% | +32.94% | -14.16% |
| 2011 | -12.77% | +4.10% | -16.87% |
| 2012 | +6.13% | +20.85% | -14.72% |
| 2013 | +27.93% | +24.50% | +3.43% |
| 2014 | -2.00% | +7.38% | -9.38% |
| 2015 | -9.69% | +3.36% | -13.05% |
| 2016 | +32.88% | +17.73% | +15.15% |
| 2017 | +17.59% | +14.34% | +3.25% |
| 2018 | -7.75% | +10.91% | -18.67% |
| 2019 | -18.31% | +7.12% | -25.44% |
| 2020 | +88.25% | +40.68% | +47.57% |
| 2021 | +24.78% | -10.17% | +34.95% |
| 2022 | +2.34% | +18.31% | -15.97% |
| 2023 | -3.84% | +24.60% | -28.44% |
| 2024 | +3.56% | +14.67% | -11.11% |
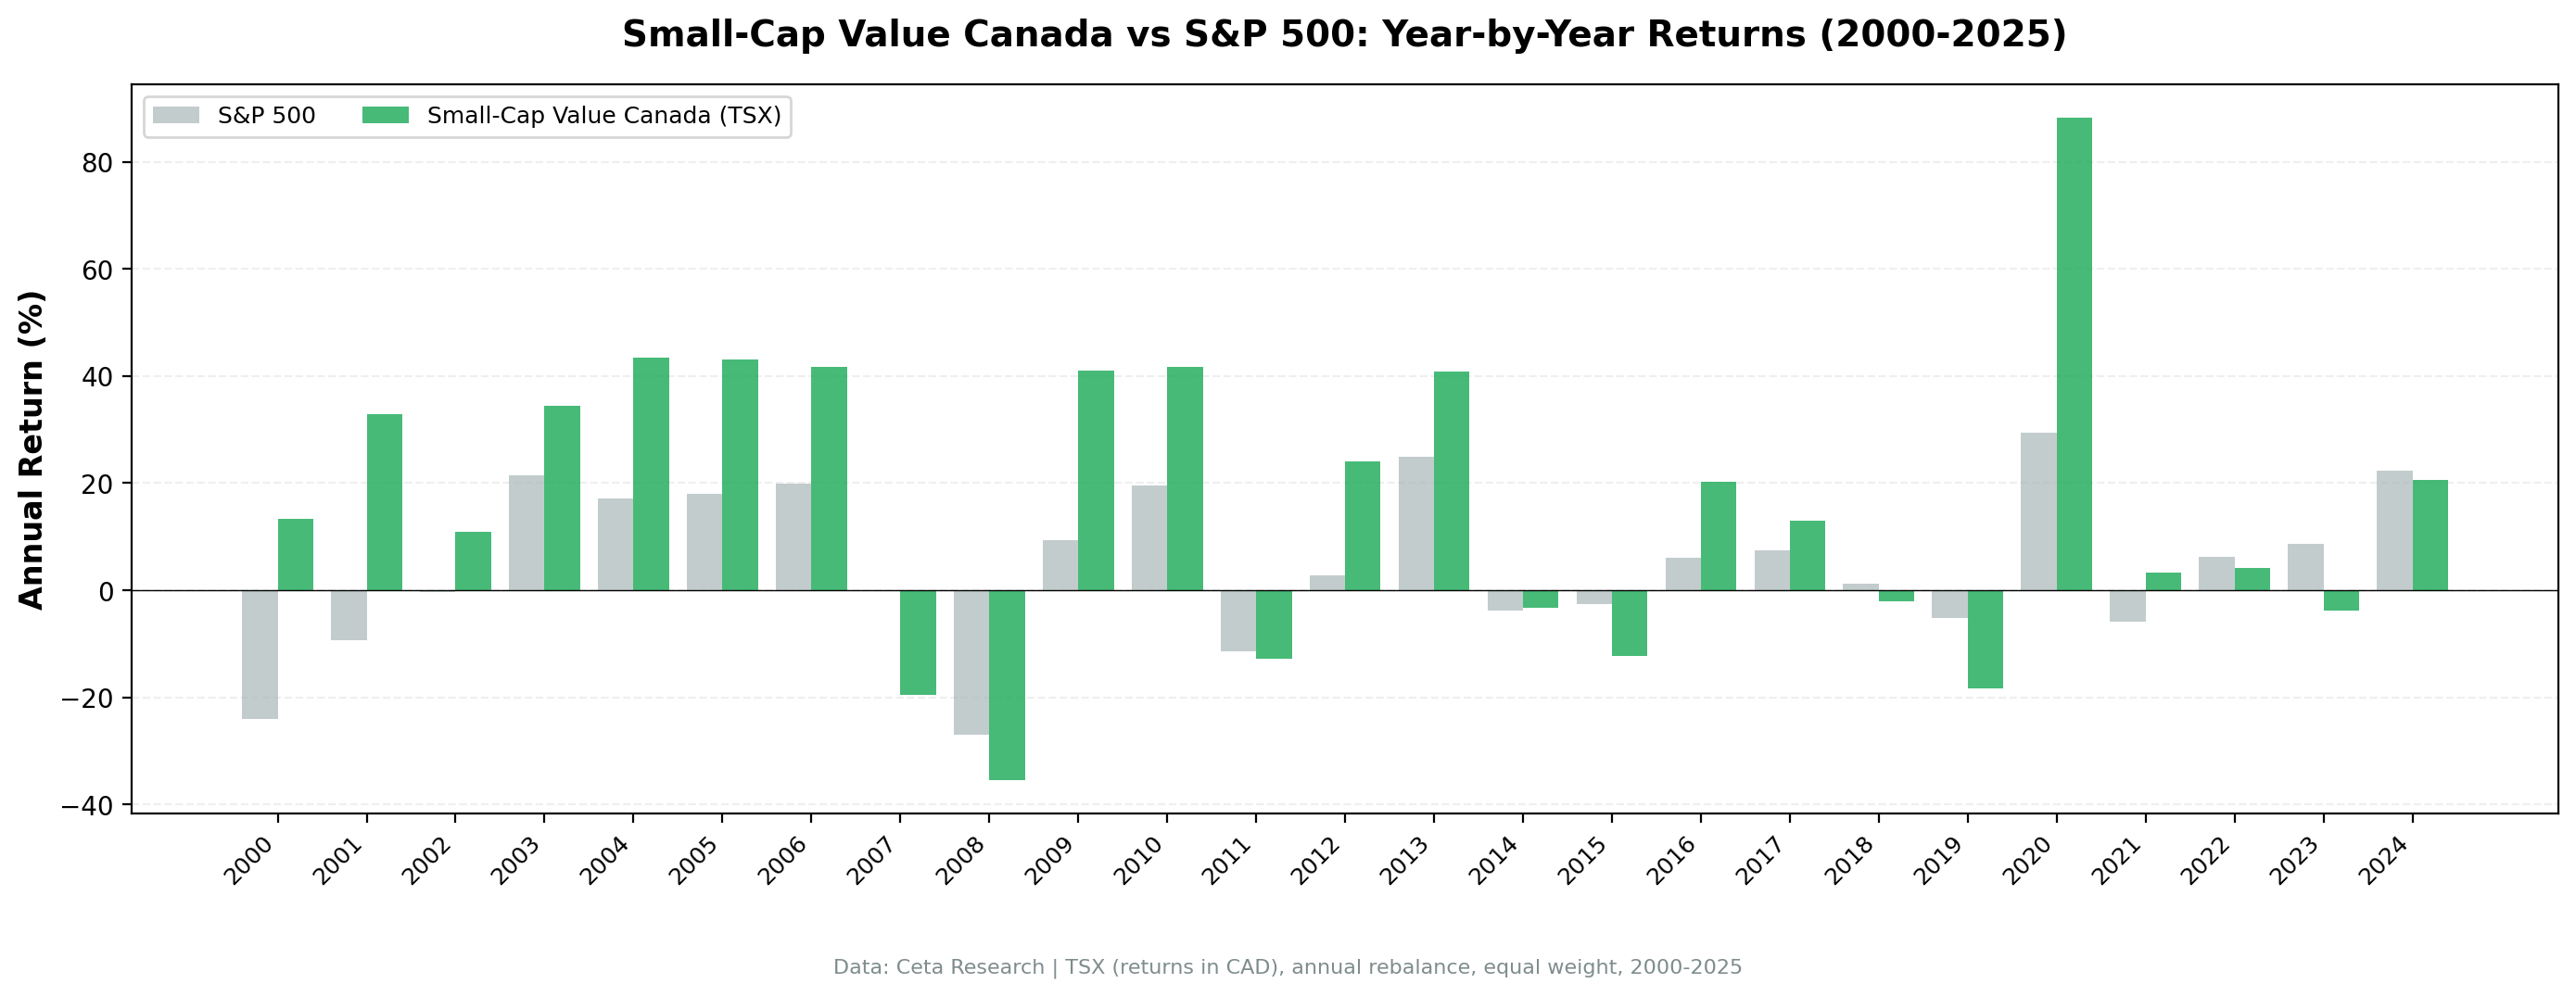
Eight negative years in 25. That's 32% of the time. Compare that to the UK's three negative years or Taiwan's two. Canadian small-cap value is volatile. The worst loss (-19.61% in 2008) is nearly double the UK's worst (-10.32% in 2021).
The return profile is clearly lumpy. Massive up years (2001, 2005, 2009, 2020, 2021) carry the CAGR. Painful corrections (2008, 2011, 2015, 2018, 2019) test your conviction. The first decade (2000-2009) was exceptionally strong, with positive excess returns every single year. The second decade has been more mixed, with the resource cycle working against the strategy during US-tech-driven rallies.
The boom-bust pattern is unmistakable. The strategy's biggest gains come during commodity upcycles and crisis recoveries. Its worst periods coincide with commodity busts and tech-driven bull markets.
Limitations
Commodity cycle sensitivity. The -48.13% drawdown is driven by resource sector exposure. Mining companies, oil producers, and natural resource firms make up a disproportionate share of TSX small caps. A sector-neutral version of this screen would likely produce lower returns but dramatically better drawdowns.
Cyclical book values. Mining companies carry resource reserves on their balance sheets. When commodity prices fall, these assets get impaired, destroying book value. A stock that looked cheap at P/B 0.5 might see its book value cut in half, making the original P/B misleading. The P/B signal is less stable for resource companies than for industrial or services firms.
Same-currency comparison. Returns in CAD, benchmarked against the TSX Composite (also in CAD). This is an apples-to-apples comparison.
Survivorship bias. TSX has seen meaningful delisting activity, particularly among junior resource companies. Failed mining ventures and bankrupt E&P companies exit the exchange and exit the backtest dataset.
Transaction costs not included. Canadian small caps have wider spreads than US equivalents. Budget 0.3-0.5% per trade. With annual rebalancing, the drag is approximately 0.6-1.0% annually.
Exploration-stage companies. Many TSX small caps are junior miners or exploration companies. They have assets (claims, permits, early-stage projects) but inconsistent revenue. The ROE > 5% filter removes the worst of these, but some survive the screen during commodity booms and then crater when the cycle turns.
Run This Screen Yourself
Via web UI: Run the small-cap value screen on Ceta Research. The query is pre-loaded. Hit "Run" and see what passes today.
Via Python:
import requests, time

API_KEY = "your_api_key"  # get one at cetaresearch.com
BASE = "https://tradingstudio.finance/api/v1"

# Submit the small-cap value screen query
resp = requests.post(f"{BASE}/data-explorer/execute", headers={
    "X-API-Key": API_KEY, "Content-Type": "application/json"
}, json={
    "query": """
        SELECT k.symbol, p.companyName, p.sector,
            ROUND(f.priceToBookRatioTTM, 3) AS pb_ratio,
            ROUND(k.returnOnEquityTTM * 100, 1) AS roe_pct,
            ROUND(COALESCE(f.debtToEquityRatioTTM, 0), 2) AS de_ratio,
            ROUND(k.marketCap / 1e9, 3) AS mktcap_b
        FROM key_metrics_ttm k
        JOIN profile p ON k.symbol = p.symbol
        JOIN financial_ratios_ttm f ON k.symbol = f.symbol
        WHERE f.priceToBookRatioTTM > 0 AND f.priceToBookRatioTTM < 1.5
            AND k.returnOnEquityTTM > 0.05
            AND (f.debtToEquityRatioTTM IS NULL OR (f.debtToEquityRatioTTM >= 0 AND f.debtToEquityRatioTTM < 2.5))
            AND k.marketCap >= 25000000 AND k.marketCap <= 1000000000
            AND p.exchange IN ('TSX')
        QUALIFY ROW_NUMBER() OVER (PARTITION BY k.symbol ORDER BY f.priceToBookRatioTTM ASC) = 1
        ORDER BY f.priceToBookRatioTTM ASC
        LIMIT 30
    """,
    "options": {"format": "json", "limit": 100}
})
task_id = resp.json()["taskId"]

# Poll until complete
while True:
    result = requests.get(f"{BASE}/tasks/data-query/{task_id}",
                          headers={"X-API-Key": API_KEY}).json()
    if result["status"] in ("completed", "failed"):
        break
    time.sleep(2)

for r in result["result"]["rows"][:10]:
    print(f"{r['symbol']:8s} P/B={r['pb_ratio']:.2f} ROE={r['roe_pct']:.1f}% D/E={r['de_ratio']:.2f}")
Via backtest CLI:
cd backtests/small-value
python backtest.py --exchange TSX --start 2000 --end 2025
Get your API key at cetaresearch.com. The full backtest code (Python + DuckDB) is on GitHub.
Part of a Series
This analysis is part of our small-cap value global exchange comparison. We tested the same screen on 14 exchanges worldwide: - Small-Cap Value on US Stocks - 18.28% CAGR, the flagship - Small-Cap Value on Indian Stocks - 20.89% CAGR, highest absolute return - Small-Cap Value on UK Stocks - Best risk-adjusted (0.750 Sharpe) - Small-Cap Value on Taiwan Stocks - Low drawdown, steady performance - Small-Cap Value: 14-Exchange Global Comparison - All 14 beat their local benchmark
Takeaway
Canada is the high-risk version of small-cap value. 13.21% CAGR is a solid result, +9.26% excess over the TSX Composite, and the portfolio was fully invested every period with 24 stocks on average. But the -48.13% drawdown reveals what's underneath: heavy exposure to the Canadian commodity cycle.
TSX small caps are structurally different from LSE or TWSE small caps. Mining companies, oil producers, and natural resource firms dominate the exchange. When commodity prices rise, these stocks rerate aggressively. When commodity prices fall, book values get impaired and stock prices follow. The P/B signal becomes unreliable in commodity downturns because the "B" is shrinking alongside the "P."
The strategy works if you can hold through commodity busts. The rebounds are sharp and profitable: +62% in 2009, +88% in 2020, +33% in 2001. The drawdowns are severe and gut-wrenching: -48% peak-to-trough, eight negative years in 25. Compare this to the UK's -10.32% max drawdown for similar excess returns and the difference is stark. For Canadian investors already exposed to TSX, this screen provides a systematic way to harvest the small-value premium in their home market. For international investors choosing between markets, the UK or US versions offer a better risk-reward profile.
References
- Fama, E. & French, K. (1992). "The Cross-Section of Expected Stock Returns." Journal of Finance, 47(2), 427-465.
- Fama, E. & French, K. (1993). "Common Risk Factors in the Returns on Stocks and Bonds." Journal of Financial Economics, 33(1), 3-56.
- Israel, R. & Moskowitz, T. (2013). "The Role of Shorting, Firm Size, and Time on Market Anomalies." Journal of Financial Economics, 108(2), 275-301.
- Lakonishok, J., Shleifer, A. & Vishny, R. (1994). "Contrarian Investment, Extrapolation, and Risk." Journal of Finance, 49(5), 1541-1578.
Data: Ceta Research, FMP financial data warehouse. Universe: TSX small caps (C$25M-C$1B). Annual rebalance (July), equal weight top 30, 2000-2025. Returns in CAD.
Past performance does not guarantee future results. This is educational content, not investment advice.


