
Yield Gap India: +3.45% Annual Alpha Despite a High-Rate Filter


Contents
The yield gap threshold for India is strict. With a risk-free rate of 6.5% (long-run average for Indian government bonds), the screen requires earnings yields above 9.5%, equivalent to PE ratios below roughly 10.5x. That's a demanding bar. Companies that clear it have historically rewarded investors: BSE/NSE yield gap stocks returned 11.09% CAGR vs 7.64% for SPY over the 20 invested years.
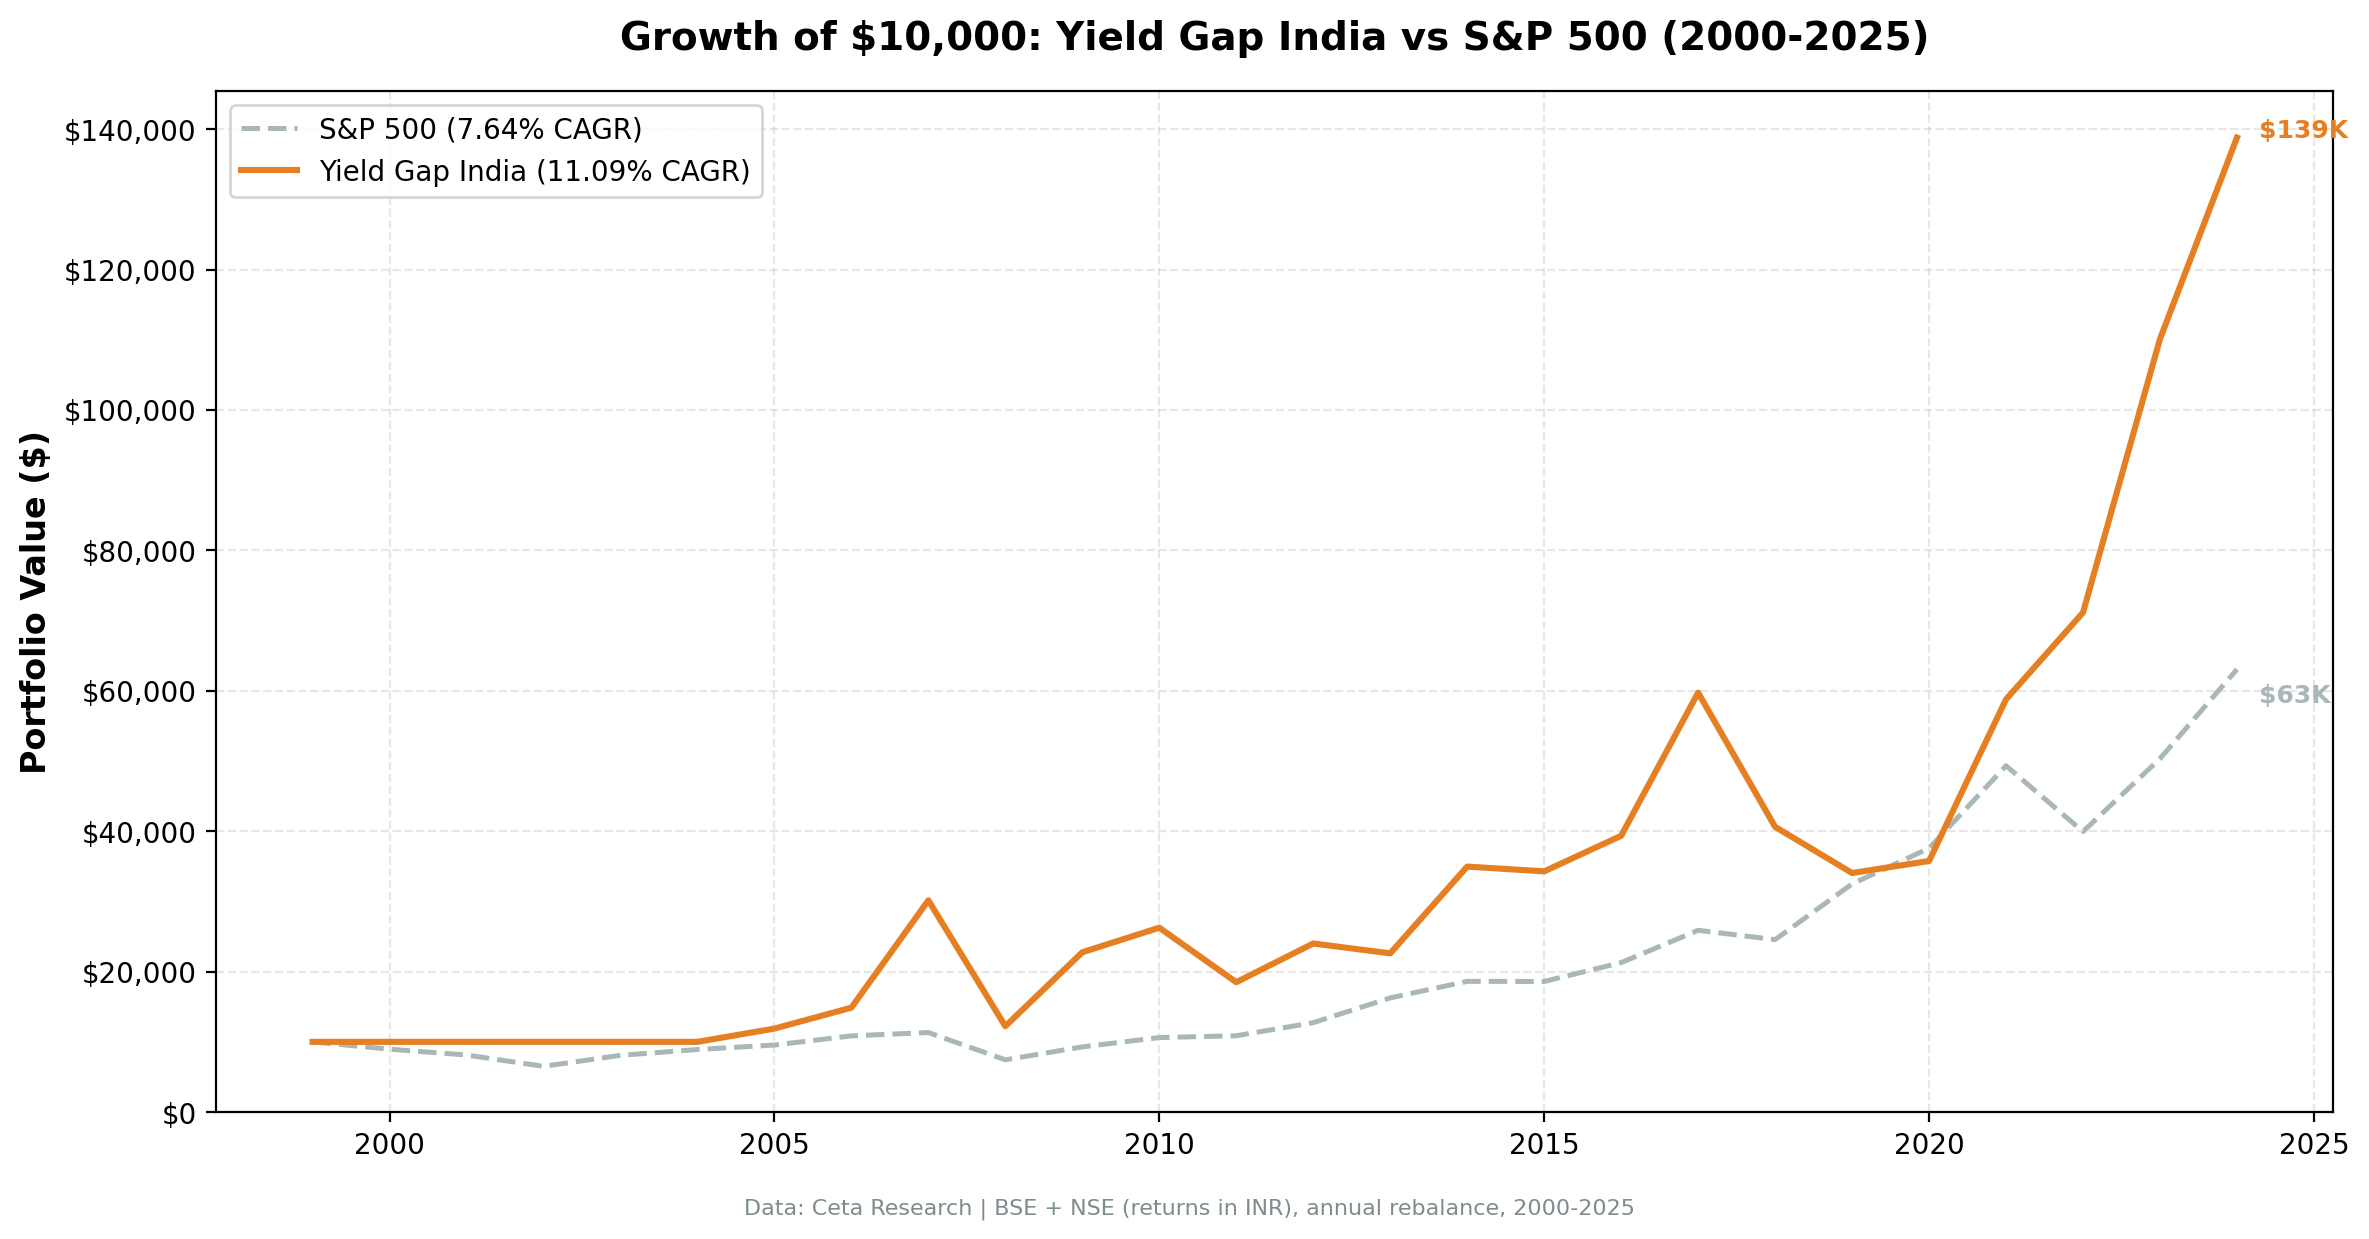
A $10,000 investment grew to $138,789 over the full 25-year period (2000-2025). The early years (2000-2004) show zero returns because FMP's earnings yield data for Indian stocks begins reliably in 2005. The $138,789 includes five years of zero-return cash at the start.
The Strategy
India's high inflation and high nominal interest rates mean the risk-free rate sets a meaningful bar for equity compensation. The yield gap threshold of rfr + 3% = 9.5% EY is the highest effective threshold in our 20-market study, more than 50% above the 6% floor used in the US, UK, Germany, and Japan.
Signal: - Earnings yield > max(6%, 6.5% + 3%) = 9.5% for India (PE < ~10.5x) - Earnings yield < 50% - ROE > 8% - D/E < 2.0
Portfolio construction: Top 30 by highest earnings yield, equal weight, annual January rebalance. Cash if fewer than 10 stocks qualify. The portfolio held cash in all five years from 2000-2004 due to limited FY data coverage, then invested continuously from 2005 through 2024.
Methodology
- Universe: BSE and NSE (combined)
- Market cap filter: INR 50B+ at each rebalance date (~$600M USD equivalent, scaled over time)
- Data period: January 2000 through December 2025 (25 annual periods)
- Invested periods: 20 of 25 years (5 years zero-return cash, 2000-2004)
- Rebalancing: Annual (January)
- Point-in-time data: FY filings with 45-day filing lag
- Transaction costs: Size-tiered model
- Benchmark: SPY (global capital cost benchmark)
- Data source: Ceta Research FMP financial data warehouse
Data coverage note: FMP's FY earnings yield data for Indian stocks is reliable from 2005 onward. The 2000-2004 period shows zero returns, not actual portfolio performance, but a reflection of insufficient data to screen meaningful positions. The 11.09% CAGR is computed over the full 25-year period including these five zero-return years. The actual invested-period CAGR (2005-2024, 20 years) is higher.
Full methodology at github.com/ceta-research/backtests/blob/main/METHODOLOGY.md.
Results
| Metric | Yield Gap India | SPY |
|---|---|---|
| CAGR | 11.09% | 7.64% |
| Total return (25yr) | 1,287.9% | 530.7% |
| Max drawdown | -59.46% | -45.50% |
| Sharpe ratio | 0.124 | — |
| Down capture vs SPY | 73.7% | — |
| Win rate vs SPY | 64.0% | — |
| Cash periods | 5 of 25 years (20%) | — |
| Avg stocks (invested) | 25.6 | — |
The 64% win rate (tied with Sweden) shows this isn't one-year outperformance, the strategy beat SPY in 13 of 20 invested years. The Sharpe ratio of 0.124 is low, driven primarily by the extreme volatility of the India market during 2007-2009 (see annual returns below). The underlying asset class is simply more volatile; the excess return is real but came with more turbulence.
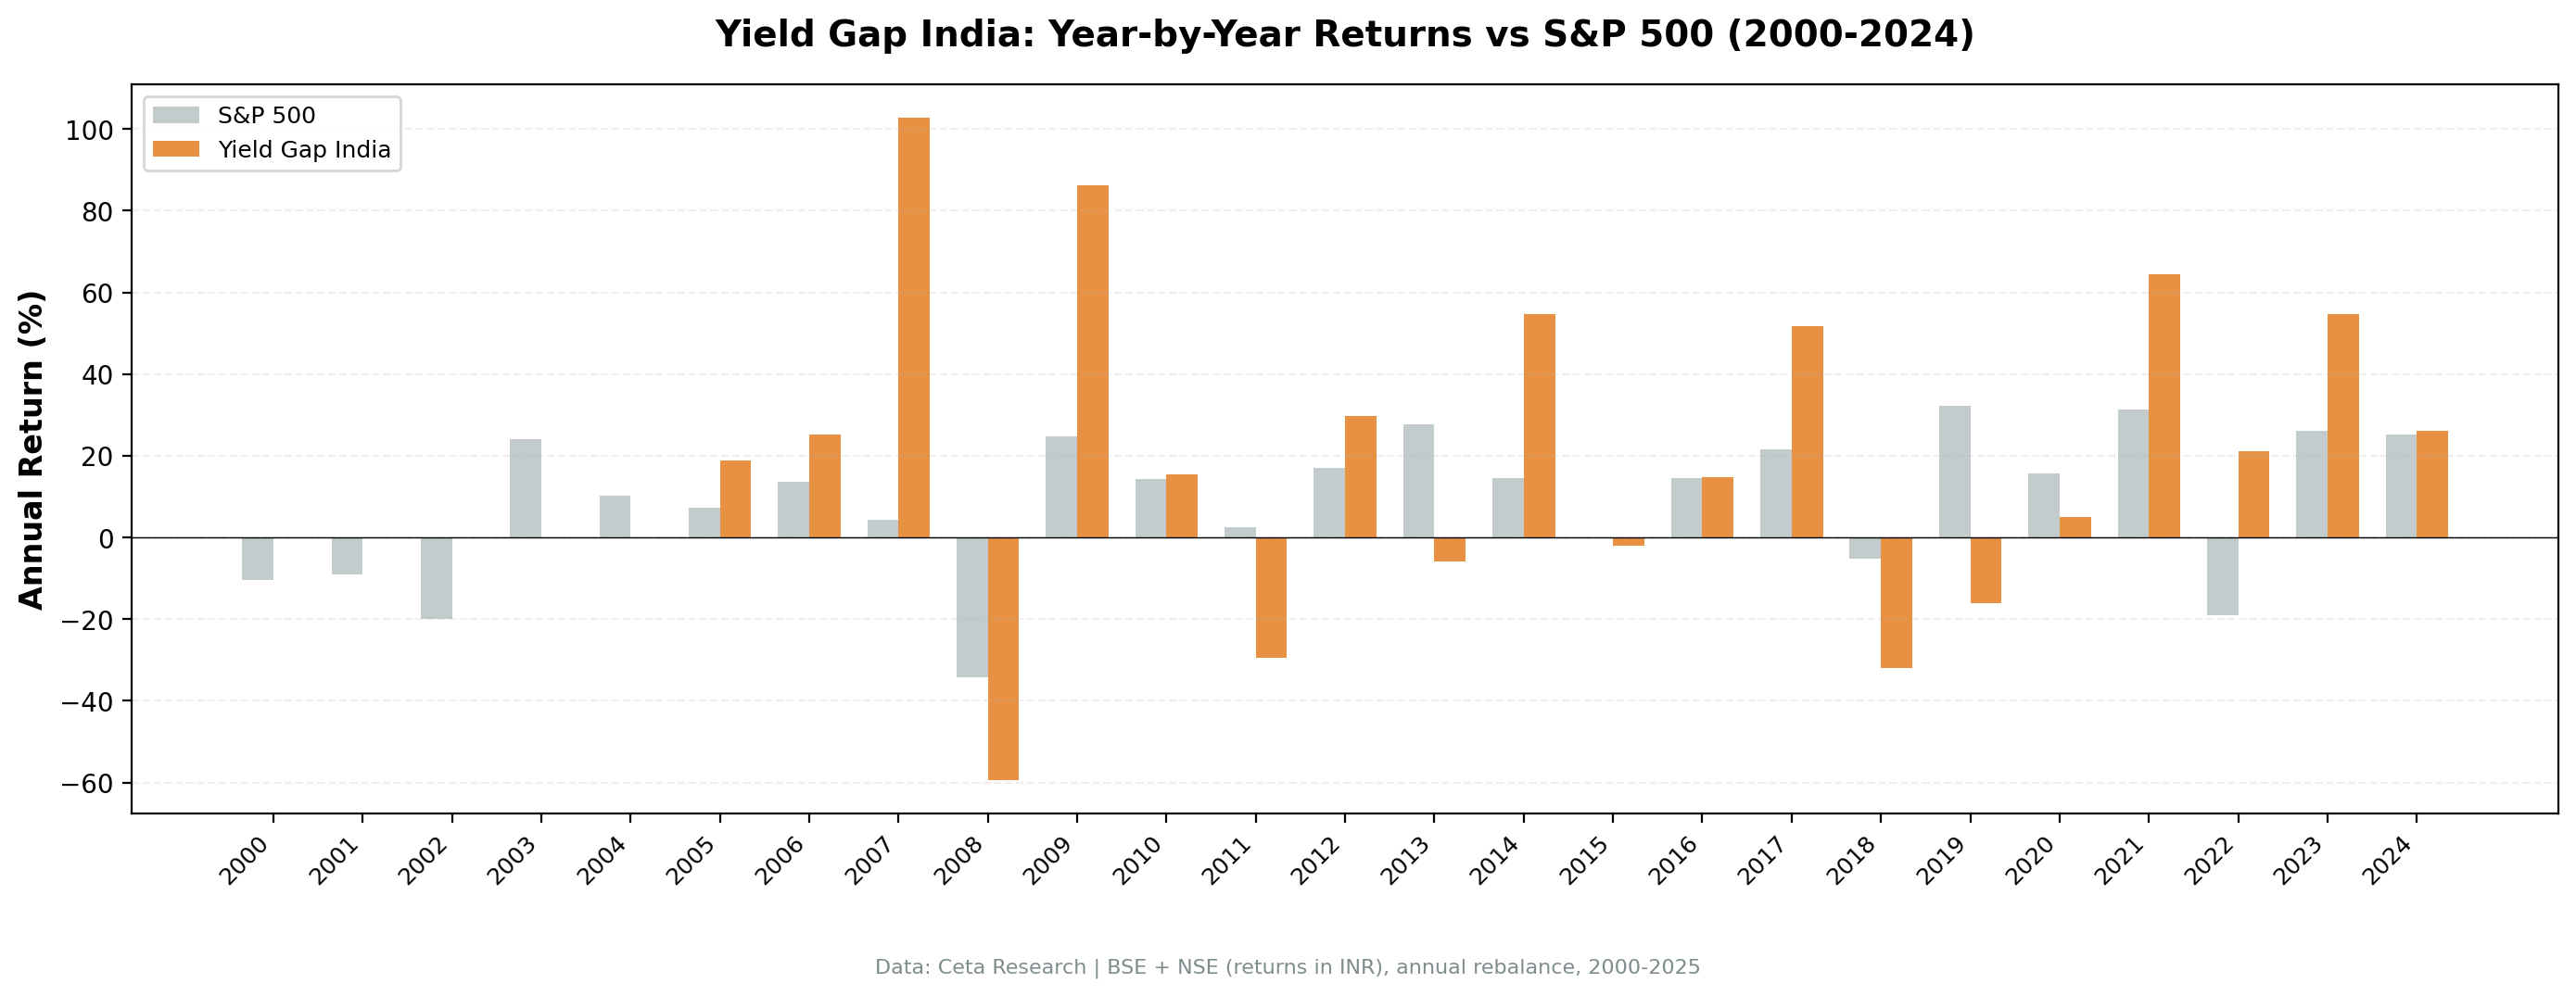
Annual returns:
| Year | Portfolio | SPY | Excess | Note |
|---|---|---|---|---|
| 2000 | 0.00% | -10.50% | +10.50% | Cash — data gap |
| 2001 | 0.00% | -9.17% | +9.17% | Cash — data gap |
| 2002 | 0.00% | -19.92% | +19.92% | Cash — data gap |
| 2003 | 0.00% | +24.12% | -24.12% | Cash — data gap |
| 2004 | 0.00% | +10.24% | -10.24% | Cash — data gap |
| 2005 | +18.87% | +7.17% | +11.70% | First invested year |
| 2006 | +25.08% | +13.65% | +11.43% | |
| 2007 | +102.79% | +4.40% | +98.39% | India Sensex +47% (bull market) |
| 2008 | -59.46% | -34.31% | -25.15% | Worst year |
| 2009 | +86.19% | +24.73% | +61.46% | Recovery |
| 2010 | +15.39% | +14.31% | +1.08% | |
| 2011 | -29.58% | +2.46% | -32.04% | |
| 2012 | +29.82% | +17.09% | +12.73% | |
| 2013 | -5.85% | +27.77% | -33.62% | |
| 2014 | +54.68% | +14.50% | +40.18% | Modi election rally |
| 2015 | -1.95% | -0.12% | -1.83% | |
| 2016 | +14.78% | +14.45% | +0.33% | |
| 2017 | +51.81% | +21.64% | +30.17% | |
| 2018 | -32.00% | -5.15% | -26.85% | |
| 2019 | -16.18% | +32.31% | -48.49% | Worst relative year |
| 2020 | +5.03% | +15.64% | -10.61% | |
| 2021 | +64.39% | +31.26% | +33.13% | |
| 2022 | +21.03% | -18.99% | +40.02% | Best excess return |
| 2023 | +54.77% | +26.00% | +28.77% | |
| 2024 | +26.04% | +25.28% | +0.76% |
The Indian Market Story
2007 was extraordinary. The portfolio returned +102.79% as the India Sensex gained roughly 47% that year. High-earnings-yield portfolios with 20+ stocks can plausibly exceed the index in a broad bull market, leverage to the upside is inherent in buying deeply discounted assets that then re-rate. 2007 wasn't a data error. It was India in a pre-crisis equity bubble, and cheap quality stocks rode the wave hard.
2008 was the mirror. -59.46% in a single year. India's equity market fell roughly 50% in 2008, and leveraged or economically sensitive companies fell more. The high-EY threshold means the portfolio held companies with PE ratios below 10.5x, often cyclical or capital-intensive businesses that are more exposed when credit tightens and growth slows. The Sharpe ratio reflects this volatility.
2014 was the Modi rally. +54.68% vs +14.50% SPY (+40.18% excess). The BJP election victory in May 2014 triggered a re-rating of Indian equities broadly, but value stocks specifically, which had underperformed for years, snapped back sharply. Companies that had been trading at single-digit multiples suddenly found buyers.
2022 reversed what 2019 destroyed. The worst year relative to SPY was 2019 (-48.49% excess), driven by a combination of Indian economic slowdown and US tech rally. The best year relative to SPY was 2022 (+40.02% excess). US markets fell while India's earnings-yield stocks surged. Companies that cleared the 9.5% threshold in early 2022 were often cash-generative industrials and financial companies that benefited from India's domestic growth story as global tech imploded.
Part of a Series: Global | US | UK | Sweden | Canada
Run It Yourself
Current India yield gap screen:
SELECT
 k.symbol,
 p.companyName,
 p.exchange,
 p.sector,
 ROUND(k.earningsYieldTTM * 100, 2) AS earnings_yield_pct,
 ROUND(1.0 / NULLIF(k.earningsYieldTTM, 0), 1) AS implied_pe,
 ROUND(k.returnOnEquityTTM * 100, 2) AS roe_pct,
 ROUND(fr.debtToEquityRatioTTM, 2) AS debt_to_equity,
 ROUND(k.freeCashFlowYieldTTM * 100, 2) AS fcf_yield_pct,
 ROUND(k.marketCap / 1e9, 2) AS mktcap_b
FROM key_metrics_ttm k
JOIN profile p ON k.symbol = p.symbol
JOIN financial_ratios_ttm fr ON k.symbol = fr.symbol
WHERE k.earningsYieldTTM > 0.095 -- EY > 9.5% (rfr=6.5%+3%)
 AND k.earningsYieldTTM < 0.50
 AND k.returnOnEquityTTM > 0.08
 AND (fr.debtToEquityRatioTTM IS NULL
 OR (fr.debtToEquityRatioTTM >= 0 AND fr.debtToEquityRatioTTM < 2.0))
 AND k.marketCap > 50000000000 -- INR 50B+
 AND (p.industry IS NULL OR p.industry NOT LIKE 'Asset Management%')
 AND (p.industry IS NULL OR p.industry NOT LIKE 'Shell Companies%')
 AND p.exchange IN ('BSE', 'NSE')
ORDER BY k.earningsYieldTTM DESC
LIMIT 30
Run this query on Ceta Research Data Explorer
Full backtest:
git clone https://github.com/ceta-research/backtests.git
cd backtests
pip install -r requirements.txt
python3 yield-gap/backtest.py --preset india --output results.json --verbose
Limitations
Data gap (2000-2004): FMP's FY earnings yield data for Indian stocks isn't reliably available before 2005. The backtest holds cash for these years. The 11.09% CAGR includes five zero-return years; the actual invested-period outperformance is stronger.
High volatility: The India market is more volatile than US, UK, or European markets. A -59.46% drawdown in 2008 and +102.79% in 2007 reflect the asset class, not anomalies. Investors need to be prepared for significant year-to-year swings.
Currency risk: Returns in INR. INR has depreciated against USD over the long run, approximately 3-4% annually over this period. USD-based investors would have experienced lower USD returns.
Threshold sensitivity: The 9.5% EY threshold is derived from a 6.5% risk-free rate assumption. India's actual policy rate has ranged from 4% to 9% over this period. A lower effective RFR would lower the threshold and widen the qualifying universe; a higher RFR would narrow it further.
Data: Ceta Research (FMP financial data warehouse), January 2000 through December 2025. Full methodology: github.com/ceta-research/backtests/blob/main/METHODOLOGY.md.
Academic references: Campbell, J.Y. & Vuolteenaho, T. (2004). "Bad Beta, Good Beta." American Economic Review, 94(5). Damodaran, A. (2012). "Equity Risk Premiums (ERP): Determinants, Estimation and Implications." Stern School of Business.


