
Capital Efficiency in Germany: 8.56% CAGR, +3.52% vs DAX
Testing capital efficiency on XETRA: low-capex, high-ROIC German companies delivered 8.56% CAGR from 2000-2025, beating the DAX by 3.52%/year. Lower volatility and better drawdown protection than the benchmark.

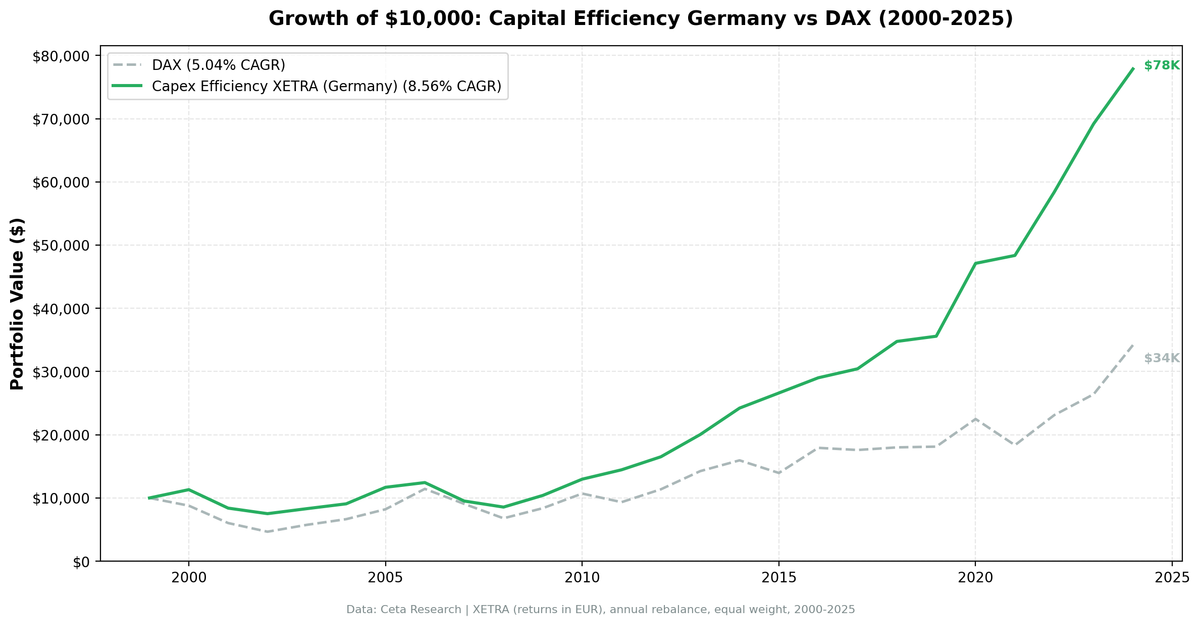
A portfolio of capital-efficient German companies, spending less than 8% of revenue on capex while earning above 15% ROIC, delivered 8.56% annualized returns from 2000 to 2025. That's 3.52 percentage points ahead of the DAX, with a 56% win rate and Sharpe ratio of 0.451. The trade-off: maximum drawdown hit -33.59%, reflecting European market volatility during the Eurozone crisis. This is capital efficiency in a slower-growth, export-driven economy. Positive alpha vs the local benchmark, with a roughly even hit rate year by year.
Contents
- The Strategy
- Methodology
- Results
- Why the Higher Drawdown?
- Why It Still Works
- When It Works Best
- When It Struggles
- Run It Yourself
- Limitations
- Related Content
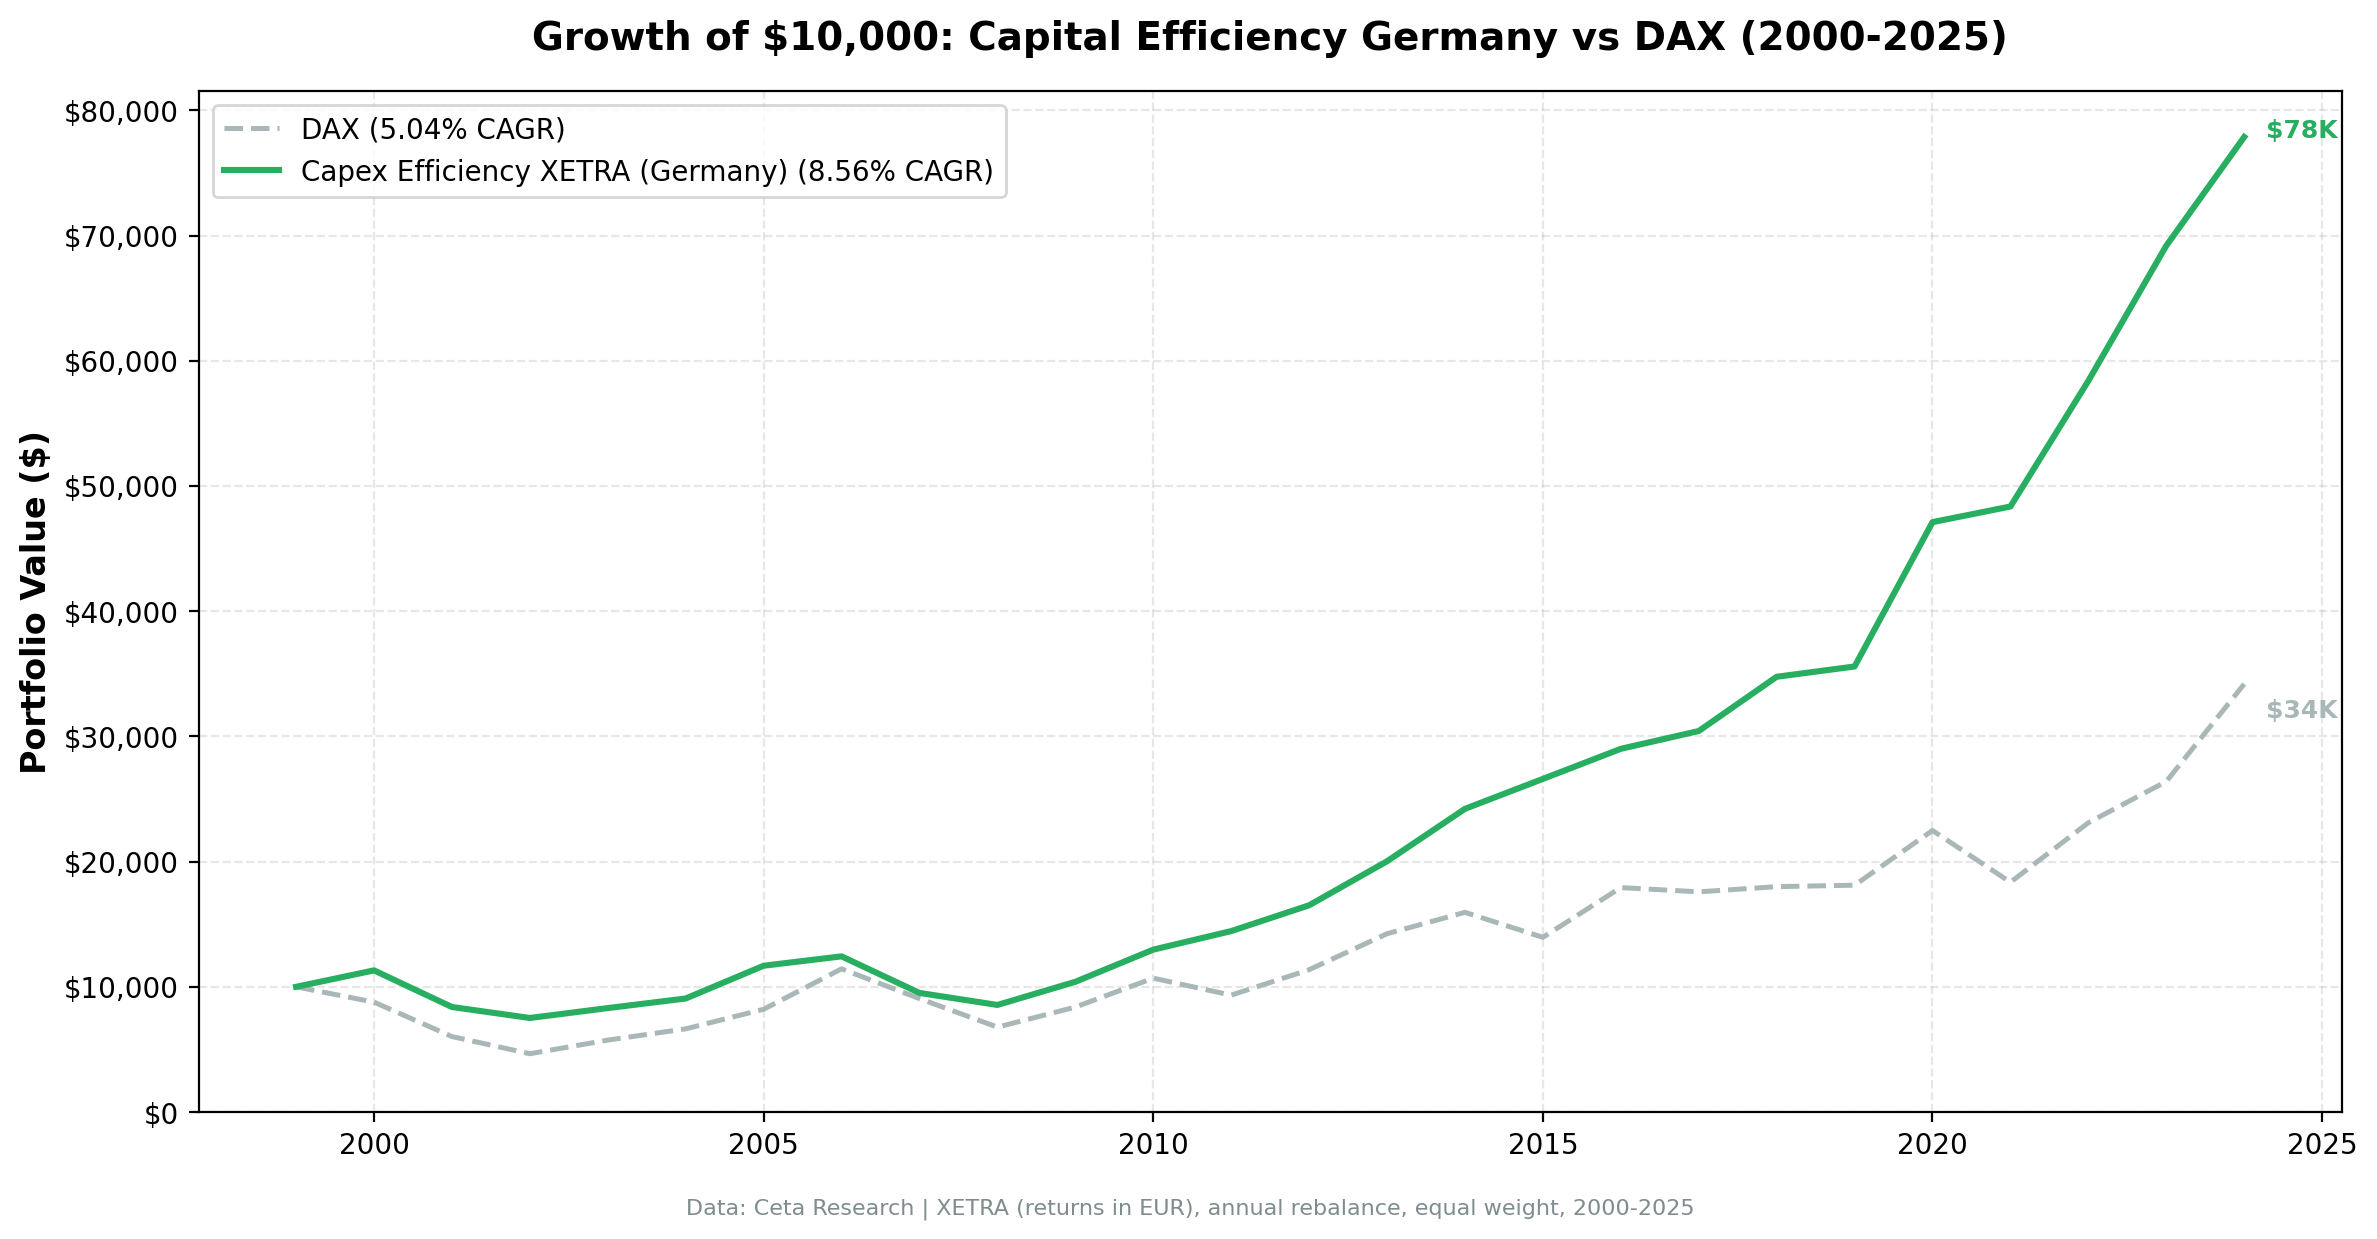
$10,000 invested in July 2000 grew to $77,870 by July 2025. The same amount in the DAX grew to $34,190.
Data: FMP financial data warehouse, 2000–2025. Updated May 2026.
The Strategy
Capital expenditure efficiency screens for companies that generate strong returns without constant reinvestment in fixed assets:
- Capex-to-Revenue < 8%: Asset-light business model (services, software, specialized manufacturing)
- Capex-to-Operating Cash Flow < 40%: Retains 60%+ of operating cash as free cash flow
- ROIC > 15%: Earns well above cost of capital
- Operating Margin > 15%: Pricing power through differentiation
The Mittelstand angle: Germany's hidden champions often fit this profile. Mid-sized companies with global market share in niche products don't need massive capex to defend their moats. They compound through expertise, brand, and customer lock-in rather than asset expansion.
Portfolio construction: Top 30 stocks by highest ROIC, equal-weight, annual rebalancing in July (45-day lag for fiscal year filings). Cash position if fewer than 10 stocks qualify.
Methodology
Universe: XETRA, all stocks with market cap > €500M (~$545M USD) Data source: Ceta Research (FMP financial data warehouse) Backtest period: July 2000 - July 2025 (25 annual periods) Rebalancing: Annual (July) using FY data with 45-day filing lag Transaction costs: Size-tiered model (0.2-0.5% per trade, applied to individual stock returns) Benchmark: DAX (local currency) Execution: Next-day close (market-on-close after signal date)
Signal (at each rebalance date): - Capex-to-Revenue < 8% - Capex-to-OCF < 40% - ROIC > 15% - Operating Margin > 15% - Market Cap > €500M
From qualifying stocks, select top 30 by highest ROIC. Hold equal weight. If fewer than 10 qualify, hold cash (0% of periods).
Full methodology: backtests/METHODOLOGY.md
Results
| Metric | Strategy | DAX | Excess |
|---|---|---|---|
| CAGR | 8.56% | 5.04% | +3.52% |
| Total Return | 679% | 242% | +437% |
| Sharpe Ratio | 0.451 | 0.144 | - |
| Sortino Ratio | 0.789 | 0.239 | - |
| Max Drawdown | -33.59% | -53.43% | - |
| Volatility (ann.) | 14.54% | 21.11% | - |
| Win Rate | 56.0% | N/A | - |
| Best Year | +32.4% (2020) | 24.1% | +8.3% |
| Worst Year | -25.9% (2001) | -31.3% | +5.5% |
| Avg Stocks per Period | 17 | - | - |
| Cash Periods | 0 / 25 | - | - |
Key observations:
- Positive alpha vs DAX: +3.52% excess CAGR with markedly lower volatility (14.54% vs DAX's 21.11%)
- Better risk-adjusted returns: 0.451 Sharpe vs DAX's 0.144. Roughly 3x the risk-adjusted performance.
- Lower drawdown than benchmark: -33.59% max drawdown vs DAX's -53.43%. The quality filter protected capital during crises.
- Even win-rate: 56.0% (14 of 25 years beat the DAX). Lower than India, UK, or US, despite the volatility advantage.
- Growing universe: Average 17 stocks per period, with 20+ stocks from 2008 onward.
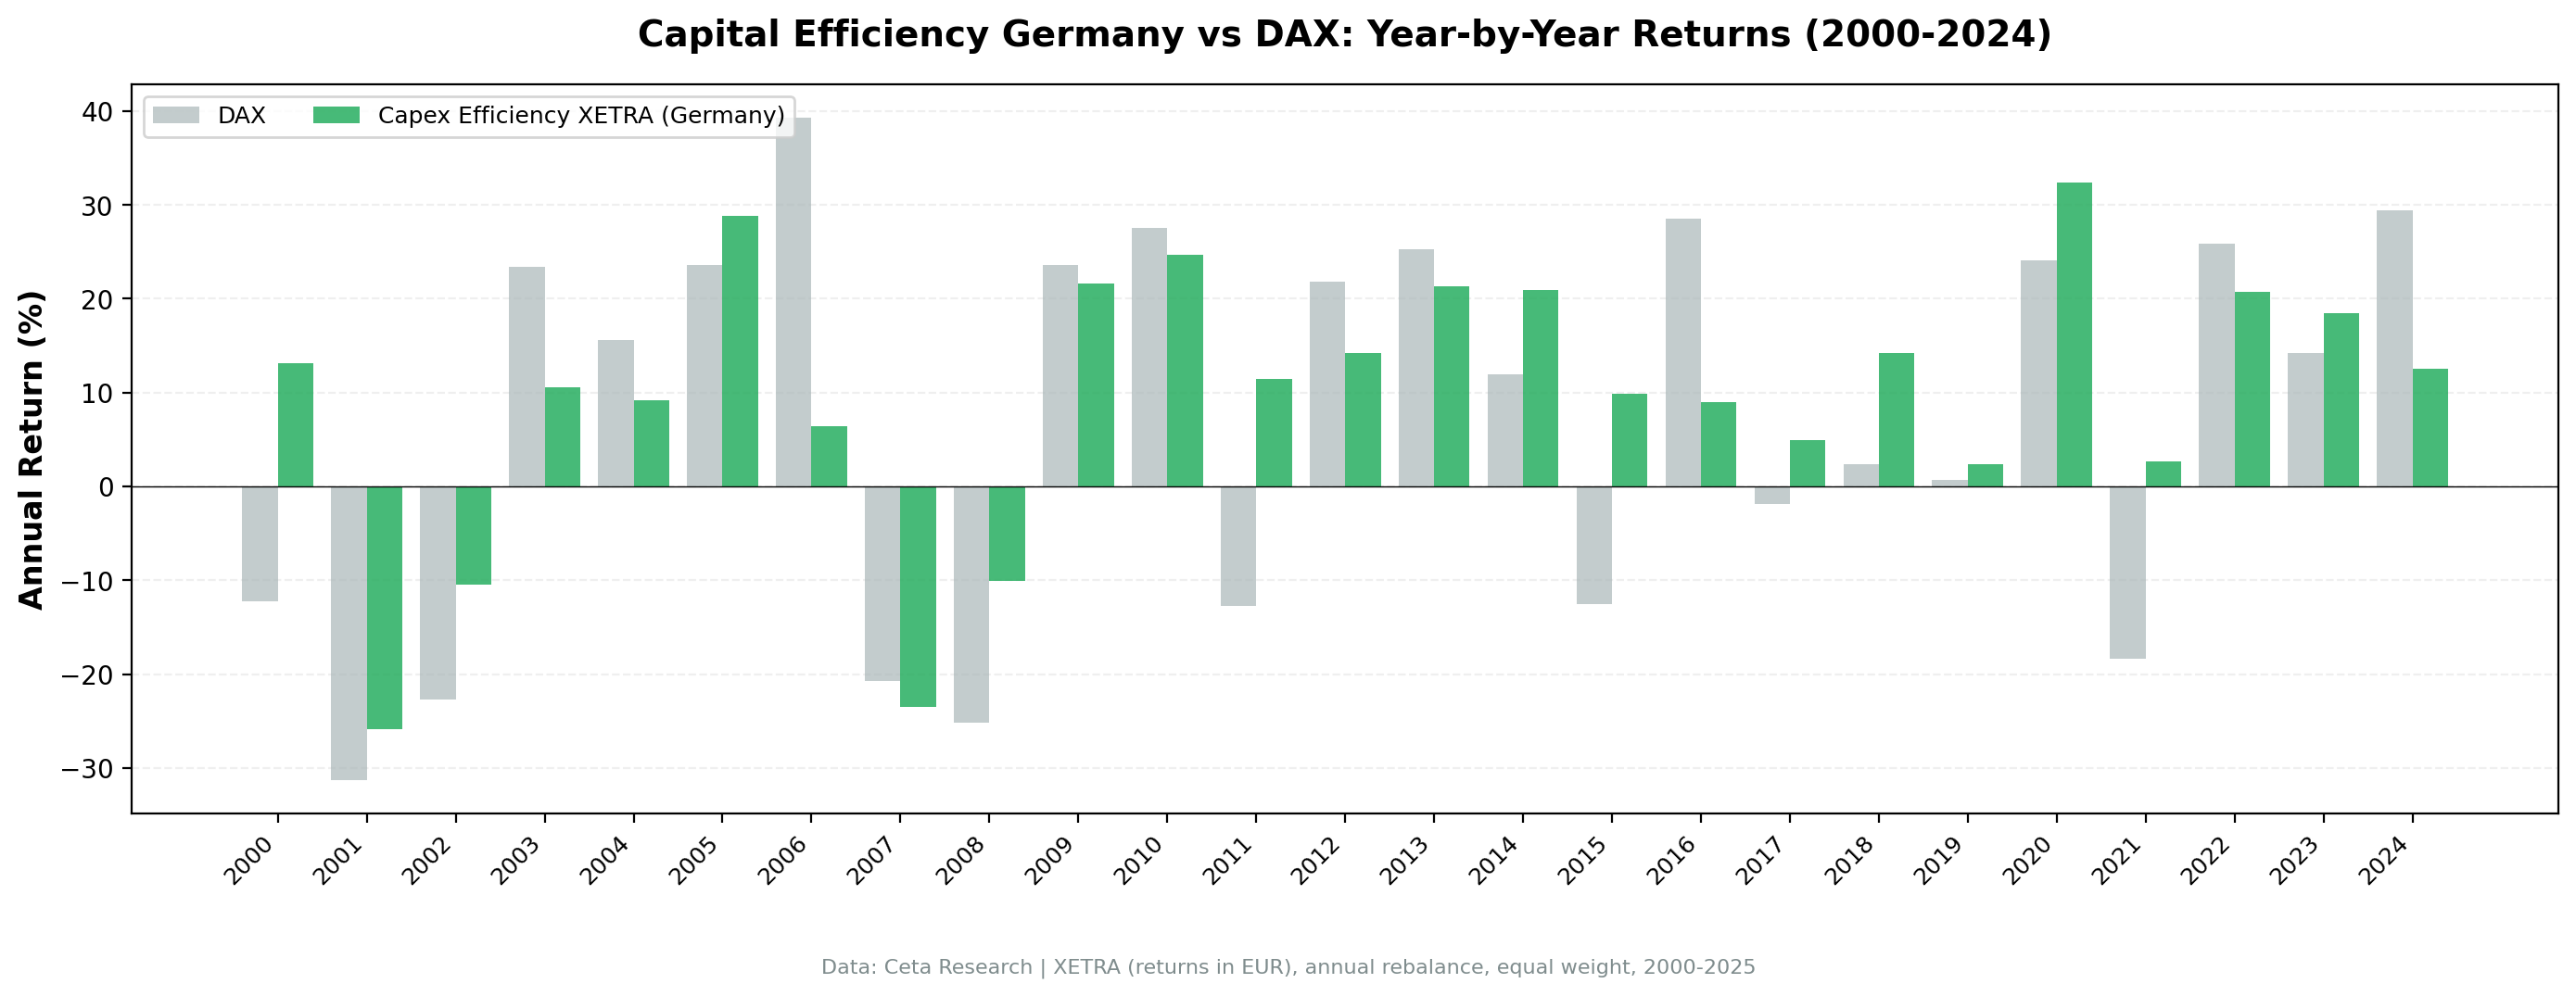
Annual return breakdown (selected years):
| Year | Strategy | DAX | Excess |
|---|---|---|---|
| 2001 | -25.9% | -31.3% | +5.5% |
| 2008 | -10.1% | -25.2% | +15.1% |
| 2011 | +11.4% | -12.7% | +24.1% |
| 2013 | +21.3% | +25.3% | -4.0% |
| 2020 | +32.4% | +24.1% | +8.3% |
| 2024 | +12.6% | +29.5% | -16.9% |
Why the Higher Drawdown?
The strategy actually had lower drawdown than the DAX (-33.59% vs -53.43%), which may seem counterintuitive for a higher-returning portfolio. Two factors explain it:
Quality filter protects capital. The ROIC and margin filters exclude cyclical companies that get hit hardest in downturns. When the DAX crashed -53.43% peak-to-trough, the capex efficiency portfolio fell only -33.59%. Cash generation plus low debt translates into a faster recovery.
Export exposure creates volatility. Many capital-efficient German companies (specialized machinery, chemicals, software) derive 50-80% of revenue from exports. When global demand contracts, these companies get hit. But the filter keeps them from being the worst-hit companies in the index.
Why It Still Works
Mittelstand quality. German companies that pass this screen tend to be durable. They're not growth stories or speculative plays. They're 50-year-old businesses with global #1 market share in esoteric industrial products. Low capex reflects competitive moats, not under-investment.
Profitability culture. German accounting and corporate governance emphasize cash generation and profitability over aggressive expansion. Companies that maintain 15%+ operating margins and 15%+ ROIC for years earn those metrics through operational discipline, not financial engineering.
Recovery consistency. After every major sell-off (2002-2003, 2008-2009, 2011-2012, 2020), the strategy recovered within 2-3 years. Capital efficiency provides downside resilience even when drawdowns are steep.
When It Works Best
Post-crisis recoveries. When European markets bottom and start climbing (2003-2007, 2013-2017, 2021-2024), capital-efficient companies lead the recovery. They don't need external financing to restart operations. Cash flow resumes immediately.
Weak Euro periods. When the Euro weakens, export-oriented German companies see revenue and margin expansion. Capital-light businesses capture this upside without needing to invest in new capacity.
Quality rotations. When investors shift from cyclicals to quality (2016-2018, 2022-2023), the screen's profitability filters align perfectly with market sentiment.
When It Struggles
Eurozone crisis redux. Any European sovereign debt scare or fiscal fragmentation risk (Italy elections, French deficits) triggers indiscriminate selling of XETRA stocks. Capital efficiency doesn't protect against systemic European risk.
Capex boom cycles. When Germany announces infrastructure stimulus or auto manufacturers ramp production, capital-intensive cyclicals outperform. The screen misses these rebounds.
Strong Euro headwinds. When the Euro strengthens significantly vs USD/CNY (2011, 2017), export revenues compress. Capital-light companies aren't immune to FX translation losses.
Run It Yourself
Current qualifying stocks (using TTM data):
SELECT
  p.symbol,
  p.companyName,
  ROUND(k.capexToRevenueTTM * 100, 1) AS capex_to_rev_pct,
  ROUND(k.capexToOperatingCashFlowTTM * 100, 1) AS capex_to_ocf_pct,
  ROUND(k.returnOnInvestedCapitalTTM * 100, 1) AS roic_pct,
  ROUND(r.operatingProfitMarginTTM * 100, 1) AS op_margin_pct,
  ROUND(k.marketCap / 1e9, 2) AS mktcap_bn_eur
FROM key_metrics_ttm k
JOIN financial_ratios_ttm r ON k.symbol = r.symbol
JOIN profile p ON k.symbol = p.symbol
WHERE k.capexToRevenueTTM > 0
  AND k.capexToRevenueTTM < 0.08
  AND k.capexToOperatingCashFlowTTM > 0
  AND k.capexToOperatingCashFlowTTM < 0.40
  AND k.returnOnInvestedCapitalTTM > 0.15
  AND r.operatingProfitMarginTTM > 0.15
  AND k.marketCap > 500000000
  AND p.exchange = 'XETRA'
ORDER BY k.returnOnInvestedCapitalTTM DESC
LIMIT 30
Run this query live: Data Explorer - Germany Capital Efficiency Screen
Backtest code (Python):
git clone https://github.com/ceta-research/backtests.git
cd backtests
python3 capex-efficiency/backtest.py --preset germany
Limitations
Sector bias. This screen systematically overweights specialized industrials, software, healthcare, chemicals. It underweights banks, autos, utilities. That's the signal, not a bug. German capital-light businesses are concentrated in niche manufacturing and services.
Under-investment risk. Low capex can signal asset harvesting. Check capex-to-depreciation trends over 3-5 years to distinguish efficiency from decline.
ROIC calculation. FMP's ROIC may differ from manual calculations. Rankings matter more than absolute values.
Survivorship bias. Some bankrupt or delisted companies may be missing from historical data. This likely overstates returns by 1-2 percentage points.
Currency returns. Results are in EUR, compared against the DAX (also EUR). This eliminates currency distortion from the benchmark comparison. USD-based investors face EUR/USD volatility, but the excess return over DAX is currency-neutral.
Related Content
This is part of a multi-market capital efficiency series:
- Capital Efficiency in India: 21.44% CAGR from Low-Capex Stocks - Best absolute returns
- Capital Efficiency US: How Asset-Light Businesses Beat the S&P 500 - Flagship study
- Capital Efficiency Switzerland: 10.20% CAGR, +7.13% vs SMI - 82.6% win rate
- Capital Efficiency UK: 9.34% CAGR, +8.12% vs FTSE 100
- Capital Efficiency Across Markets: Six-Market Comparison - Six-market study
Data: Ceta Research (FMP financial data warehouse), 2000-2025. Backtest code: github.com/ceta-research/backtests. Full methodology: METHODOLOGY.md.
Past performance does not guarantee future results. This is educational content, not investment advice.


