
Capital Efficiency in Switzerland: 10.20% CAGR, +7.13% vs SMI
Testing capital efficiency on SIX: low-capex, high-ROIC Swiss companies delivered 10.20% CAGR from 2000-2025, beating the SMI (3.07% CAGR) by 7.13%/year. 82.6% win rate, the highest of any market tested.

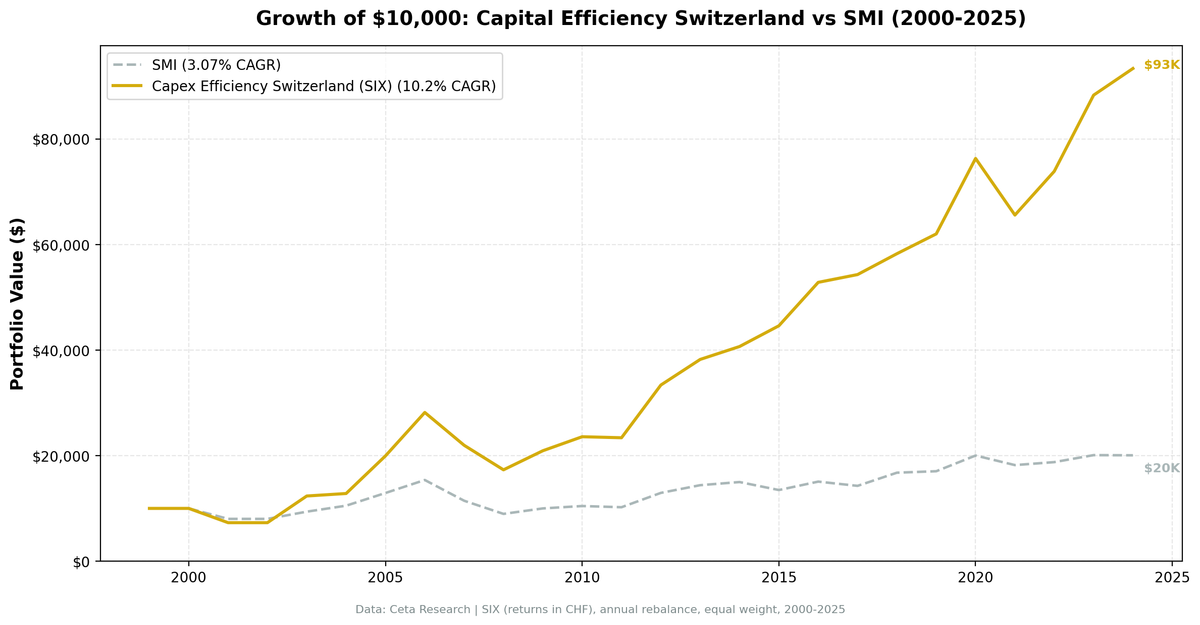
A portfolio of capital-efficient Swiss companies, those spending less than 8% of revenue on capex while earning above 15% ROIC, delivered 10.20% annualized returns from 2000 to 2025. The SMI returned 3.07% CAGR over the same period. That +7.13% annual excess is the second-widest of any market tested, and the 82.6% win rate (19 of 23 invested years) is the highest. Swiss "boring quality" businesses, specialty pharma, niche chemicals, premium consumer brands, generated remarkably consistent alpha against a benchmark that was dragged down by financials and a strong currency.
Contents
- The Strategy
- Methodology
- Results
- Why It Works in Switzerland
- When It Struggles
- Run It Yourself
- Limitations
- Related Content
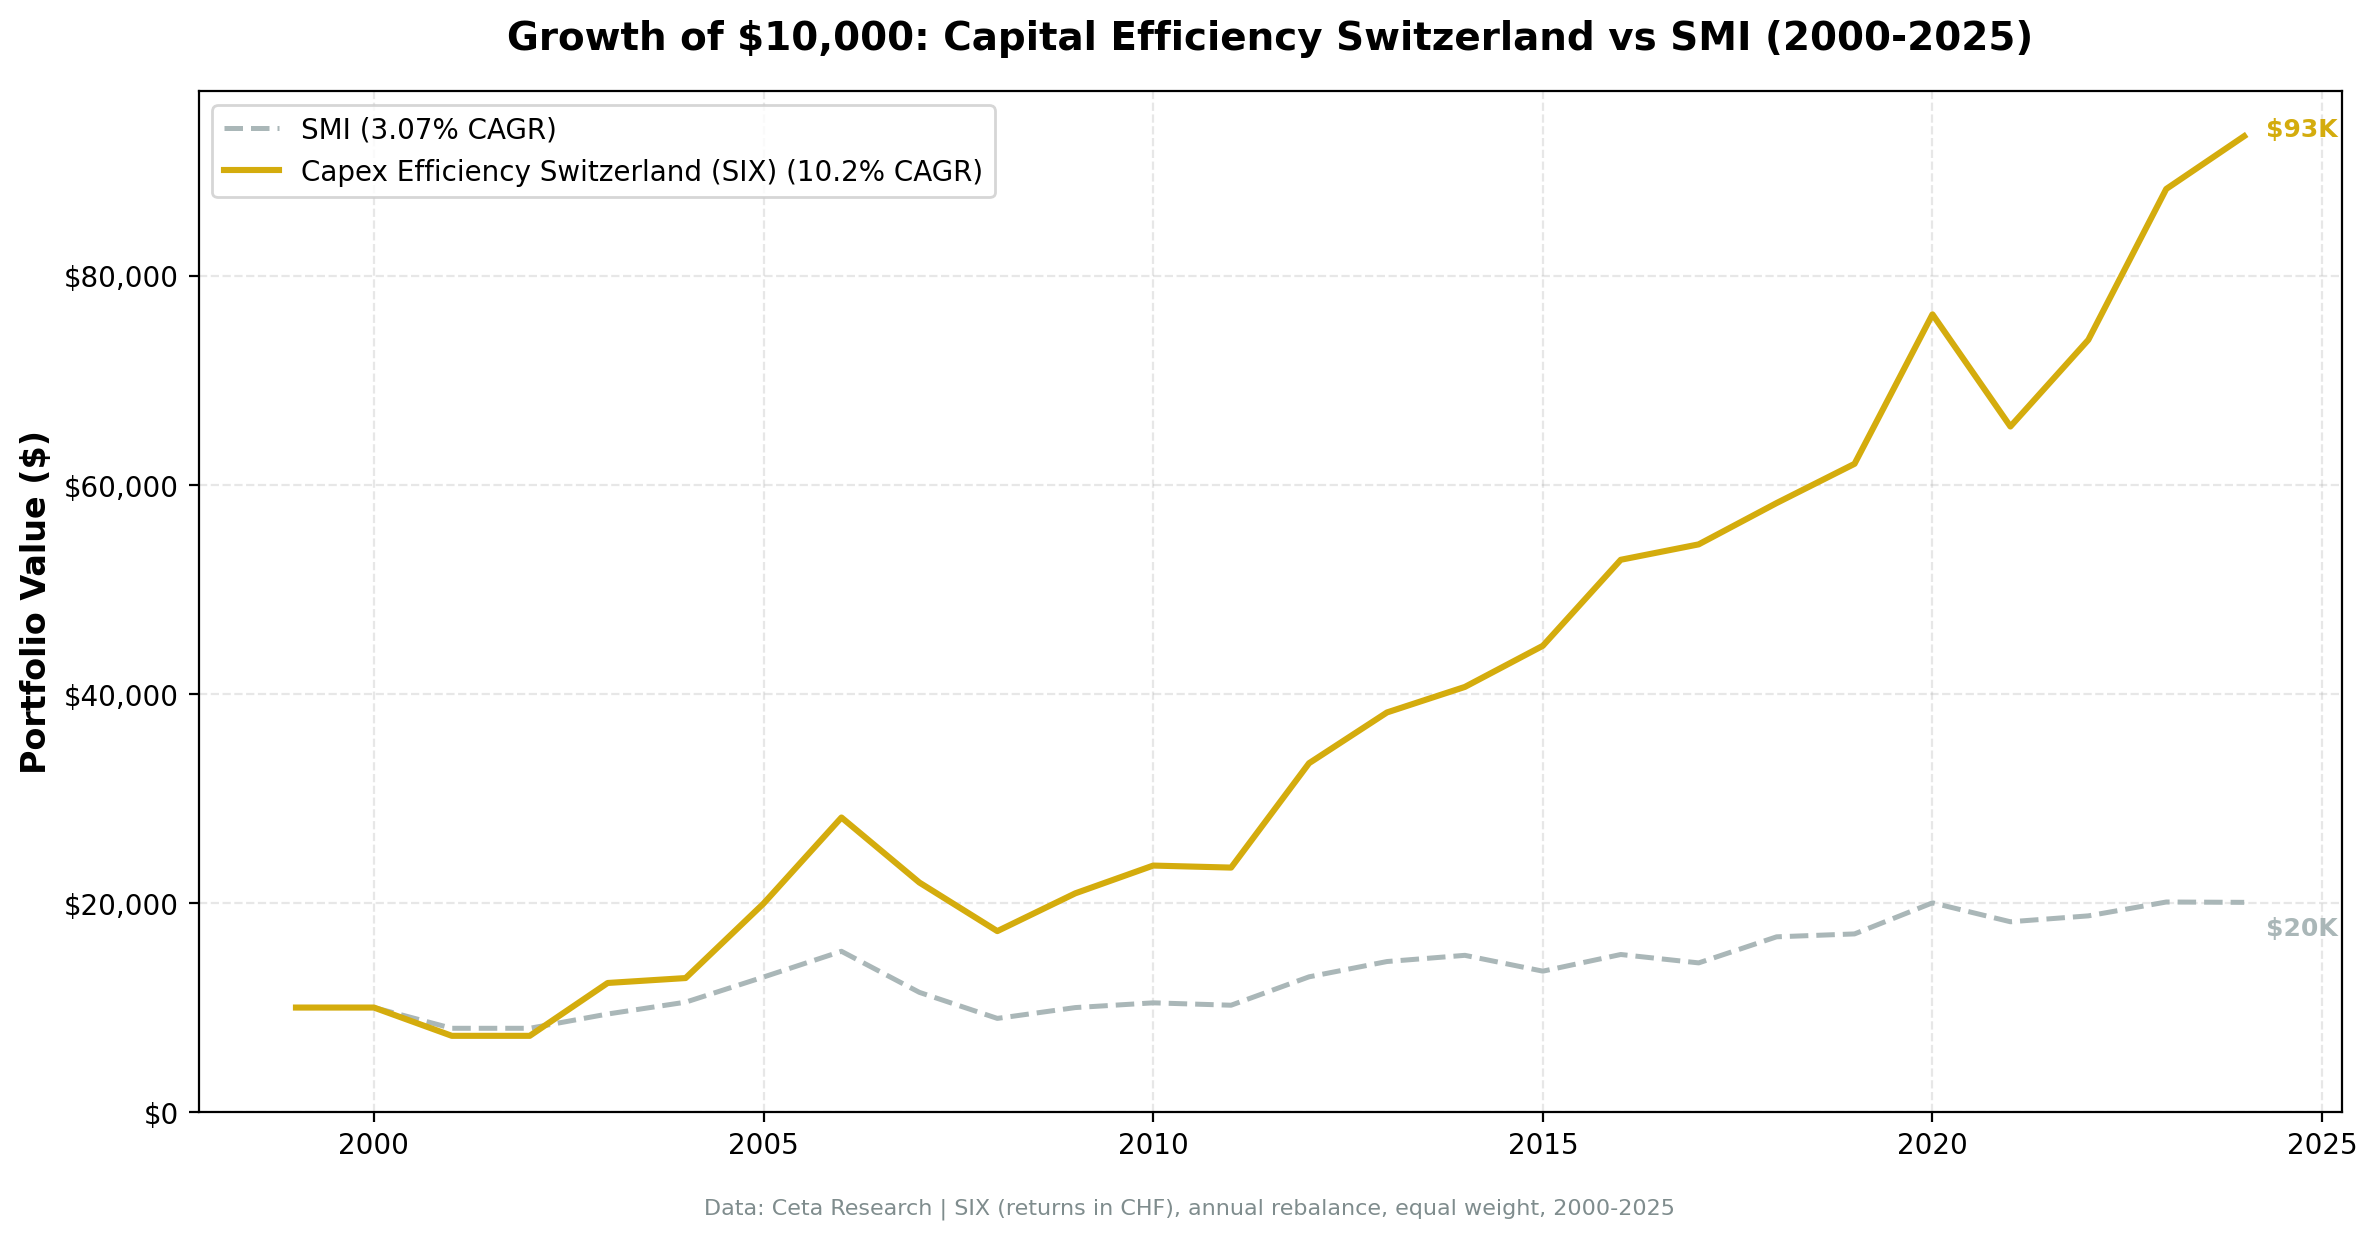
$10,000 invested in July 2000 grew to $93,380 by July 2025. The same amount in the SMI grew to $20,070.
Data: FMP financial data warehouse, 2000–2025. Updated May 2026.
The Strategy
Capital expenditure efficiency screens for companies that generate strong returns without constant reinvestment in fixed assets:
- Capex-to-Revenue < 8%: Asset-light business model
- Capex-to-Operating Cash Flow < 40%: Retains 60%+ of operating cash as free cash flow
- ROIC > 15%: Earns well above cost of capital
- Operating Margin > 15%: Pricing power through differentiation
The Swiss angle: SIX-listed companies that pass this screen tend to be global champions in niche markets. Specialty chemicals (Sika, Givaudan), pharma (Roche, Lonza), premium consumer brands, and high-margin industrials. They don't need heavy capex to defend their moats because the moats are built on expertise, regulation, and brand.
Portfolio construction: Top 30 stocks by highest ROIC, equal-weight, annual rebalancing in July (45-day lag for fiscal year filings). Cash position if fewer than 10 stocks qualify.
Methodology
Universe: SIX, all stocks with market cap > CHF 500M (~$570M USD) Data source: Ceta Research (FMP financial data warehouse) Backtest period: July 2000 - July 2025 (25 annual periods, 23 invested) Rebalancing: Annual (July) using FY data with 45-day filing lag Transaction costs: Size-tiered model (0.2-0.5% per trade, applied to individual stock returns) Benchmark: SMI (Swiss Market Index, local currency) Execution: Next-day close (market-on-close after signal date)
Signal (at each rebalance date): - Capex-to-Revenue < 8% - Capex-to-OCF < 40% - ROIC > 15% - Operating Margin > 15% - Market Cap > CHF 500M
From qualifying stocks, select top 30 by highest ROIC. Hold equal weight. If fewer than 10 qualify, hold cash (2 of 25 periods, both in 2000 and 2002 when FMP coverage was thin).
Full methodology: backtests/METHODOLOGY.md
Results
| Metric | Strategy | SMI | Excess |
|---|---|---|---|
| CAGR | 10.20% | 3.07% | +7.13% |
| Total Return | 834% | 101% | +733% |
| Sharpe Ratio | 0.412 | 0.180 | - |
| Sortino Ratio | 1.053 | 0.281 | - |
| Max Drawdown | -38.58% | -41.74% | - |
| Volatility (ann.) | 23.55% | 14.29% | - |
| Win Rate | 82.6% | N/A | - |
| Best Year | +69.3% (2003) | +17.1% | +52.3% |
| Worst Year | -27.1% (2001) | -19.9% | -7.2% |
| Avg Stocks per Period | 12 | - | - |
| Cash Periods | 2 / 25 | - | - |
Key observations:
- Highest win rate of any market tested. 19 of 23 invested years beat the SMI. The edge is unusually consistent year by year.
- Widest excess after the UK. +7.13% annual alpha vs SMI, second only to the UK's +8.12% vs FTSE 100.
- Volatility is the trade-off. 23.55% strategy vol vs 14.29% SMI vol. The portfolio took on significantly more volatility than the index. Small early portfolios (2-5 stocks in 2001-2005) drove much of that volatility.
- Lower max drawdown than the index. -38.58% vs SMI's -41.74%, despite higher volatility.
Annual return breakdown (selected years):
| Year | Strategy | SMI | Excess |
|---|---|---|---|
| 2003 | +69.3% | +17.1% | +52.3% |
| 2008 | -21.2% | -21.8% | +0.6% |
| 2012 | +42.7% | +26.6% | +16.1% |
| 2015 | +9.7% | -10.1% | +19.8% |
| 2017 | +2.8% | -5.3% | +8.1% |
| 2020 | +23.1% | +17.5% | +5.6% |
| 2023 | +19.5% | +7.1% | +12.5% |
| 2024 | +5.7% | -0.2% | +5.9% |
Why It Works in Switzerland
Concentrated quality. SIX is a small exchange dominated by global champions: Nestle, Roche, Novartis, Sika, Givaudan, Lonza, Geberit, ABB, Schindler. The capex efficiency screen naturally selects this cohort plus their mid-cap peers. There aren't many capital-intensive industrials or commodity producers on SIX to dilute the universe.
SMI weakness creates room. The SMI returned only 3.07% CAGR over 25 years, dragged by financial-sector heavyweights (UBS, Credit Suisse pre-collapse, Zurich Insurance) and a strong CHF that hurt the index's export-heavy giants when translated back. The capex efficiency screen excluded most of the financial drag.
Defensive sector mix. Swiss pharma and food/consumer companies are textbook capital-light businesses with pricing power. When global markets sold off (2008, 2011-12, 2020, 2022), these names held up better than cyclicals. The strategy's lower max drawdown than the SMI itself reflects that defensive bias.
Currency-neutral comparison. Results are in CHF. Both the strategy and the SMI are in the same currency, so the +7.13% excess is a pure equity-selection effect, not a currency artifact.
When It Struggles
Early-period thin portfolios. From 2001 to 2007 the portfolio held only 2-9 stocks. That concentration produced enormous swings: -27% in 2001, +69% in 2003, +56% in 2005. The 82.6% win rate doesn't compensate for the magnitude of individual losses when single positions blow up.
CHF strength against export earnings. Many qualifying Swiss companies derive 80-90% of revenue outside Switzerland. When the CHF strengthens (notably 2011 SNB ceiling break, 2015 floor removal), reported CHF earnings compress even if the underlying business is healthy. The screen doesn't isolate against this.
Pharma headwinds. When pharma sentiment turns negative (drug pricing debates, patent cliffs), Swiss pharma names get punished disproportionately because they're a third of the index. The screen has the same exposure.
Run It Yourself
Current qualifying Swiss stocks (using TTM data):
SELECT
  p.symbol,
  p.companyName,
  ROUND(k.capexToRevenueTTM * 100, 1) AS capex_to_rev_pct,
  ROUND(k.capexToOperatingCashFlowTTM * 100, 1) AS capex_to_ocf_pct,
  ROUND(k.returnOnInvestedCapitalTTM * 100, 1) AS roic_pct,
  ROUND(r.operatingProfitMarginTTM * 100, 1) AS op_margin_pct,
  ROUND(k.marketCap / 1e9, 2) AS mktcap_bn_chf
FROM key_metrics_ttm k
JOIN financial_ratios_ttm r ON k.symbol = r.symbol
JOIN profile p ON k.symbol = p.symbol
WHERE k.capexToRevenueTTM > 0
  AND k.capexToRevenueTTM < 0.08
  AND k.capexToOperatingCashFlowTTM > 0
  AND k.capexToOperatingCashFlowTTM < 0.40
  AND k.returnOnInvestedCapitalTTM > 0.15
  AND r.operatingProfitMarginTTM > 0.15
  AND k.marketCap > 500000000
  AND p.exchange = 'SIX'
ORDER BY k.returnOnInvestedCapitalTTM DESC
LIMIT 30
Run this query live: Data Explorer: Switzerland Capital Efficiency Screen
Backtest code (Python):
git clone https://github.com/ceta-research/backtests.git
cd backtests
python3 capex-efficiency/backtest.py --preset switzerland
Limitations
Sector bias is the signal. This strategy systematically overweights specialty chemicals, pharma, and consumer brands. It underweights banks, insurance, autos, and watchmakers. That's the screen working as designed, not a flaw to fix.
Small early portfolios. 2001-2005 had only 2-5 qualifying stocks per period. Single-stock risk was extreme during that window. The 23.55% strategy volatility is heavily influenced by that early concentration. From 2008 onward portfolios grew to 9-24 stocks.
ROIC calculation differences. Multiple ROIC definitions exist. FMP's TTM ROIC may differ from manual calculations. Rankings matter more than absolute values.
Survivorship bias. FMP data generally includes delisted stocks, but Swiss coverage has gaps before 2005. Some bankrupt or acquired companies may be missing. This likely overstates absolute returns by 1-2 percentage points.
Currency returns. Results are in CHF, compared against the SMI (also CHF). The excess is currency-neutral. USD-based investors face CHF/USD volatility on top, but the long-run CHF appreciation has historically helped USD-denominated returns.
Related Content
This is part of a multi-market capital efficiency series:
- Capital Efficiency in India: 21.44% CAGR from Low-Capex Stocks - Best absolute returns
- Capital Efficiency US: How Asset-Light Businesses Beat the S&P 500 - Flagship study
- Capital Efficiency UK: 9.34% CAGR, +8.12% vs FTSE 100 - Widest excess
- Capital Efficiency Germany: 8.56% CAGR, +3.52% vs DAX
- Capital Efficiency Across Markets: Six-Market Comparison - Six-market study
Data: Ceta Research (FMP financial data warehouse), 2000-2025. Backtest code: github.com/ceta-research/backtests. Full methodology: METHODOLOGY.md.
Past performance does not guarantee future results. This is educational content, not investment advice.


