
Capital Efficiency: How Asset-Light Businesses Beat the S&P 500 by 2.54%/Year
Testing capital efficiency across NYSE, NASDAQ, AMEX: companies spending <8% of revenue on capex while earning >15% ROIC delivered 10.40% CAGR from 2000-2025. Asset-light businesses compound faster with less reinvestment drag.

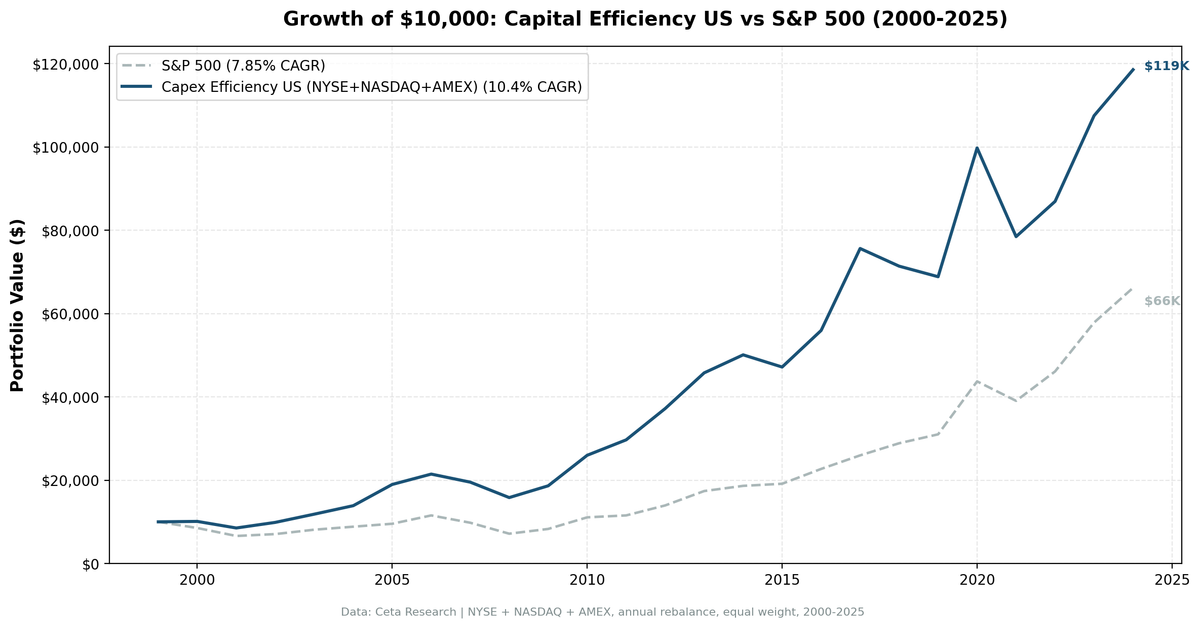
A portfolio of capital-efficient US companies, those spending less than 8% of revenue on capex while earning above 15% ROIC, delivered 10.40% annualized returns from 2000 to 2025. That's 2.54 percentage points ahead of the S&P 500, with a 64% win rate and Sharpe ratio of 0.463. The academic literature consistently shows that heavy asset growth predicts poor returns. This backtest quantifies the flip side: businesses that generate strong returns without needing constant reinvestment compound faster and more reliably than capital-intensive peers.
Contents
- The Strategy
- Academic Foundation
- Methodology
- Results
- Why It Works
- When It Struggles
- Run It Yourself
- Limitations
- Related Content
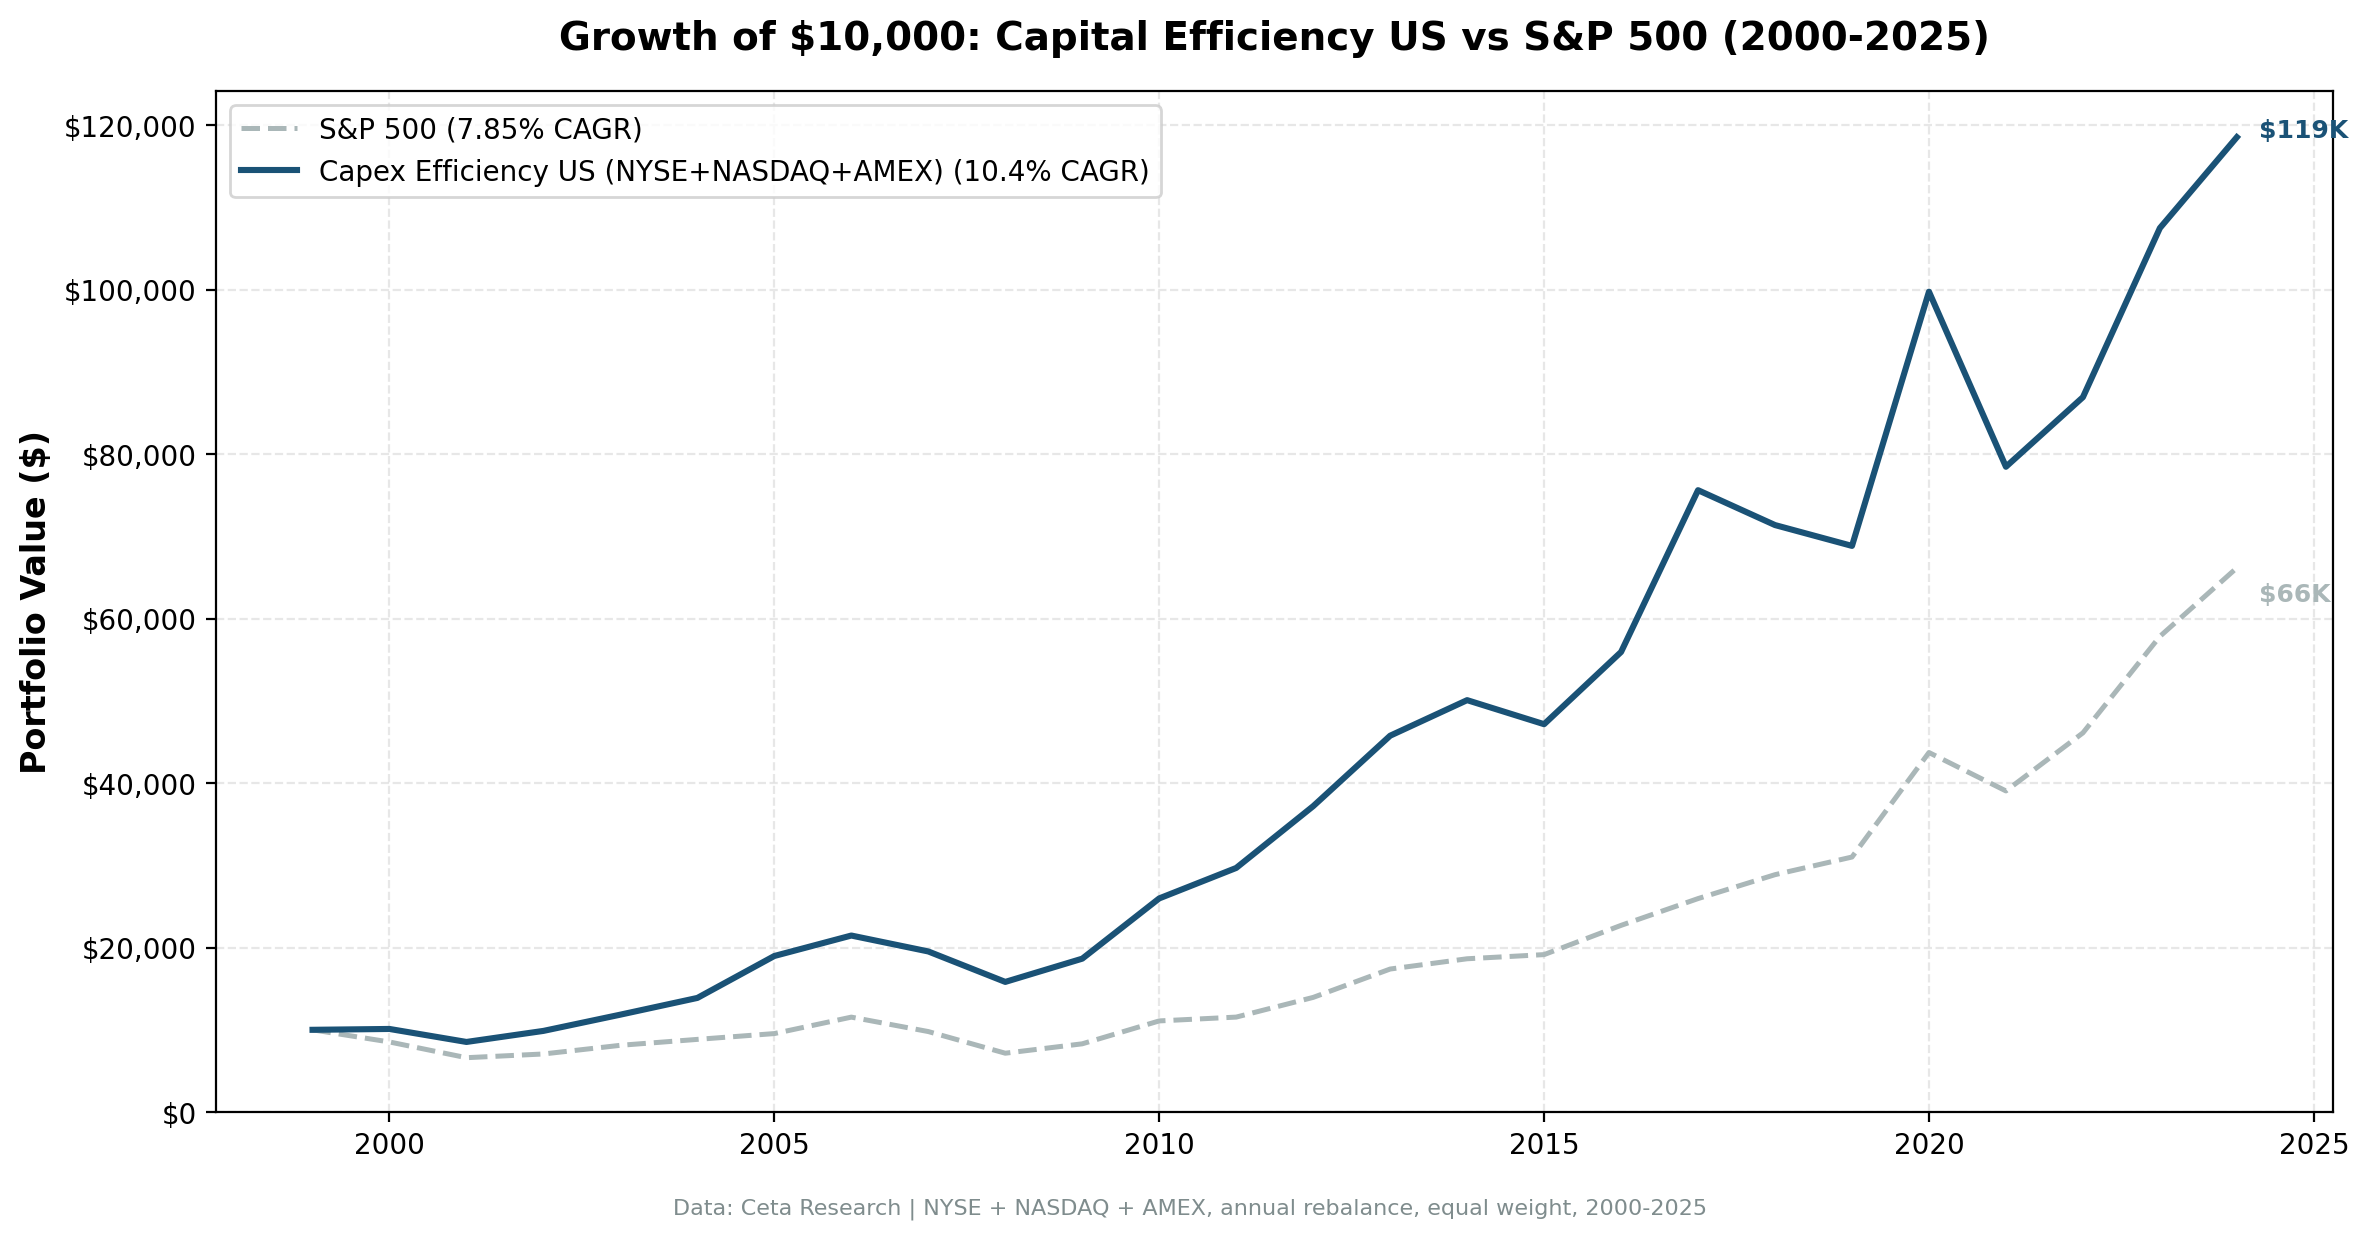
$10,000 invested in July 2000 grew to $118,530 by July 2025. The same amount in SPY grew to $66,170.
Data: FMP financial data warehouse, 2000–2025. Updated May 2026.
The Strategy
Capital expenditure efficiency targets companies that convert revenue into shareholder returns with minimal reinvestment drag. Four filters identify this profile:
- Capex-to-Revenue < 8%: Asset-light business model (software, services, financials)
- Capex-to-Operating Cash Flow < 40%: Retains 60%+ of operating cash as free cash flow
- ROIC > 15%: Earns well above cost of capital
- Operating Margin > 15%: Pricing power, not margin compression
The combination screens for businesses that don't need to plow revenue back into equipment, plants, or infrastructure. These companies fund buybacks more easily, carry less debt, and survive downturns with less balance sheet stress.
Portfolio construction: Top 30 stocks by highest ROIC, equal-weight, annual rebalancing in July (45-day lag for fiscal year filings). Cash position if fewer than 10 stocks qualify.
Academic Foundation
The relationship between capital investment and stock returns has been studied extensively:
Cooper, Gulen & Schill (2008) documented the "asset growth anomaly." Firms in the highest decile of total asset growth underperformed firms in the lowest decile by ~20% per year. The effect was robust across size groups and international markets. Investors overreact to growth narratives accompanying heavy investment, bidding up expanding firms and neglecting leaner ones.
Titman, Wei & Xie (2004) found that firms with heavy capital spending underperformed. The effect was strongest among firms with discretionary spending and poor governance. Unchecked management tends to overinvest, and the market is slow to punish it.
Novy-Marx (2013) showed that gross profitability predicted returns as strongly as value metrics. Combining profitability with value produced far better results than either alone. For capex efficiency, the implication is direct: screening for low capex isn't enough. You need evidence that the company earns strong returns on the capital it deploys.
This strategy operationalizes these findings. Low capex intensity plus high ROIC equals a business that converts revenue into returns with minimal friction.
Methodology
Universe: NYSE + NASDAQ + AMEX, all stocks with market cap > $1B USD Data source: Ceta Research (FMP financial data warehouse) Backtest period: July 2000 - July 2025 (25 annual periods) Rebalancing: Annual (July) using FY data with 45-day filing lag Transaction costs: Size-tiered model (0.2-0.5% per trade, applied to individual stock returns) Benchmark: S&P 500 (SPY) Execution: Next-day close (market-on-close after signal date)
Signal (at each rebalance date): - Capex-to-Revenue < 8% - Capex-to-OCF < 40% - ROIC > 15% - Operating Margin > 15% - Market Cap > $1B
From qualifying stocks, select top 30 by highest ROIC. Hold equal weight. If fewer than 10 qualify, hold cash (0 of 25 periods).
Full methodology: backtests/METHODOLOGY.md
Results
| Metric | Strategy | S&P 500 | Excess |
|---|---|---|---|
| CAGR | 10.40% | 7.85% | +2.54% |
| Total Return | 1,085% | 562% | +524% |
| Sharpe Ratio | 0.463 | 0.352 | - |
| Sortino Ratio | 1.060 | 0.628 | - |
| Max Drawdown | -26.27% | -38.01% | - |
| Volatility (ann.) | 18.12% | 16.63% | - |
| Win Rate | 64.0% | N/A | - |
| Best Year | +44.9% (2020) | 41.0% | +3.9% |
| Worst Year | -21.3% (2021) | -10.7% | -10.7% |
| Avg Stocks per Period | 23 | - | - |
| Cash Periods | 0 / 25 | - | - |
Key observations:
- Consistent outperformance: 16 out of 25 years beat SPY (64% win rate), with +2.54% excess CAGR
- Lower drawdown than the index: -26.27% max drawdown vs SPY's -38.01%. Strategy held up better in crashes.
- No cash periods: Every rebalancing period had 10+ qualifying stocks
- Volatility trade-off: 18.12% annual volatility (close to SPY's 16.63%) with a meaningful CAGR premium
- Post-2008 strength: Strategy particularly strong during 2010-2020 as markets rotated toward profitability
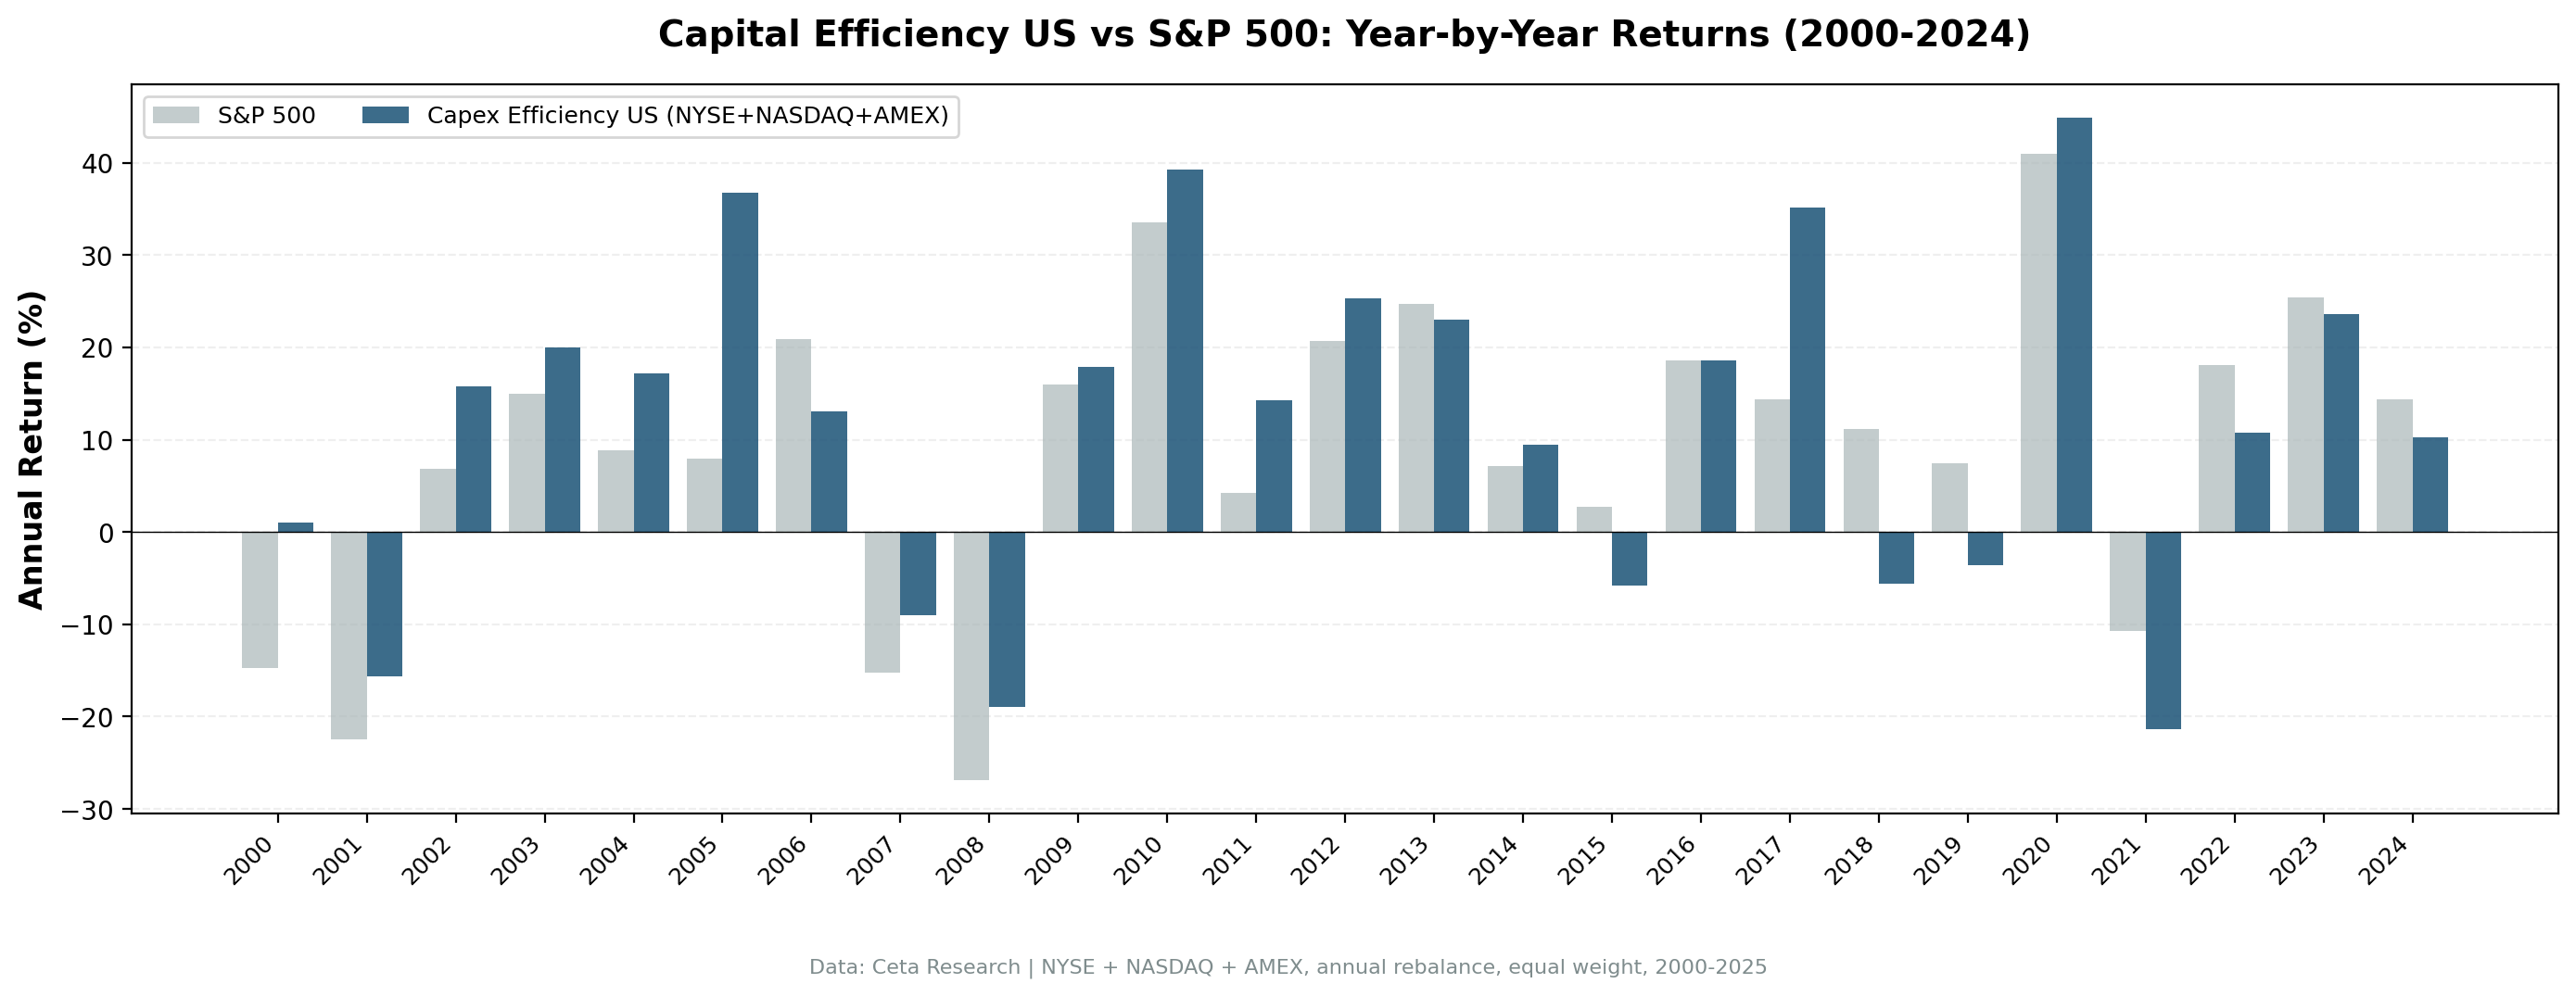
Annual return breakdown (selected years):
| Year | Strategy | S&P 500 | Excess |
|---|---|---|---|
| 2000 | +1.0% | -14.8% | +15.8% |
| 2005 | +36.8% | +8.0% | +28.8% |
| 2008 | -19.0% | -26.9% | +7.9% |
| 2010 | +39.3% | +33.5% | +5.7% |
| 2017 | +35.2% | +14.3% | +20.8% |
| 2020 | +44.9% | +41.0% | +3.9% |
| 2024 | +10.3% | +14.4% | -4.1% |
Why It Works
Structural advantage. Companies that generate strong returns without needing constant reinvestment have more options: pay dividends, buy back stock, make acquisitions, or simply bank cash. Capital-intensive peers must reinvest to maintain competitiveness. That reinvestment is expensive (debt or equity dilution) and often generates mediocre returns (empire-building, overexpansion).
Market efficiency in profitability. The US market prices ROIC reasonably well. Companies earning 15%+ returns on invested capital trade at premium multiples. But it underprices the persistence of those returns when capex requirements are low. A software company earning 20% ROIC with 3% capex intensity will likely still earn 15%+ in five years. A manufacturer earning 20% ROIC with 25% capex intensity faces constant competitive pressure to maintain that edge.
Quality rotation cycles. After speculative run-ups (dot-com boom, SPAC mania), the market reprices toward cash flow and profitability. Capital-efficient companies are the destination of that rotation. They're boring until they're not.
When It Struggles
Early-cycle capex booms. When the Fed cuts rates aggressively or fiscal stimulus hits, capital-intensive cyclicals (industrials, materials, energy) snap back hard. The capex efficiency screen misses these rebounds. That's by design, but it creates short periods of underperformance (2001-2002, 2009-2010, 2020 post-lockdown).
Commodity super-cycles. Energy and mining companies generate eye-watering cash flows during commodity booms despite massive capex. The screen systematically excludes them. During extended commodity run-ups (2003-2008 oil, 2020-2022 commodities), the strategy lags.
Growth mania. When the market chases revenue growth regardless of profitability (2017-2021 SaaS bubble), capital efficiency gets temporarily ignored. High-burn, negative-ROIC companies outperform until they don't.
Run It Yourself
Current qualifying stocks (using TTM data):
SELECT
  p.symbol,
  p.companyName,
  ROUND(k.capexToRevenueTTM * 100, 1) AS capex_to_rev_pct,
  ROUND(k.capexToOperatingCashFlowTTM * 100, 1) AS capex_to_ocf_pct,
  ROUND(k.returnOnInvestedCapitalTTM * 100, 1) AS roic_pct,
  ROUND(r.operatingProfitMarginTTM * 100, 1) AS op_margin_pct,
  ROUND(k.marketCap / 1e9, 2) AS mktcap_bn
FROM key_metrics_ttm k
JOIN financial_ratios_ttm r ON k.symbol = r.symbol
JOIN profile p ON k.symbol = p.symbol
WHERE k.capexToRevenueTTM > 0
  AND k.capexToRevenueTTM < 0.08
  AND k.capexToOperatingCashFlowTTM > 0
  AND k.capexToOperatingCashFlowTTM < 0.40
  AND k.returnOnInvestedCapitalTTM > 0.15
  AND r.operatingProfitMarginTTM > 0.15
  AND k.marketCap > 1000000000
  AND p.exchange IN ('NYSE', 'NASDAQ', 'AMEX')
ORDER BY k.returnOnInvestedCapitalTTM DESC
LIMIT 30
Run this query live: Data Explorer - US Capital Efficiency Screen
Backtest code (Python):
git clone https://github.com/ceta-research/backtests.git
cd backtests
python3 capex-efficiency/backtest.py --preset us
Limitations
Sector bias is the signal. This strategy systematically overweights software, financials, healthcare, services. It underweights industrials, energy, utilities, materials. That's not a bug. The screen is deliberately selecting capital-light business models. If you want sector neutrality, this isn't it.
Under-investment risk. Low capex can signal milking existing assets rather than efficiency. Check capex-to-depreciation over multiple years. If it's well below 1.0 for 3+ years, the company may be under-investing. That works until equipment ages and competitiveness erodes.
ROIC calculation differences. Multiple ROIC definitions exist. FMP's TTM ROIC may differ from manual calculations. The ranking relative to peers matters more than absolute values.
Survivorship bias. FMP data generally includes delisted stocks, but coverage isn't perfect. Some bankrupt companies may be missing. This likely overstates absolute returns by 1-2 percentage points.
Index mismatch. We test against the full exchange universe (NYSE+NASDAQ+AMEX), not just S&P 500 constituents. The broader universe captures more qualifying stocks but may produce different results than an S&P 500-constrained backtest.
Related Content
This is part of a multi-market capital efficiency series:
- Capital Efficiency in India: 21.44% CAGR from Low-Capex Stocks - Best performer
- Capital Efficiency Switzerland: 10.20% CAGR, +7.13% vs SMI - 82.6% win rate
- Capital Efficiency Germany: 8.56% CAGR, +3.52% vs DAX
- Capital Efficiency UK: 9.34% CAGR, +8.12% vs FTSE 100
- Capital Efficiency Across Markets: Six-Market Comparison - Six-market study
Data: Ceta Research (FMP financial data warehouse), 2000-2025. Backtest code: github.com/ceta-research/backtests. Full methodology: METHODOLOGY.md.
Past performance does not guarantee future results. This is educational content, not investment advice.


