
Capital Efficiency in India: 21.44% CAGR from Low-Capex, High-ROIC Companies
Testing capital efficiency in India (NSE): companies spending <8% of revenue on capex while earning >15% ROIC delivered 21.44% CAGR from 2004-2025, beating the Sensex by 6.96%/year. Asset-light businesses thrive in India's growth economy.

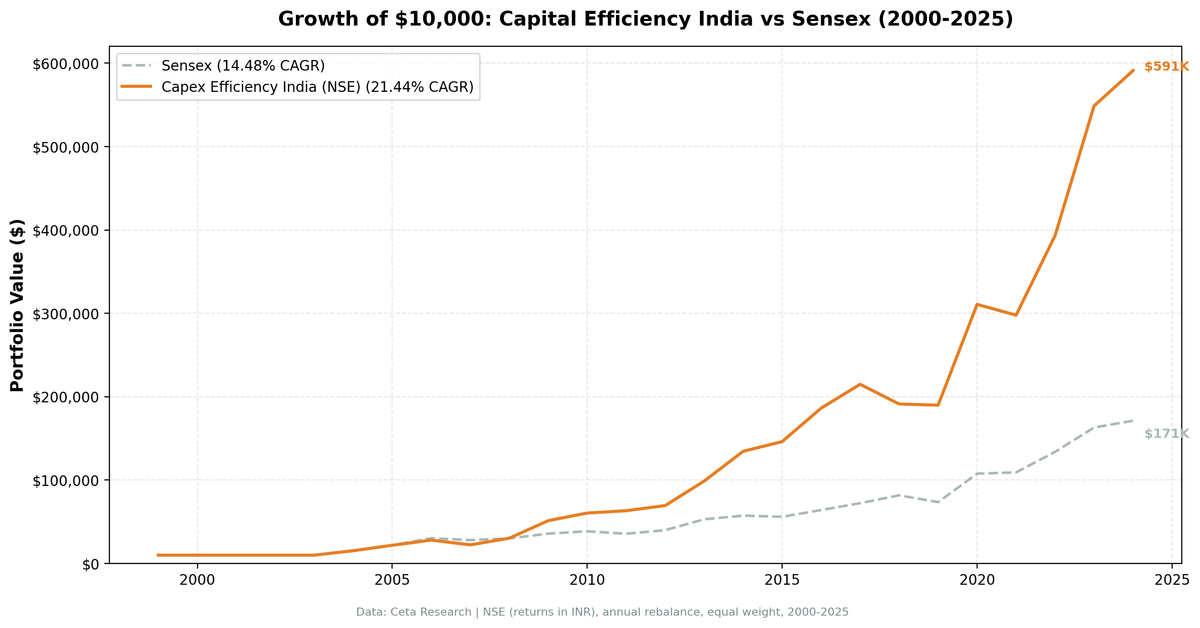
A portfolio of capital-efficient Indian companies, those spending less than 8% of revenue on capex while earning above 15% ROIC, delivered 21.44% annualized returns from 2004 to 2025. That's 6.96 percentage points ahead of the Sensex, with a Sharpe ratio of 0.621 and maximum drawdown of -20.37%. Asset-light businesses don't just work in developed markets. In India's high-growth economy, they compound faster and consistently beat capital-intensive peers.
Contents
- The Strategy
- Why India?
- Methodology
- Results
- When It Works Best
- When It Struggles
- Run It Yourself
- Limitations
- Related Content
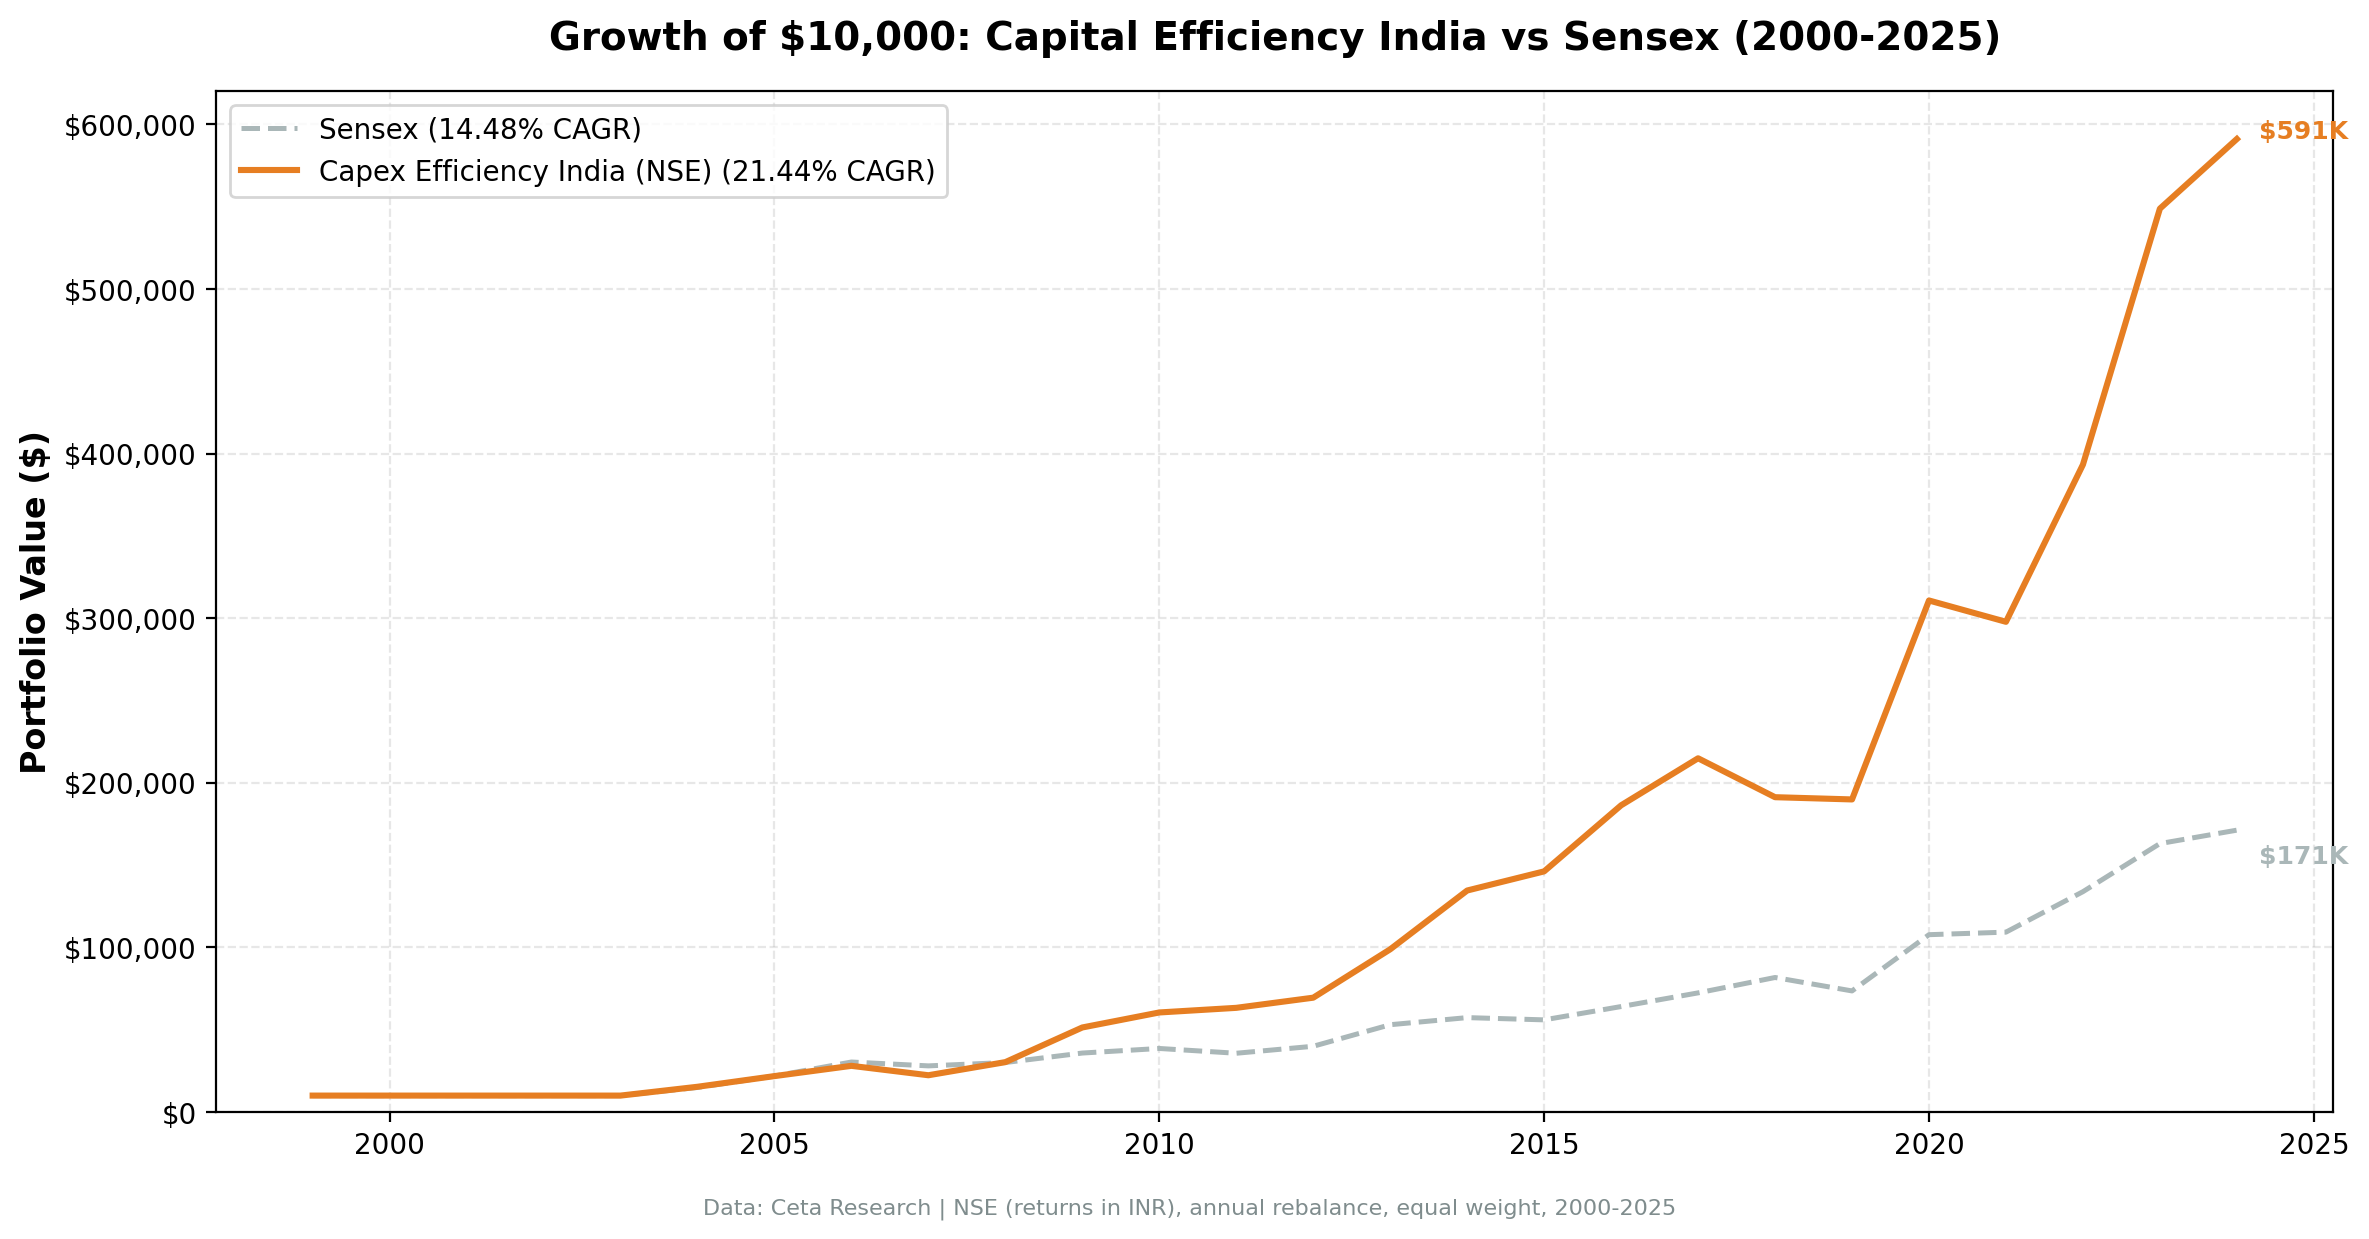
$10,000 invested in July 2004 grew to $591,310 by July 2025. The Sensex returned 14.48% CAGR over the same period.
Data: FMP financial data warehouse, 2000–2025. Updated May 2026.
The Strategy
Capital expenditure efficiency identifies companies that generate strong returns without needing to constantly reinvest in fixed assets. The signal screens for four characteristics:
- Capex-to-Revenue < 8%: Asset-light business model (services, software, financials vs. heavy industrials)
- Capex-to-Operating Cash Flow < 40%: Retains 60%+ of operating cash as free cash flow
- ROIC > 15%: Earns well above cost of capital on deployed capital
- Operating Margin > 15%: Pricing power, not just margin compression
The combination targets businesses that convert revenue into cash without needing to plow it back into equipment, plants, or infrastructure. These companies compound faster, fund buybacks more easily, and survive downturns with less balance sheet stress.
Portfolio construction: Top 30 stocks by highest ROIC, equal-weight, annual rebalancing in July (45-day lag for fiscal year filings). Cash position if fewer than 10 stocks qualify.
Why India?
India delivered the strongest absolute returns of any market tested (US, UK, Germany, Switzerland, China). Three factors explain why:
Growth economy meets market efficiency. India's GDP grew 6-7% annually over the backtest period. Capital-light businesses in a growth economy don't need to invest heavily to capture market share. They ride secular tailwinds (rising consumption, digitization, services expansion) without the capex burden of building physical infrastructure. The market rewards this efficiency consistently.
Large qualifying universe. NSE produced enough qualifying stocks to maintain full portfolios (20 stocks on average across the 21 invested years) from 2004 onward. The exchange lists many mid-cap services, IT, pharma, and financial companies that naturally fit the capital-efficiency profile. The screen isn't fighting against the exchange structure.
Drawdown that recovered. The strategy delivered 21.44% CAGR while drawdown bottomed at -20.37% (in the 2007-08 period). When global markets sold off (2008, 2020), capital-efficient Indian companies proved resilient. Cash generation and low debt made them less vulnerable to credit crunches and funding freezes, and the portfolio recovered within two years.
Methodology
Universe: NSE, all stocks with market cap > ₹20B (~$240M USD) Data source: Ceta Research (FMP financial data warehouse) Backtest period: July 2000 - July 2025 (25 annual periods, 21 invested) Rebalancing: Annual (July) using FY data with 45-day filing lag Transaction costs: Size-tiered model (0.2-0.5% per trade, applied to individual stock returns) Benchmark: Sensex (BSE 30 index, local currency) Execution: Next-day close (market-on-close after signal date)
Signal (at each rebalance date): - Capex-to-Revenue < 8% - Capex-to-OCF < 40% - ROIC > 15% - Operating Margin > 15% - Market Cap > ₹20B
From qualifying stocks, select top 30 by highest ROIC. Hold equal weight. If fewer than 10 qualify, hold cash (4 of 25 periods, all in 2000-2003 when FMP coverage was limited).
Full methodology: backtests/METHODOLOGY.md
Results
| Metric | Strategy | Sensex | Excess |
|---|---|---|---|
| CAGR | 21.44% | 14.48% | +6.96% |
| Total Return | 5,813% | 1,613% | +4,200% |
| Sharpe Ratio | 0.621 | 0.441 | - |
| Sortino Ratio | 1.979 | 1.312 | - |
| Max Drawdown | -20.37% | -9.98% | - |
| Volatility (ann.) | 24.07% | 18.12% | - |
| Win Rate | 71.4% | N/A | - |
| Best Year | +69.4% (2009) | 19.1% | +50.3% |
| Worst Year | -20.4% (2007) | -7.7% | -12.7% |
| Avg Stocks per Period | 20 | - | - |
| Cash Periods | 4 / 25 | - | - |
Key observations:
- Consistent outperformance: 15 out of 21 invested years beat the Sensex (71.4% win rate)
- Drawdown of -20.4% in the 2007 period, recovered within two years
- Early cash periods: 2000-2003 had fewer than 10 qualifying stocks (limited FMP coverage). From 2004 onward, full capital deployed every period.
- Strong Sharpe: 0.621, the highest of any market tested except Switzerland
- Volatility trade-off: 24.07% annual volatility (higher than Sensex's 18.12%) but rewarded with +6.96% excess CAGR
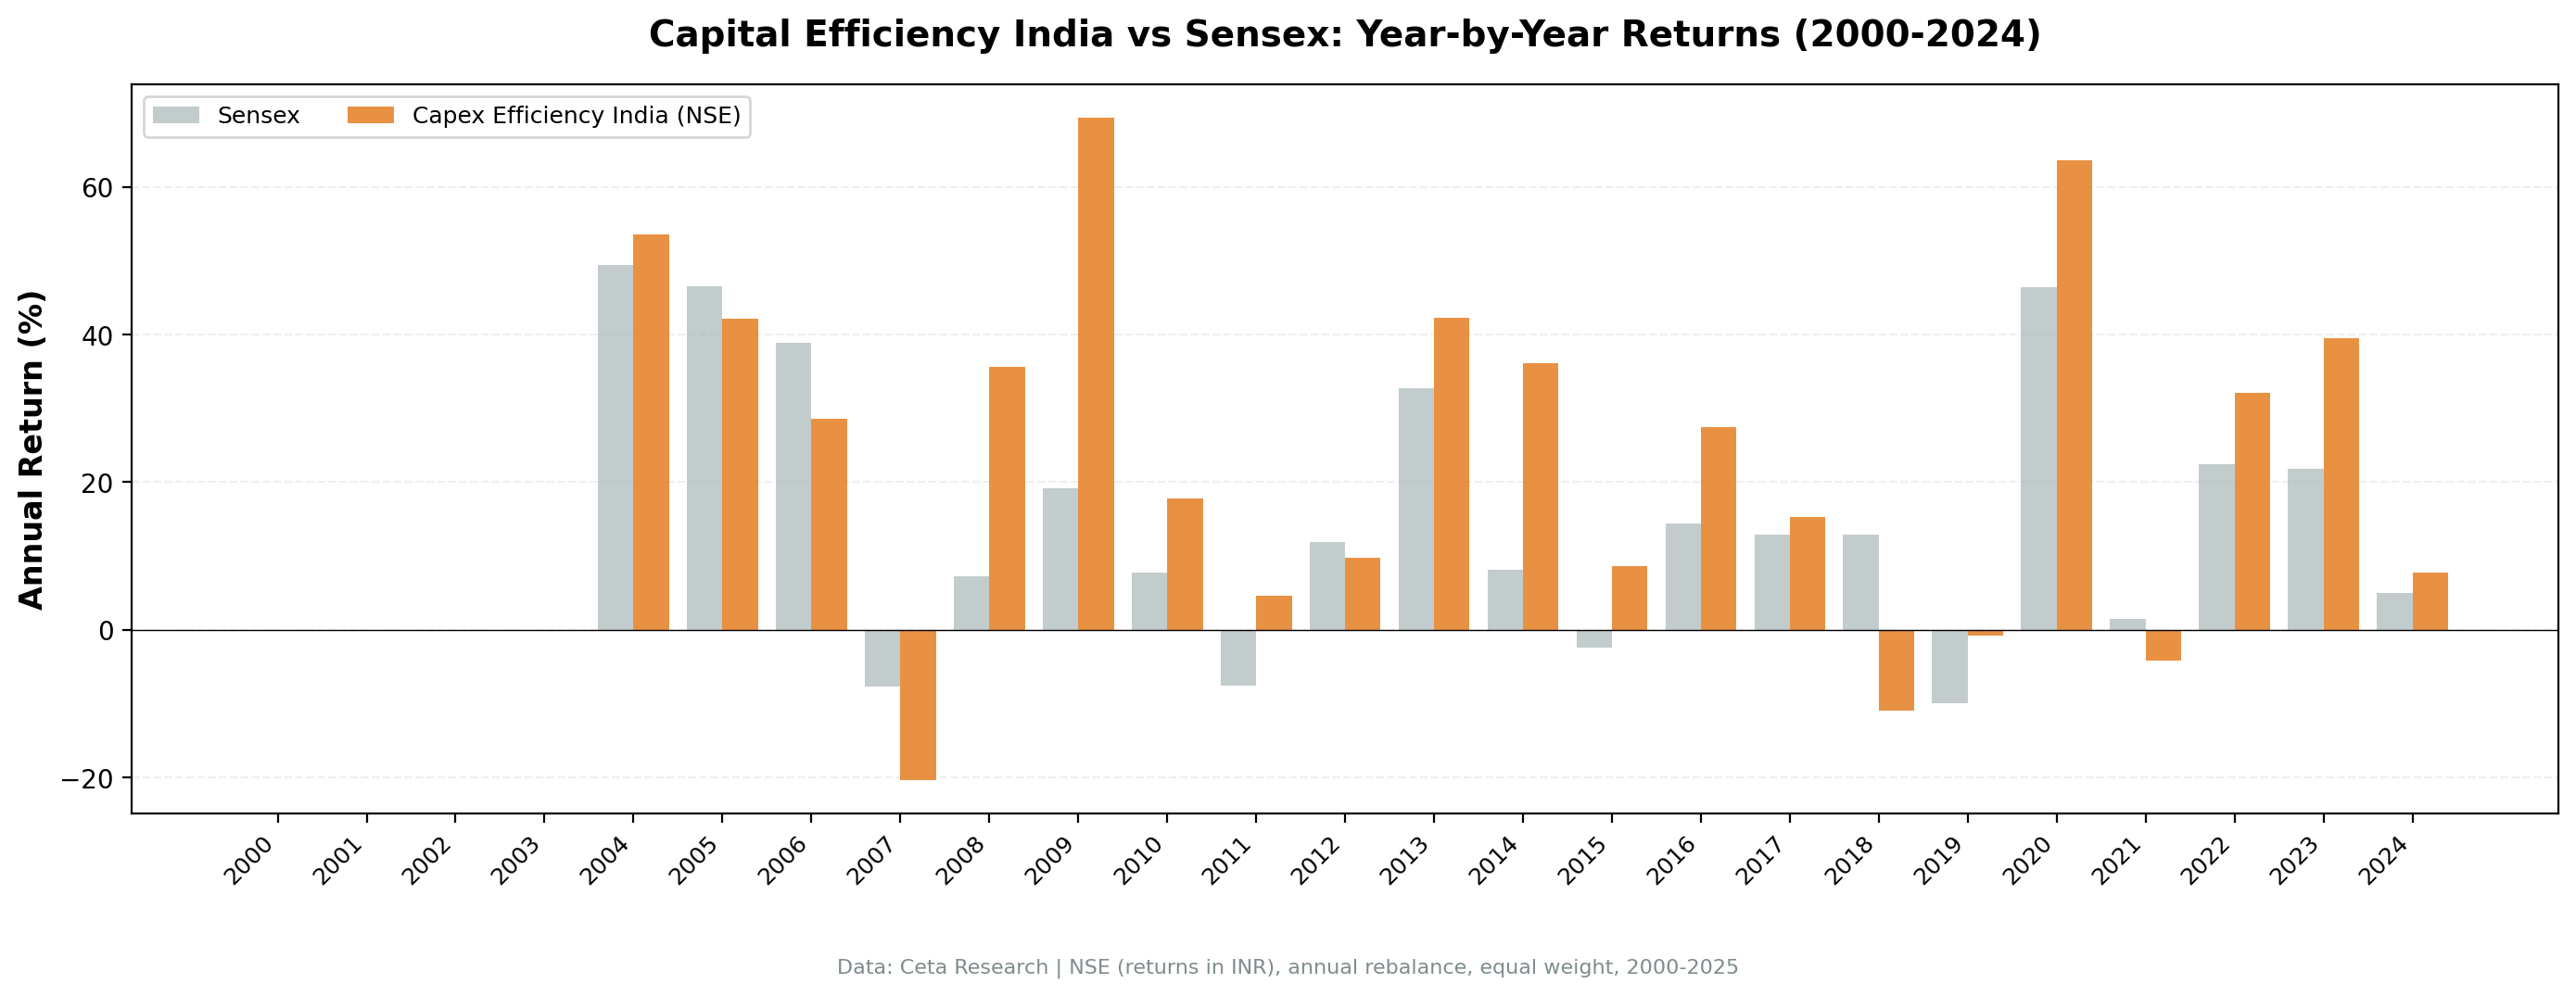
Annual return breakdown (selected years):
| Year | Strategy | Sensex | Excess |
|---|---|---|---|
| 2004 | +53.6% | +49.4% | +4.2% |
| 2009 | +69.4% | +19.1% | +50.3% |
| 2014 | +36.1% | +8.1% | +28.0% |
| 2016 | +27.5% | +14.5% | +13.0% |
| 2018 | -11.0% | +12.9% | -23.9% |
| 2020 | +63.6% | +46.4% | +17.2% |
| 2023 | +39.5% | +21.8% | +17.7% |
When It Works Best
Rising middle class + services economy. India's consumption-driven growth favors companies that scale without heavy capex. IT services, pharma, financials, consumer brands all fit this profile. As the economy shifts from manufacturing to services, capital-light businesses capture disproportionate value.
Credit tightening cycles. When interest rates rise or credit contracts (2013 taper tantrum, 2018 NBFC crisis), companies with low debt and strong cash generation outperform. The capex efficiency screen naturally selects firms that don't rely on constant external funding.
Market rotation to quality. After speculative run-ups (2007 pre-crisis, 2017 mid-cap bubble), the market reprices toward profitability and cash flow. Capital-efficient companies trade at premium multiples because their earnings are real, not accounting fictions.
When It Struggles
Early-cycle capex booms. When the government announces infrastructure stimulus or the RBI cuts rates aggressively, capital-intensive cyclicals (steel, cement, construction) snap back hard. The capex efficiency screen misses these rebounds entirely. That's by design, but it creates periods of underperformance (2002-2003, 2009-2010).
Commodity super-cycles. Energy and mining companies can generate eye-watering cash flows during commodity booms despite massive capex. The screen excludes them systematically. During extended commodity run-ups (rare in India but possible), the strategy lags.
IPO waves in asset-heavy sectors. When exchanges flood with new listings in capital-intensive industries (real estate in 2006-2007, infrastructure in 2010-2011), the market rotates toward story stocks. Capital efficiency gets temporarily ignored.
Run It Yourself
Current qualifying stocks (using TTM data):
SELECT
  p.symbol,
  p.companyName,
  p.exchange,
  ROUND(k.capexToRevenueTTM * 100, 1) AS capex_to_rev_pct,
  ROUND(k.capexToOperatingCashFlowTTM * 100, 1) AS capex_to_ocf_pct,
  ROUND(k.returnOnInvestedCapitalTTM * 100, 1) AS roic_pct,
  ROUND(r.operatingProfitMarginTTM * 100, 1) AS op_margin_pct,
  ROUND(k.marketCap / 1e9, 2) AS mktcap_bn_inr
FROM key_metrics_ttm k
JOIN financial_ratios_ttm r ON k.symbol = r.symbol
JOIN profile p ON k.symbol = p.symbol
WHERE k.capexToRevenueTTM > 0
  AND k.capexToRevenueTTM < 0.08
  AND k.capexToOperatingCashFlowTTM > 0
  AND k.capexToOperatingCashFlowTTM < 0.40
  AND k.returnOnInvestedCapitalTTM > 0.15
  AND r.operatingProfitMarginTTM > 0.15
  AND k.marketCap > 20000000000
  AND p.exchange = 'NSE'
ORDER BY k.returnOnInvestedCapitalTTM DESC
LIMIT 30
Run this query live: Data Explorer - India Capital Efficiency Screen
Backtest code (Python):
git clone https://github.com/ceta-research/backtests.git
cd backtests
python3 capex-efficiency/backtest.py --preset india
Limitations
Sector bias is the signal. This strategy systematically overweights IT, pharma, financials, consumer services. It underweights industrials, energy, utilities, telecom. That's not a bug. The screen is deliberately selecting capital-light business models. If you want sector neutrality, this isn't it.
Under-investment risk. Low capex can signal milking existing assets rather than efficiency. Check capex-to-depreciation over multiple years. If it's well below 1.0 for 3+ years, the company may be under-investing. That works until it doesn't (aging equipment, loss of competitiveness).
ROIC calculation differences. Multiple ROIC definitions exist (NOPAT / invested capital, EBIT / invested capital, etc.). FMP's TTM ROIC may differ from manual calculations. The ranking relative to peers matters more than absolute values.
Survivorship bias. FMP data generally includes delisted stocks, but coverage isn't perfect. Some bankrupt companies may be missing from historical data. This likely overstates absolute returns by a few percentage points.
Currency returns. Results are in INR, compared against the Sensex (also INR). This eliminates currency distortion from the benchmark comparison. USD-based investors face rupee depreciation (~60% over 25 years), but the excess return over Sensex is currency-neutral.
Related Content
This is part of a multi-market capital efficiency series:
- Capital Efficiency US: How Asset-Light Businesses Beat the S&P 500 - Flagship study
- Capital Efficiency Switzerland: 10.20% CAGR, +7.13% vs SMI - 82.6% win rate
- Capital Efficiency UK: 9.34% CAGR, +8.12% vs FTSE 100
- Capital Efficiency Germany: 8.56% CAGR, +3.52% vs DAX
- Capital Efficiency Across Markets: Six-Market Comparison - Six-market study
Data: Ceta Research (FMP financial data warehouse), 2000-2025. Backtest code: github.com/ceta-research/backtests. Full methodology: METHODOLOGY.md.
Past performance does not guarantee future results. This is educational content, not investment advice.


