
Low Debt Quality on US: Downside Protection Tested Over 25 Years

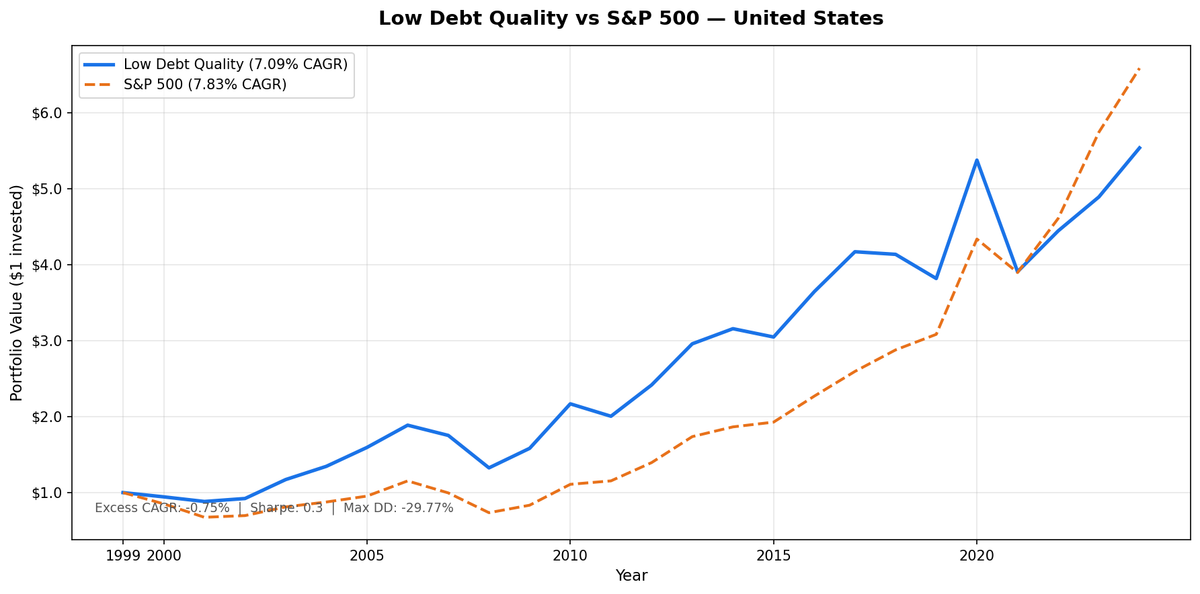
We screened all US stocks (NYSE, NASDAQ, AMEX) for low leverage and high financial quality using D/E < 0.5 and a Piotroski F-Score of 7 or higher, then held the portfolio annually for 25 years. The result: 7.09% CAGR vs 7.83% for SPY. The strategy trailed SPY by 0.75% per year. That's the honest headline. What it doesn't capture is the other side of the ledger: max drawdown of -29.77% vs SPY's -36.27%, and a down capture of 82.83%. For every dollar SPY loses in a down market, this portfolio loses about 83 cents. Over 25 years, that gap matters.
Contents
- Method
- The Signal
- The Screen (SQL)
- What We Found
- 25 years. Slightly behind SPY on total return. Meaningfully ahead on drawdown.
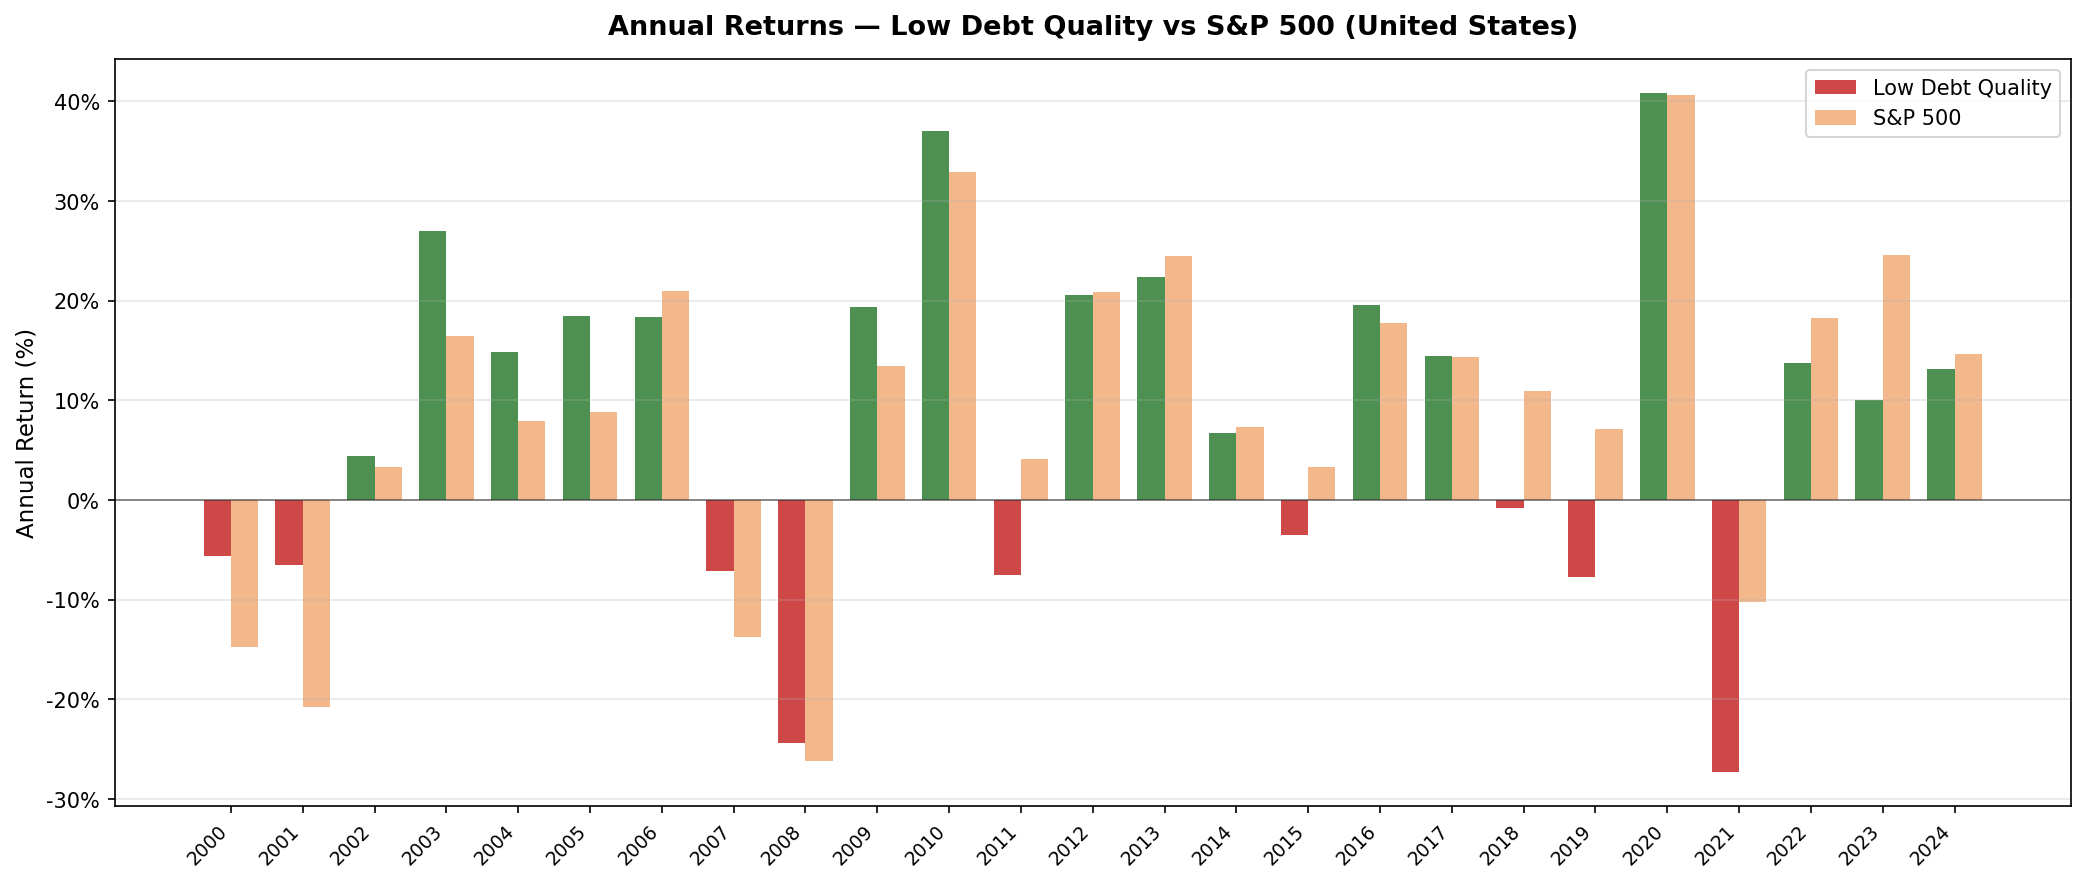
- Annual returns (July-to-July)
- 2000-2005: The strategy's best stretch
- 2007-2009: The financial crisis
- 2021: The rate hike cycle hit hardest here
- 2018-2024: Growth stocks dominated
- Backtest Methodology
- Limitations
- Takeaway
- Part of a Series
- Run This Screen Yourself
Method
- Data source: Ceta Research (FMP financial data warehouse)
- Universe: NYSE, NASDAQ, AMEX, market cap > $1B USD
- Period: 2000-2025 (25 years, 25 annual periods)
- Rebalancing: Annual (July), equal weight all qualifying
- Benchmark: S&P 500 Total Return (SPY)
- Cash rule: Hold cash if fewer than 10 stocks qualify
- Data lag: 45-day point-in-time lag on financial statements (prevents look-ahead bias)
Annual returns are measured July-to-July, since the portfolio rebalances each July. The year label marks the start of each 12-month holding period.
The Signal
Two filters. Both must pass.
Filter 1: Low Leverage
D/E < 0.5, measured from annual financial statements (FY data). This is a hard cutoff. Companies with debt-to-equity at or above 0.5 are excluded entirely, regardless of how good their other numbers look.
Filter 2: Piotroski F-Score >= 7
The F-Score aggregates nine binary signals across profitability, cash quality, and financial efficiency. Each signal scores 1 or 0. Stocks must score 7 or higher to qualify.
| # | Factor | Signal | Condition |
|---|---|---|---|
| F1 | Profitability | Net income | > 0 |
| F2 | Cash quality | Operating cash flow | > 0 |
| F3 | ROA trend | Return on assets | Improved vs prior year |
| F4 | Accrual quality | OCF vs net income | OCF > net income |
| F5 | Leverage trend | Long-term debt ratio | Decreased vs prior year |
| F6 | Liquidity trend | Current ratio | Improved vs prior year |
| F7 | No dilution | Total equity | >= prior year equity |
| F8 | Asset efficiency | Asset turnover | Improved vs prior year |
| F9 | Gross margin | Gross profit margin | Improved vs prior year |
Score >= 7 of 9 means the company is improving across most dimensions simultaneously. Companies in financial distress or deteriorating fundamentals rarely score this high.
The combination of D/E < 0.5 and F-Score >= 7 selects companies that are both conservatively financed and operationally improving. That's a narrow filter on a large universe. The result is 198 stocks on average at each annual rebalance.
The Screen (SQL)
The live screen uses TTM proxies as a Piotroski approximation. Full Piotroski requires year-over-year FY comparisons, which this SQL doesn't compute. The TTM screen substitutes ROE, operating margin, and interest coverage as quality proxies. Use this to find candidates, not to replicate the exact backtest signal.
SELECT
 p.exchange,
 r.symbol,
 p.companyName,
 p.sector,
 ROUND(r.debtToEquityRatioTTM, 3) AS de_ratio,
 ROUND(k.returnOnEquityTTM * 100, 1) AS roe_pct,
 ROUND(r.operatingProfitMarginTTM * 100, 1) AS opm_pct,
 ROUND(r.interestCoverageRatioTTM, 1) AS interest_coverage,
 ROUND(k.freeCashFlowYieldTTM * 100, 2) AS fcf_yield_pct,
 ROUND(k.marketCap / 1e9, 2) AS mktcap_b
FROM financial_ratios_ttm r
JOIN key_metrics_ttm k ON r.symbol = k.symbol
JOIN profile p ON r.symbol = p.symbol
WHERE r.debtToEquityRatioTTM >= 0
 AND r.debtToEquityRatioTTM < 0.50
 AND k.returnOnEquityTTM > 0.08
 AND r.operatingProfitMarginTTM > 0.08
 AND r.interestCoverageRatioTTM > 5.0
 AND p.isActivelyTrading = true
 AND k.marketCap > 1000000000
 AND p.exchange IN ('NYSE', 'NASDAQ', 'AMEX')
ORDER BY de_ratio ASC
LIMIT 30
Run this query on Ceta Research
What We Found

25 years. Slightly behind SPY on total return. Meaningfully ahead on drawdown.
| Metric | Low Debt Quality | S&P 500 (SPY) |
|---|---|---|
| CAGR | 7.09% | 7.83% |
| Total Return | 453.78% | 558.69% |
| Volatility | 16.96% | 15.00% |
| Max Drawdown | -29.77% | -36.27% |
| Sharpe Ratio | 0.30 | 0.38 |
| Down Capture | 82.83% | 100% |
| Up Capture | 90.14% | 100% |
| Win Rate (annual vs SPY) | 52% | - |
| Avg Stocks per Period | 198 | - |
| Cash Periods | 0 of 25 | - |
The strategy was fully invested every single year. 198 stocks on average at each rebalance. The win rate of 52% means it beat SPY in just over half of all annual periods, not enough to overcome the deficit in the other half, particularly when those losses were concentrated in high-return years for growth stocks.
Annual returns (July-to-July)
| Year | Portfolio | SPY | Excess |
|---|---|---|---|
| 2000 | -5.6% | -14.8% | +9.2% |
| 2001 | -6.5% | -20.8% | +14.3% |
| 2002 | +4.5% | +3.3% | +1.2% |
| 2003 | +27.0% | +16.4% | +10.6% |
| 2004 | +14.9% | +7.9% | +6.9% |
| 2005 | +18.5% | +8.9% | +9.6% |
| 2006 | +18.4% | +20.9% | -2.6% |
| 2007 | -7.1% | -13.7% | +6.6% |
| 2008 | -24.4% | -26.1% | +1.8% |
| 2009 | +19.4% | +13.4% | +6.0% |
| 2010 | +37.0% | +32.9% | +4.1% |
| 2011 | -7.5% | +4.1% | -11.6% |
| 2012 | +20.6% | +20.9% | -0.3% |
| 2013 | +22.4% | +24.5% | -2.1% |
| 2014 | +6.7% | +7.4% | -0.7% |
| 2015 | -3.5% | +3.4% | -6.8% |
| 2016 | +19.6% | +17.7% | +1.8% |
| 2017 | +14.4% | +14.3% | +0.1% |
| 2018 | -0.8% | +10.9% | -11.7% |
| 2019 | -7.7% | +7.1% | -14.8% |
| 2020 | +40.8% | +40.7% | +0.1% |
| 2021 | -27.3% | -10.2% | -17.1% |
| 2022 | +13.8% | +18.3% | -4.5% |
| 2023 | +10.0% | +24.6% | -14.6% |
| 2024 | +13.2% | +14.7% | -1.5% |
2000-2005: The strategy's best stretch
The first six years define the strategy's character. The S&P 500 went through the dot-com bust and took years to recover. This portfolio, anchored in low-debt quality companies, held up.
| Period | Portfolio | SPY | Excess |
|---|---|---|---|
| 2000-2005 cumulative | +37.2% | -7.3% | +44.5% |
The D/E filter kept the portfolio away from telecom and dot-com companies that had levered up to fund growth. The Piotroski filter required actual operational improvement, not just revenue projections. Companies that couldn't show real cash flows and balance sheet health didn't make it in.
2001 was the sharpest illustration: SPY down -20.8%, this portfolio down just -6.5%. The 14-point gap came from avoiding the worst-performing sectors entirely.
2007-2009: The financial crisis
The portfolio lost -24.4% vs SPY's -26.1% in 2008. A modest gap, not a dramatic hedge. That's expected. The financial crisis was a credit event, and low-debt companies were still hit hard by the broader economic contraction, just not as hard as leveraged firms. The D/E filter excluded most banks and financials entirely, which helped.
The recovery in 2009-2010 was strong: +19.4% and +37.0% respectively. Both beat SPY. Companies with clean balance sheets could act when markets were disrupted. They didn't need to raise capital or sell assets to survive.
2021: The rate hike cycle hit hardest here
The worst annual result was 2021 (July 2021 to July 2022): portfolio -27.3% vs SPY -10.2%. A 17-point gap going the wrong way.
The rate hike cycle that began in 2022 hit quality small and mid-cap stocks especially hard. The S&P 500 in that period was heavily propped up by mega-cap companies with genuine pricing power: Apple, Microsoft, Google. These companies have strong balance sheets but don't pass D/E < 0.5 in many periods, or when they do, they're large enough that equal weighting dilutes their contribution.
Equal weighting amplifies exposure to the small and mid-cap portion of the quality universe. That's where the rate pain concentrated. This is a known structural risk of equal-weight quality screens in a rising rate environment.
2018-2024: Growth stocks dominated
2018-2024 produced the most persistent stretch of underperformance. The portfolio trailed SPY in 6 of 7 years. The culprit is consistent across the period: the market's best performers were growth-oriented technology companies that don't pass D/E < 0.5, don't show the Piotroski signals of a maturing, efficient business, or both.
NVIDIA, Amazon, and similar companies weren't in this portfolio during their best years. That's not a data problem. It's a design choice. Low-debt quality screens are built for capital preservation and moderate growth, not for capturing hypergrowth names.
Backtest Methodology
| Parameter | Choice |
|---|---|
| Universe | NYSE + NASDAQ + AMEX, Market Cap > $1B USD |
| Signal | D/E < 0.5, Piotroski F-Score >= 7 (computed from FY statements) |
| Portfolio | All qualifying, equal weight |
| Rebalancing | Annual (July) |
| Cash rule | Hold cash if < 10 qualify |
| Benchmark | S&P 500 Total Return (SPY) |
| Period | 2000-2025 (25 years, 25 annual periods) |
| Data lag | Point-in-time, 45-day lag for financial statements |
Limitations
Not an alpha strategy. The portfolio trailed SPY by 0.75% annually over 25 years. The case for this strategy is risk reduction, not return generation. Investors seeking to beat the index need a different tool.
Equal weighting and mega-caps. Equal weighting gives every stock the same allocation regardless of size. This systematically underweights the mega-cap growth names that dominated S&P 500 returns in 2018-2024. An investor holding SPY over the same period captured Apple, Microsoft, and NVIDIA's gains in proportion to their index weight. This strategy didn't.
Sector concentration. The D/E < 0.5 filter excludes most financials, utilities, and REITs, which rely on leverage as a business model. The portfolio skews toward technology (asset-light), healthcare, and consumer staples. Sector exposure can cluster in ways the backtest doesn't fully reveal.
Survivorship bias. Exchange membership uses current company profiles, not historical. Companies that were delisted during the backtest period may not be captured. This likely causes some upward bias in reported returns.
TTM screen vs backtest signal. The live SQL screen uses TTM financial ratios as a Piotroski proxy. The actual backtest computed Piotroski from FY year-over-year changes. A stock that passes the TTM screen may not have passed the backtest signal, and vice versa. Use the screen for candidate identification, not exact replication.
Takeaway
This strategy does what it says: it selects financially sound, low-leverage companies and holds them with equal weighting. The 25-year track record shows -29.77% max drawdown vs -36.27% for SPY, and an 82.83% down capture. The total return is lower than SPY. That's the honest tradeoff.
The clearest use case is an investor who wants broad US equity exposure but is genuinely loss-averse. The portfolio doesn't try to beat the market through cleverness. It tries to reduce peak-to-trough losses by avoiding the most over-leveraged, operationally deteriorating companies. In the 2000-2005 bear market period, that saved 44 percentage points of cumulative return relative to SPY.
The 2018-2024 growth cycle was the cost. Equal-weight quality underperformed badly during the mega-cap technology run, and the rate hike cycle of 2021-2022 hit quality small/mid-caps harder than the index. An investor who held through that stretch collected the bear market protection from the prior decade. Whether that tradeoff is acceptable depends on how you weight drawdown protection against expected return.
Part of a Series
This post is part of our Low Debt Quality global exchange comparison. We ran the same strategy across 15 exchanges worldwide: - Low Debt Quality on Indian Stocks (BSE + NSE) - 14.05% CAGR, +6.22% excess, -2.02% down capture - Low Debt Quality on Canadian Stocks (TSX) - +1.33% excess - Low Debt Quality on Swedish Stocks - +1.14% excess - Low Debt Quality on Swiss Stocks - best Sharpe in the study (0.429) - Low Debt Quality on German Stocks (XETRA) - European result - Low Debt Quality on UK Stocks (LSE) - LSE results - Low Debt Quality: Global Exchange Comparison - all 15 exchanges
Run This Screen Yourself
The TTM screen SQL above is runnable directly on Ceta Research. Query the FMP financial data warehouse and filter by your own criteria. No setup required.
The full backtest code (Python + DuckDB) is on GitHub.
Run It Yourself
Explore the data behind this analysis on Ceta Research. Query our financial data warehouse with SQL, build custom screens, and run your own backtests across 70,000+ stocks on 20 exchanges.
Data: Ceta Research, FMP financial data warehouse. Universe: NYSE + NASDAQ + AMEX. Annual rebalance (July), equal weight, 2000-2025.


