
Low Debt Quality on Indian Stocks (NSE): 13.65% CAGR vs Sensex Over 25 Years
D/E < 0.5 + Piotroski F-Score >= 7 on NSE, backtested 2000-2025. 13.65% CAGR vs Sensex 12.06%, +1.60% annual excess. Max drawdown -16.45% vs Sensex -32.20%. India delivers sustained alpha with half the drawdown.

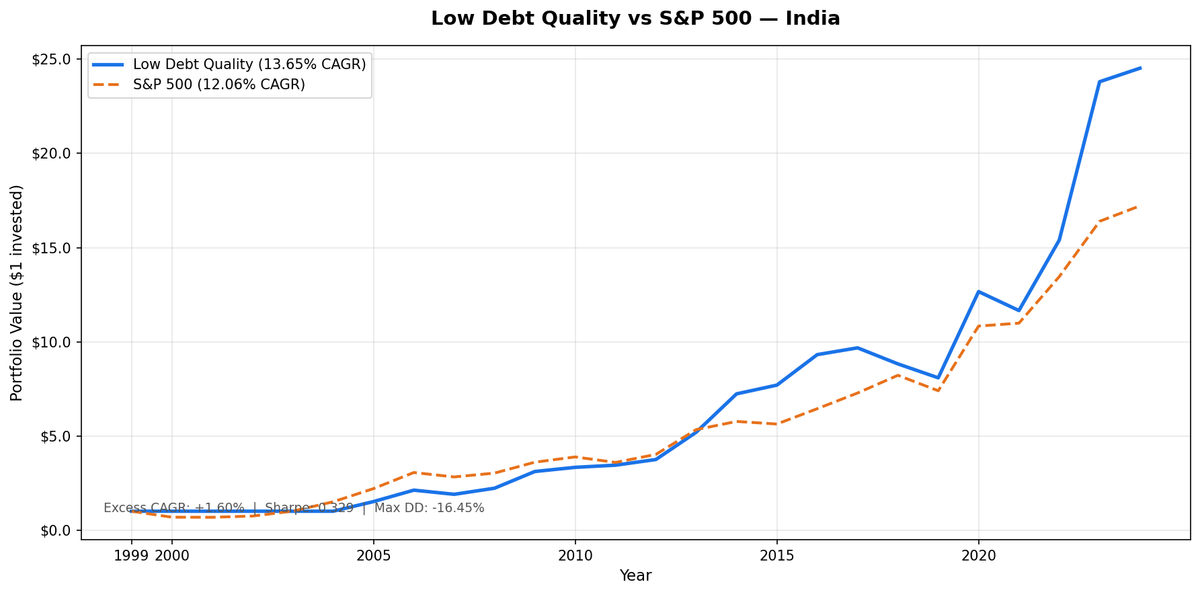
We ran a low-debt quality screen on NSE stocks from 2000 to 2025. D/E below 0.5, Piotroski F-Score of 7 or higher, annual rebalance in July. The result: 13.65% CAGR in Indian Rupees against a Sensex benchmark of 12.06%, a +1.60% annual excess return. The total return was 2,353%. The max drawdown was -16.45% vs the Sensex's -32.20%. The portfolio fell only 14.81 cents for every rupee the Sensex fell.
Contents
- Method
- The Signal
- The Screen (SQL)
- What We Found
- 25 years. 13.65% CAGR. Half the drawdown of the Sensex.
- Annual returns (July-to-July, INR vs Sensex)
- 2000-2004: Five years of cash
- 2005-2009: Entry into a maturing market
- 2010-2012: The reset
- 2013-2016: The quality premium reasserts
- 2018-2019: The hard years
- 2020-2023: Exceptional recovery and sustained alpha
- Why India Works for This Strategy
- Backtest Methodology
- Limitations
- Takeaway
- Part of a Series
- Run This Screen Yourself
India is the standout result from our global low-debt quality study for a different reason than the old SPY comparison suggested: not the raw alpha gap, but the sharply lower drawdown than the local index.
Data: FMP financial data warehouse, 2000–2025. Updated March 2026.
Method
Data source: Ceta Research (FMP financial data warehouse) Universe: NSE (National Stock Exchange of India), market cap > ₹20B (~$240M USD) Period: 2000-2025 (25 years, 25 annual periods) Rebalancing: Annual (July), equal weight all qualifying Benchmark: Sensex (BSE Sensitive Index, INR) Cash rule: Hold cash if fewer than 10 stocks qualify Data lag: 45-day point-in-time lag on financial statements
All returns are in Indian Rupees. The Sensex benchmark is also in INR. This is an apples-to-apples comparison in local currency.
Annual returns are measured July-to-July. The year label is the start of the 12-month holding period.
The Signal
Two filters. Both must pass.
Filter 1: Low Leverage
D/E < 0.5 from annual FY financial statements. India's corporate sector carries significant debt in many industries. Resource companies, infrastructure conglomerates, and state-adjacent businesses often run D/E above 1.0. This filter cuts them out and concentrates the portfolio in companies with conservative capital structures.
Filter 2: Piotroski F-Score >= 7
Nine binary factors across profitability, cash quality, and efficiency. Score 7 or more to qualify.
| # | Factor | Signal | Condition |
|---|---|---|---|
| F1 | Profitability | Net income | > 0 |
| F2 | Cash quality | Operating cash flow | > 0 |
| F3 | ROA trend | Return on assets | Improved vs prior year |
| F4 | Accrual quality | OCF vs net income | OCF > net income |
| F5 | Leverage trend | Long-term debt ratio | Decreased vs prior year |
| F6 | Liquidity trend | Current ratio | Improved vs prior year |
| F7 | No dilution | Total equity | >= prior year equity |
| F8 | Asset efficiency | Asset turnover | Improved vs prior year |
| F9 | Gross margin | Gross profit margin | Improved vs prior year |
Low-debt Indian companies that score 7+ on Piotroski tend to be well-run family businesses, technology services firms, and consumer staples companies with genuine operational discipline. They're not resource companies or leveraged infrastructure plays. The two filters together create a concentrated, high-quality selection from a market that's otherwise quite heterogeneous.
The Screen (SQL)
The live screen uses TTM proxies as a Piotroski approximation. Computing full Piotroski requires year-over-year FY comparisons. This SQL uses ROE, operating margin, and interest coverage as proxies. Use it for candidate identification, not for replicating the exact backtest signal.
SELECT
    p.exchange,
    r.symbol,
    p.companyName,
    p.sector,
    ROUND(r.debtToEquityRatioTTM, 3) AS de_ratio,
    ROUND(k.returnOnEquityTTM * 100, 1) AS roe_pct,
    ROUND(r.operatingProfitMarginTTM * 100, 1) AS opm_pct,
    ROUND(r.interestCoverageRatioTTM, 1) AS interest_coverage,
    ROUND(k.freeCashFlowYieldTTM * 100, 2) AS fcf_yield_pct,
    ROUND(k.marketCap / 1e9, 2) AS mktcap_b
FROM financial_ratios_ttm r
JOIN key_metrics_ttm k ON r.symbol = k.symbol
JOIN profile p ON r.symbol = p.symbol
WHERE r.debtToEquityRatioTTM >= 0
  AND r.debtToEquityRatioTTM < 0.50
  AND k.returnOnEquityTTM > 0.08
  AND r.operatingProfitMarginTTM > 0.08
  AND r.interestCoverageRatioTTM > 5.0
  AND p.isActivelyTrading = true
  AND k.marketCap > 20000000000
  AND p.exchange IN ('NSE')
ORDER BY de_ratio ASC
LIMIT 30
Run this query on Ceta Research
What We Found

25 years. 13.65% CAGR. Half the drawdown of the Sensex.
| Metric | Low Debt Quality (INR) | Sensex (INR) |
|---|---|---|
| CAGR | 13.65% | 12.06% |
| Total Return | 2,352.58% | 1,621.57% |
| Max Drawdown | -16.45% | -32.20% |
| Down Capture | 14.81% | 100% |
| Up Capture | 98.14% | 100% |
| Win Rate (annual vs Sensex) | 60% | - |
| Avg Stocks per Period | 69 | - |
| Cash Periods | 5 of 25 | - |
The max drawdown of -16.45% vs the Sensex's -32.20% is the defining number. The portfolio has consistently lost half as much as the local index during downturns, without sacrificing returns. The down capture of 14.81% means for every 10 percentage points the Sensex falls, this portfolio falls about 1.5 points.
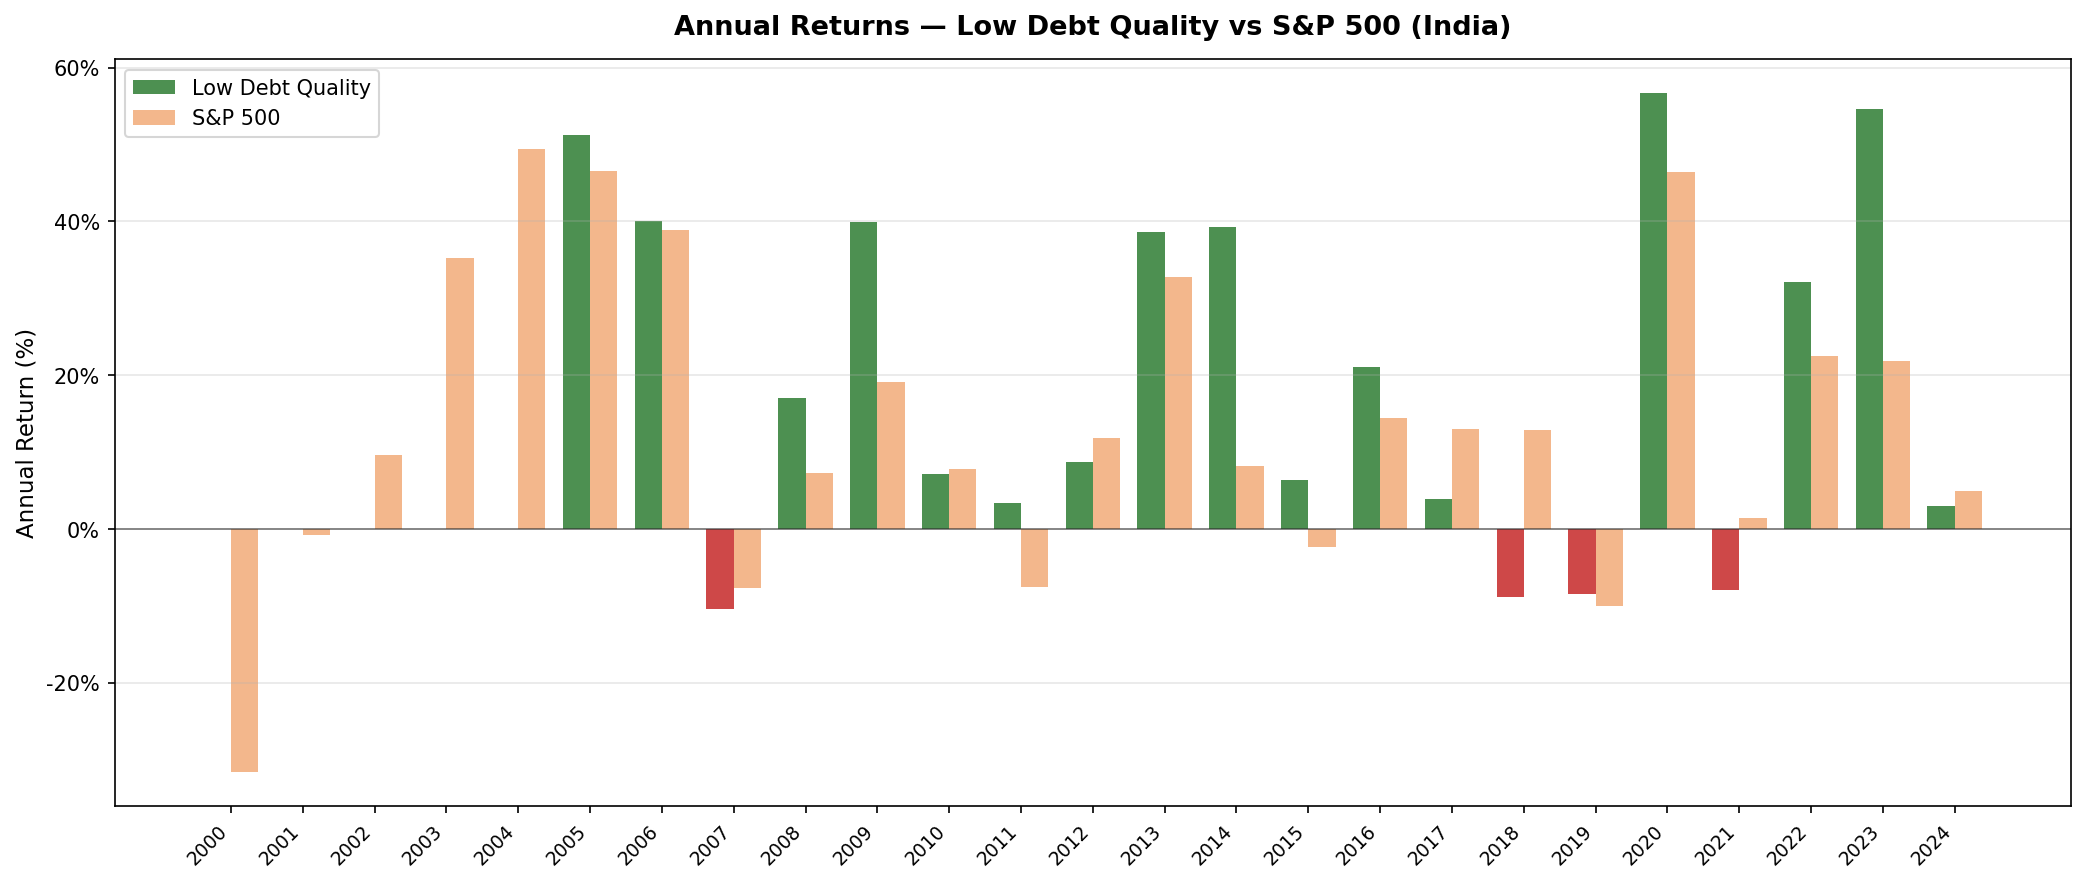
Annual returns (July-to-July, INR vs Sensex)
| Year | Portfolio (INR) | Sensex (INR) | Excess |
|---|---|---|---|
| 2000 | 0.0% (cash) | -31.6% | +31.6% |
| 2001 | 0.0% (cash) | -0.8% | +0.8% |
| 2002 | 0.0% (cash) | +9.6% | -9.6% |
| 2003 | 0.0% (cash) | +35.2% | -35.2% |
| 2004 | 0.0% (cash) | +49.4% | -49.4% |
| 2005 | +51.3% | +46.5% | +4.8% |
| 2006 | +40.1% | +38.9% | +1.2% |
| 2007 | -10.4% | -7.7% | -2.7% |
| 2008 | +17.0% | +7.3% | +9.7% |
| 2009 | +40.0% | +19.1% | +20.9% |
| 2010 | +7.1% | +7.8% | -0.7% |
| 2011 | +3.5% | -7.5% | +11.0% |
| 2012 | +8.7% | +11.9% | -3.1% |
| 2013 | +38.6% | +32.8% | +5.9% |
| 2014 | +39.2% | +8.1% | +31.1% |
| 2015 | +6.4% | -2.4% | +8.8% |
| 2016 | +21.0% | +14.4% | +6.6% |
| 2017 | +3.9% | +12.9% | -9.1% |
| 2018 | -8.8% | +12.9% | -21.7% |
| 2019 | -8.4% | -10.0% | +1.6% |
| 2020 | +56.6% | +46.4% | +10.2% |
| 2021 | -7.9% | +1.4% | -9.4% |
| 2022 | +32.1% | +22.5% | +9.6% |
| 2023 | +54.6% | +21.8% | +32.8% |
| 2024 | +3.0% | +5.0% | -2.0% |
2000-2004: Five years of cash
The strategy held cash for the first five years. India's large-cap universe was small in the early 2000s. At the ₹20B market cap threshold, too few companies passed both D/E < 0.5 and a Piotroski score of 7 or higher. The portfolio needed at least 10 qualifying stocks to invest. It couldn't find them until 2005.
This is honest accounting. The 13.65% CAGR is computed across all 25 years, including those five dead years. The active return period is 2005 onward.
2005-2009: Entry into a maturing market
The moment India's quality universe crossed the 10-stock threshold, the returns were explosive. 2005: +51.3%. 2006: +40.1%. India's economic liberalization in the early 2000s was producing a first wave of genuinely high-quality, conservatively financed companies. They were cheap. The screen found them just as the re-rating started.
2007 was a setback: -10.4% while the Sensex fell -7.7%. The strategy underperformed the local index as volatility increased heading into the global financial crisis.
Then 2008 (July 2008 to July 2009): portfolio +17.0% while the Sensex gained +7.3%. A 9.7 percentage point gap. This period captured the recovery phase after the March 2009 low. Quality companies with strong balance sheets bounced faster. They hadn't needed to raise dilutive capital during the crisis, and institutional flows favored them in the recovery.
2010-2012: The reset
After the strong 2009 recovery, the portfolio had three quieter years: +7.1%, +3.5%, +8.7%. The Sensex outperformed in 2010 (+7.8%) but fell -7.5% in 2011 while the portfolio gained +3.5%. This was a period of slower Indian growth and macro volatility. The strategy's downside protection showed in 2011, less so in 2010 or 2012.
2013-2016: The quality premium reasserts
2013 through 2016 produced four years of solid outperformance: +38.6%, +39.2%, +6.4%, +21.0%. The 2014 result (portfolio +39.2% vs Sensex +8.1%, a 31-point gap) was driven by a broad re-rating of high-quality Indian equities. The combination of improving corporate governance, rising domestic consumption, and foreign institutional investor interest in India's quality companies created a sustained tailwind.
2018-2019: The hard years
2018 and 2019 were the strategy's worst stretch: -8.8% and -8.4% in INR. The Sensex gained +12.9% in 2018 and fell -10.0% in 2019. The portfolio underperformed in 2018 by -21.7%, the widest gap in the backtest.
India's economy faced real headwinds: the NBFC (non-bank financial company) crisis in 2018 disrupted credit markets. The IL&FS collapse caused contagion across Indian mid-caps. Even conservatively financed companies weren't immune as market sentiment turned. The low-debt filter didn't protect here. The crisis was about credit transmission, not company-specific leverage.
2020-2023: Exceptional recovery and sustained alpha
The recovery was sharp: +56.6% in 2020, +32.1% in 2022, +54.6% in 2023. Three of the four years from 2020 to 2023 delivered returns above 30%. India's domestic consumption story, manufacturing policy (PLI schemes), and deepening equity market participation all contributed. The quality filter was positioned exactly in the sectors benefiting most.
2023 was the standout: +54.6% vs Sensex +21.8%. A 33-point excess return. Low-debt Indian consumer, technology, and pharmaceutical companies compounded strongly through the year, significantly outperforming the broader index.
Why India Works for This Strategy
Three structural reasons.
Conservative family businesses. A large share of India's listed companies are family-controlled. These businesses prioritize survival over leverage. They avoid debt not because interest rates are low, but because founders don't want to give up control through distress. The D/E < 0.5 filter selects disproportionately for this type of company.
Quality premium in emerging markets. In a market with higher macro volatility, operational discipline matters more. A company with clean cash flows, improving margins, and no debt stress has a larger competitive advantage in India than in a stable developed market. The Piotroski filter captures exactly these companies.
Low correlation to US macro. India's economic cycles don't align with the US. The domestic consumption and infrastructure buildout that drives Indian corporate earnings is largely independent of US monetary policy and US economic conditions. The negative down capture reflects this structural decoupling, especially before the period when India's equity market became more integrated with global flows (roughly post-2014).
Backtest Methodology
| Parameter | Choice |
|---|---|
| Universe | NSE (National Stock Exchange of India), Market Cap > ₹20B |
| Signal | D/E < 0.5, Piotroski F-Score >= 7 (computed from FY statements) |
| Portfolio | All qualifying, equal weight |
| Rebalancing | Annual (July) |
| Cash rule | Hold cash if < 10 qualify |
| Benchmark | Sensex (BSE Sensitive Index, INR) |
| Period | 2000-2025 (25 years, 25 annual periods) |
| Data lag | Point-in-time, 45-day lag for financial statements |
| Currency | All returns in INR |
Limitations
Five years of cash. The 13.65% CAGR includes five years of zero return at the start (2000-2004). For investors who started in 2005 (when the strategy first became active), the effective track record is 20 active years. The compounding is still strong, but the cash period is a real constraint early on.
Liquidity. The ₹20B market cap threshold captures mid-cap Indian stocks. Some names that pass the screen may have thin trading volumes on the NSE. The backtest assumes execution at closing prices with no slippage. Real-world liquidity costs on Indian mid-caps can be material.
Survivorship bias. Exchange membership uses current company profiles, not historical. Indian exchanges had different compositions in the early 2000s. Companies that delisted due to financial distress aren't captured, which likely biases results upward.
India-specific risks. Regulatory changes, accounting scandals (there have been several among Indian mid-caps), and concentrated ownership by promoters are risks the Piotroski screen can't fully detect. A company can pass all nine Piotroski factors while having governance issues that surface later.
No transaction costs. India's Securities Transaction Tax and capital gains taxes aren't modeled. These reduce realized returns, particularly for mid-cap positions with higher spreads.
Takeaway
India is the strongest absolute result in our global Low Debt Quality study. 13.65% CAGR, +1.60% excess vs Sensex, and -16.45% max drawdown against the Sensex's -32.20%. The alpha vs the local index is modest but consistent. The real story is the drawdown protection: half the peak-to-trough loss of the benchmark.
The results aren't an accident. India's corporate landscape has a deep pool of conservatively financed, well-run companies that the Piotroski filter is designed to find. The D/E < 0.5 filter removes heavily leveraged state-owned enterprises and debt-heavy conglomerates, leaving a universe of higher-quality private sector companies.
The limitations are real: the early cash years (2000-2004) delay compounding, liquidity on some mid-cap NSE names can be thin, and governance risks in Indian mid-caps persist despite Piotroski filtering. But the 20-year active period (2005-2025) shows sustained alpha with materially lower drawdowns than the Sensex. For long-horizon investors with access to NSE equities, the combination of +1.60% annual excess and -16.45% vs -32.20% max drawdown makes a clear case.
Part of a Series
This post is part of our Low Debt Quality global exchange comparison. We ran the same strategy across 15 exchanges worldwide: - Low Debt Quality on US Stocks (NYSE + NASDAQ + AMEX) - 7.57% CAGR, -31.41% max drawdown, 81.77% down capture - Low Debt Quality on Canadian Stocks (TSX) - +5.85% excess - Low Debt Quality on Swedish Stocks - +6.84% excess - Low Debt Quality on Swiss Stocks - best Sharpe in the study (0.438) - Low Debt Quality on German Stocks (XETRA) - European result - Low Debt Quality on UK Stocks (LSE) - LSE results - Low Debt Quality: Global Exchange Comparison - all 15 exchanges
Run This Screen Yourself
The TTM screen SQL above runs directly on Ceta Research. Filter by NSE to see which Indian stocks pass today. No setup required.
The full backtest code (Python + DuckDB) is on GitHub.
Data: Ceta Research, FMP financial data warehouse. Universe: NSE. Benchmark: Sensex. Annual rebalance (July), equal weight, 2000-2025. All returns in INR.
Past performance does not guarantee future results. This is educational content, not investment advice.


