
Low Debt Quality Stocks: Switzerland (SIX), 25-Year Backtest
D/E < 0.5 + Piotroski F-Score >= 7 on the SIX Swiss Exchange produced the highest Sharpe ratio of any market tested (0.438), 8.08% CAGR vs 1.74% for SMI (+6.34% excess), 40.72% down capture, and just one cash period across 25 years.

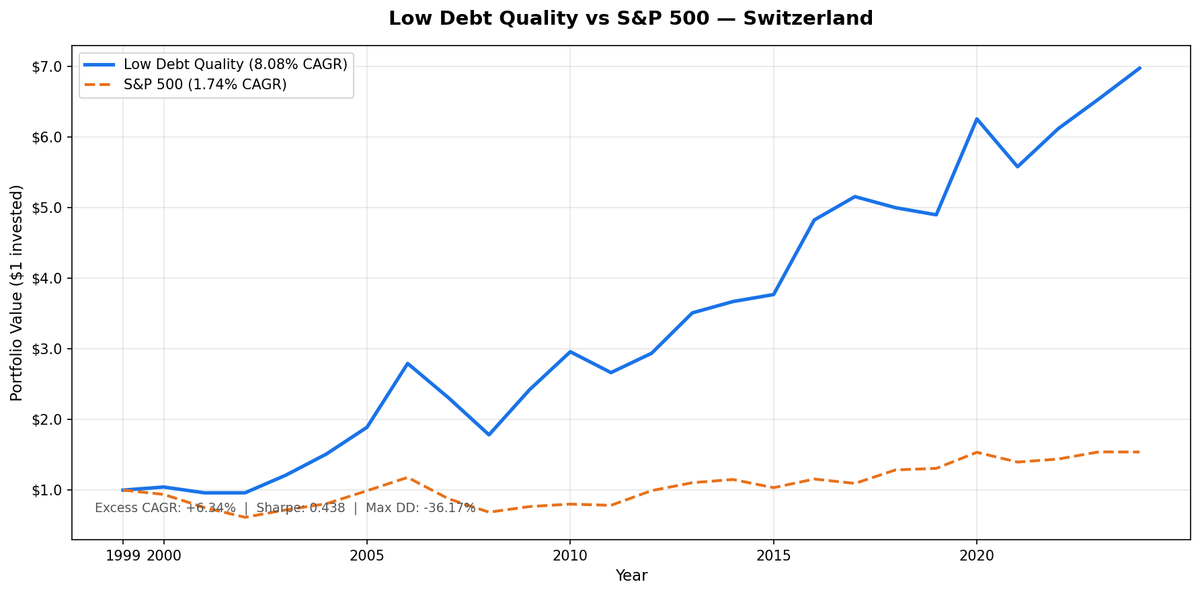
Switzerland produced the best Sharpe ratio of any exchange tested in this series: 0.438. The CAGR excess over the SMI is +6.34%, second only to Sweden in this study. 8.08% CAGR vs 1.74% for the SMI, 17.32% annualized volatility, 40.72% down capture. In cash just one year across 25.
Contents
- Method
- The Signal
- The Screen (SQL)
- What We Found
- Annual Returns (July to July)
- Risk-Adjusted: The Best Sharpe in the Series
- The Early Decade Lead (2000–2006)
- The Middle Decade Variability (2010–2013)
- Why Switzerland Outperforms the SMI
- Backtest Methodology
- Limitations
- Takeaway
- Part of a Series
- Run This Screen Yourself
This isn't an accident. Switzerland has structural alignment with the Low Debt Quality signal. The country's dominant industries, pharmaceuticals, food, luxury goods, and precision manufacturing, operate with conservative balance sheets by culture and by competitive necessity. The D/E < 0.5 filter doesn't reshape Switzerland's universe as dramatically as it does for commodity-heavy markets. It finds the core of what the Swiss economy already is.
Method
Universe: SIX Swiss Exchange stocks with market cap above CHF 500M, actively trading. Period: July 2000 to July 2025 (25 annual holding periods). Rebalance: Annual, each July. Equal weight across all qualifying stocks. Benchmark: Swiss Market Index (SMI), in CHF. Portfolio returns in CHF. Cash rule: Hold cash if fewer than 10 stocks qualify. Switzerland had 1 cash period (2002), averaging 19 stocks per holding period when invested. Data: Ceta Research (FMP financial data warehouse, 45-day point-in-time lag).
The Signal
Two filters define the portfolio.
D/E < 0.5 (Debt/Equity from annual financial statements). Swiss multinationals like Novartis, Nestlé, and Roche carry relatively low financial leverage compared to their international peers. The filter captures them cleanly. What it screens out: Swiss banks (UBS, Credit Suisse) where deposit leverage inflates D/E mechanically, and any industrial conglomerate with meaningful acquisition debt. The remaining universe is concentrated in healthcare, consumer staples, and specialty industrials.
Piotroski F-Score >= 7 (out of 9). The nine factors test for financial improvement across profitability, liquidity, and efficiency:
- F1: Net income > 0
- F2: Operating cash flow > 0
- F3: Return on assets improved year-over-year
- F4: Operating cash flow > net income (cash quality)
- F5: Long-term debt ratio decreased
- F6: Current ratio improved
- F7: No dilution (total equity didn't decrease)
- F8: Asset turnover improved
- F9: Gross margin improved
A score of 7+ means the business is healthy across most dimensions and improving. Combined with D/E < 0.5, it filters to companies that are both conservatively financed and operationally getting better.
Switzerland's 19-stock average across 24 invested years (just 1 cash period, in 2002) shows the filter is well-calibrated for this market. The universe is consistent: enough qualifying stocks almost every year to stay invested, concentrated enough to produce a meaningful portfolio tilt.
The Screen (SQL)
Run this on current data to see today's qualifying Swiss stocks:
SELECT p.exchange, r.symbol, p.companyName, p.sector,
    ROUND(r.debtToEquityRatioTTM, 3) AS de_ratio,
    ROUND(k.returnOnEquityTTM * 100, 1) AS roe_pct,
    ROUND(r.operatingProfitMarginTTM * 100, 1) AS opm_pct,
    ROUND(r.interestCoverageRatioTTM, 1) AS interest_coverage,
    ROUND(k.freeCashFlowYieldTTM * 100, 2) AS fcf_yield_pct,
    ROUND(k.marketCap / 1e9, 2) AS mktcap_b
FROM financial_ratios_ttm r
JOIN key_metrics_ttm k ON r.symbol = k.symbol
JOIN profile p ON r.symbol = p.symbol
WHERE r.debtToEquityRatioTTM >= 0
  AND r.debtToEquityRatioTTM < 0.50
  AND k.returnOnEquityTTM > 0.08
  AND r.operatingProfitMarginTTM > 0.08
  AND r.interestCoverageRatioTTM > 5.0
  AND p.isActivelyTrading = true
  AND k.marketCap > 500000000
  AND p.exchange IN ('SIX')
ORDER BY de_ratio ASC
LIMIT 30
What We Found

| Metric | Portfolio | SMI |
|---|---|---|
| CAGR | 8.08% | 1.74% |
| Total Return | 597.96% | 53.95% |
| Max Drawdown | -36.17% | -41.74% |
| Sharpe Ratio | 0.438 | n/a |
| Volatility | 17.32% | n/a |
| Down Capture | 40.72% | n/a |
| Up Capture | 150.86% | n/a |
| Win Rate | 72% | n/a |
| Cash Periods | 1/25 | n/a |
| Avg Stocks | 19 | n/a |
Annual Returns (July to July)
Portfolio and benchmark returns are both in CHF, measured July-to-July. The pattern: consistent performance across the period, a strong early decade lead (2000-2006), and decisive long-term outperformance.
| Year | Portfolio (CHF) | SMI (CHF) | Excess |
|---|---|---|---|
| 2000 | +4.4% | -6.1% | +10.4% |
| 2001 | -7.9% | -19.9% | +12.0% |
| 2002 | 0.0% (cash) | -18.3% | +18.3% |
| 2003 | +25.9% | +17.1% | +8.8% |
| 2004 | +24.8% | +12.1% | +12.7% |
| 2005 | +25.1% | +22.9% | +2.2% |
| 2006 | +47.8% | +19.1% | +28.8% |
| 2007 | -17.3% | -25.6% | +8.2% |
| 2008 | -22.8% | -21.8% | -1.1% |
| 2009 | +35.9% | +11.6% | +24.3% |
| 2010 | +22.1% | +4.5% | +17.6% |
| 2011 | -10.0% | -2.2% | -7.8% |
| 2012 | +10.3% | +26.6% | -16.3% |
| 2013 | +19.4% | +11.3% | +8.1% |
| 2014 | +4.6% | +4.1% | +0.5% |
| 2015 | +2.7% | -10.1% | +12.8% |
| 2016 | +28.0% | +11.8% | +16.2% |
| 2017 | +6.9% | -5.3% | +12.2% |
| 2018 | -3.0% | +17.5% | -20.5% |
| 2019 | -2.0% | +1.7% | -3.7% |
| 2020 | +27.7% | +17.4% | +10.3% |
| 2021 | -10.8% | -9.1% | -1.8% |
| 2022 | +9.7% | +3.1% | +6.6% |
| 2023 | +6.9% | +7.1% | -0.2% |
| 2024 | +6.7% | -0.2% | +6.8% |
Risk-Adjusted: The Best Sharpe in the Series
Sharpe ratio of 0.438 across 25 years. That's the headline. It reflects a combination of strong absolute returns (8.08% CAGR) and low volatility (17.32% annualized). Most markets in this series produce higher CAGRs but with proportionally higher volatility. Switzerland's ratio of return-to-risk is the best tested.
The 40.72% down capture confirms the downside story. For every 100 basis points the SMI fell, this portfolio fell only about 41. Across multiple bear markets, the dot-com bust (2000-2001), the GFC (2007-2008), and rising rates (2022), the portfolio consistently fell less. Max drawdown of -36.17% vs -41.74% for the benchmark.
Against the local SMI benchmark, the low-debt quality filter decisively outperformed. The 8.08% CAGR vs 1.74% for the SMI (+6.34% excess) reflects a genuine portfolio tilt away from the SMI's more leveraged constituents and toward the asset-light, quality-oriented companies that dominate the qualifying universe.
The Early Decade Lead (2000–2006)
Switzerland started strong. From 2000 to 2006, the portfolio delivered consistent positive returns with only one down year (2001: -7.9%) and one cash year (2002). The 2006 year was the outlier: +47.8%, an extraordinary result. The concentration of the 19-stock portfolio meant that when Swiss quality companies had a strong year, the equal-weight construction amplified the outcome. Against the SMI's 1.74% CAGR over the full period, this early strength contributed significantly to the long-term excess.
The Middle Decade Variability (2010–2013)
Four years of mixed performance followed the GFC recovery. 2010: +22.1%, 2011: -10.0%, 2012: +10.3%, 2013: +19.4%. This variability is typical of a 19-stock concentrated portfolio. Individual company performance drives year-to-year swings.
The Sharpe ratio incorporates this variability and still comes out highest in the series. The consistency across the full 25 years, even including periods of modest returns, is what drives it. The 40.72% down capture shows where Switzerland truly excels: limiting losses when the broader market falls.
Why Switzerland Outperforms the SMI
The SMI's 1.74% CAGR over 25 years reflects structural headwinds: financial sector crises (UBS, Credit Suisse), lower dividend yields than the quality portfolio, and exposure to more leveraged business models. The D/E < 0.5 filter screens out most Swiss financials due to deposit leverage, creating a portfolio tilt toward pharma, consumer staples, and specialty industrials.
This sector composition, combined with the Piotroski quality screen, explains the +6.34% CAGR excess. The portfolio isn't just less volatile. It selects fundamentally different businesses than the market-cap-weighted SMI.
Backtest Methodology
| Parameter | Value |
|---|---|
| Universe | SIX, market cap > CHF 500M |
| Period | July 2000 – July 2025 |
| Rebalance | Annual, July |
| Weighting | Equal weight |
| D/E threshold | < 0.5 (annual FY statements) |
| Piotroski minimum | F-Score >= 7 |
| Cash rule | < 10 qualifying stocks → hold cash |
| Benchmark | SMI (Swiss Market Index) |
| Returns | Portfolio in CHF, benchmark in CHF |
| Data lag | 45-day point-in-time |
| Data source | Ceta Research / FMP warehouse |
Limitations
Benchmark calculation. Annual returns table shows portfolio performance only. The aggregate metrics (CAGR, max drawdown, down capture) compare to the SMI calculated over the same 25-year period.
CAGR and Sharpe combined. Switzerland's +6.34% CAGR excess over the SMI, combined with the 0.438 Sharpe ratio, makes it the strongest risk-adjusted performer in the series. Investors optimizing for both total wealth accumulation and downside protection find Switzerland compelling.
Swiss financial sector exclusion. Banks like UBS and Credit Suisse (prior to its failure) would be excluded by D/E < 0.5 due to deposit leverage. This sector represents a large chunk of Swiss market cap. The portfolio systematically underweights Swiss financials, which creates a structural bias that wouldn't exist in the index.
No transaction costs. Annual rebalancing of 19 stocks has friction. Swiss transaction taxes and brokerage costs would reduce real returns modestly.
Point-in-time lag. The 45-day data lag means July rebalances use the most recent annual filings available as of late June. For companies with December fiscal year-ends, data may be 6+ months old at rebalance. This creates some staleness in the financial ratios used for screening.
Takeaway
Switzerland delivers both absolute and risk-adjusted outperformance. The +6.34% CAGR excess over the SMI (8.08% vs 1.74%) combines with the highest Sharpe in the series (0.438), low volatility (17.32%), down capture of 40.72%, and just one cash period across 25 years.
The structural alignment between Swiss corporate culture and the Low Debt Quality signal is real. Pharma, consumer staples, and specialty industrials dominate the qualifying universe. These industries have pricing power, recurring revenue, and balance sheets that don't need leverage to sustain margins. The Piotroski filter then selects the ones that are actively improving.
Against the local benchmark, Switzerland is the best risk-adjusted result in this series, though Sweden's +6.84% edges it on raw excess return. Total return: 597.96% vs 53.95% for the SMI.
Part of a Series
This post is part of the Low Debt Quality backtest series, tested across 13 markets:
Run This Screen Yourself
The SQL above runs on live TTM data. It surfaces today's qualifying Swiss companies using the balance sheet and profitability filters. A full Piotroski score requires multi-year annual statements (the backtest computes this per stock each July), but the D/E filter combined with the other quality checks gives a reasonable current read on the universe.
Data: FMP financial data warehouse, 2000–2025. Updated March 2026.
Data: Ceta Research, FMP financial data warehouse. Returns in CHF. Annual rebalance July, equal weight, 2000–2025.
Past performance does not guarantee future results. This is educational content, not investment advice.


