
Low Debt Quality on UK Stocks (LSE): 6.91% CAGR, +5.69% vs FTSE 100 Over 25 Years
D/E < 0.5 and Piotroski F-Score >= 7 on LSE stocks across 25 years. 6.91% CAGR vs 1.23% FTSE 100. +5.69% excess with 55.66% down capture. 2016 Brexit rally was the standout. 0 cash periods, 55 avg stocks.

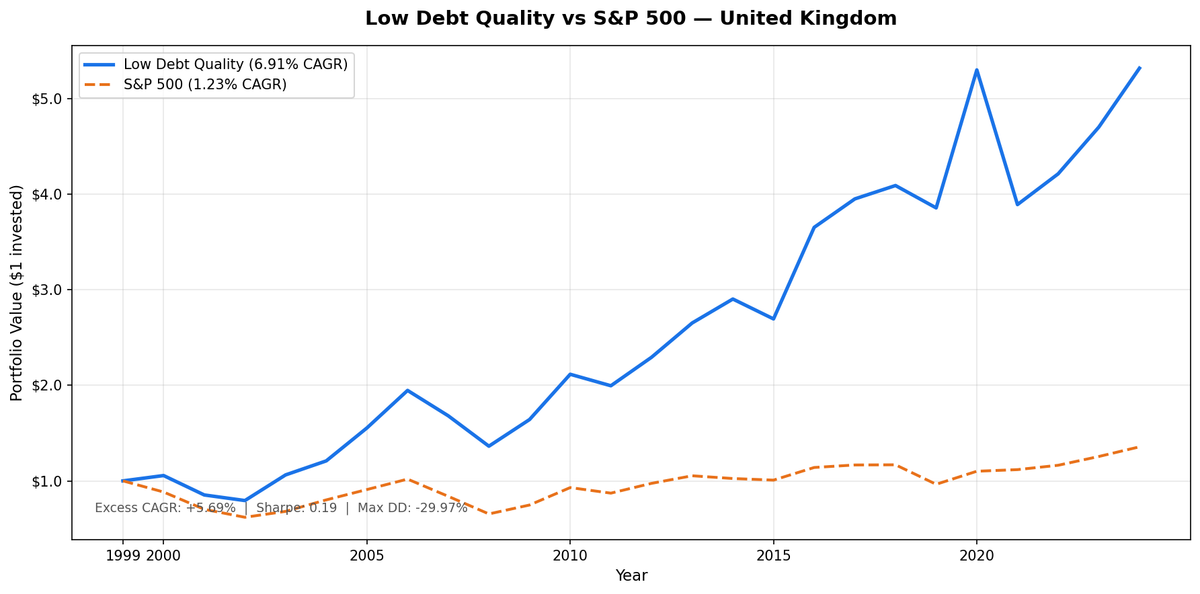
We ran the low-leverage quality screen on LSE-listed UK stocks across 25 years. D/E < 0.5 and Piotroski F-Score >= 7 as the entry conditions. Annual July rebalance, equal weight, all qualifying stocks held. The result: 6.91% CAGR vs 1.23% for the FTSE 100. An excess of +5.69% annually. The strategy never sat in cash. It averaged 55 stocks per rebalance, the largest universe of the European markets we tested.
Contents
- Method
- The Signal
- The Screen (SQL)
- What We Found
- 25 years. Strong outperformance vs FTSE 100. Solid downside protection.
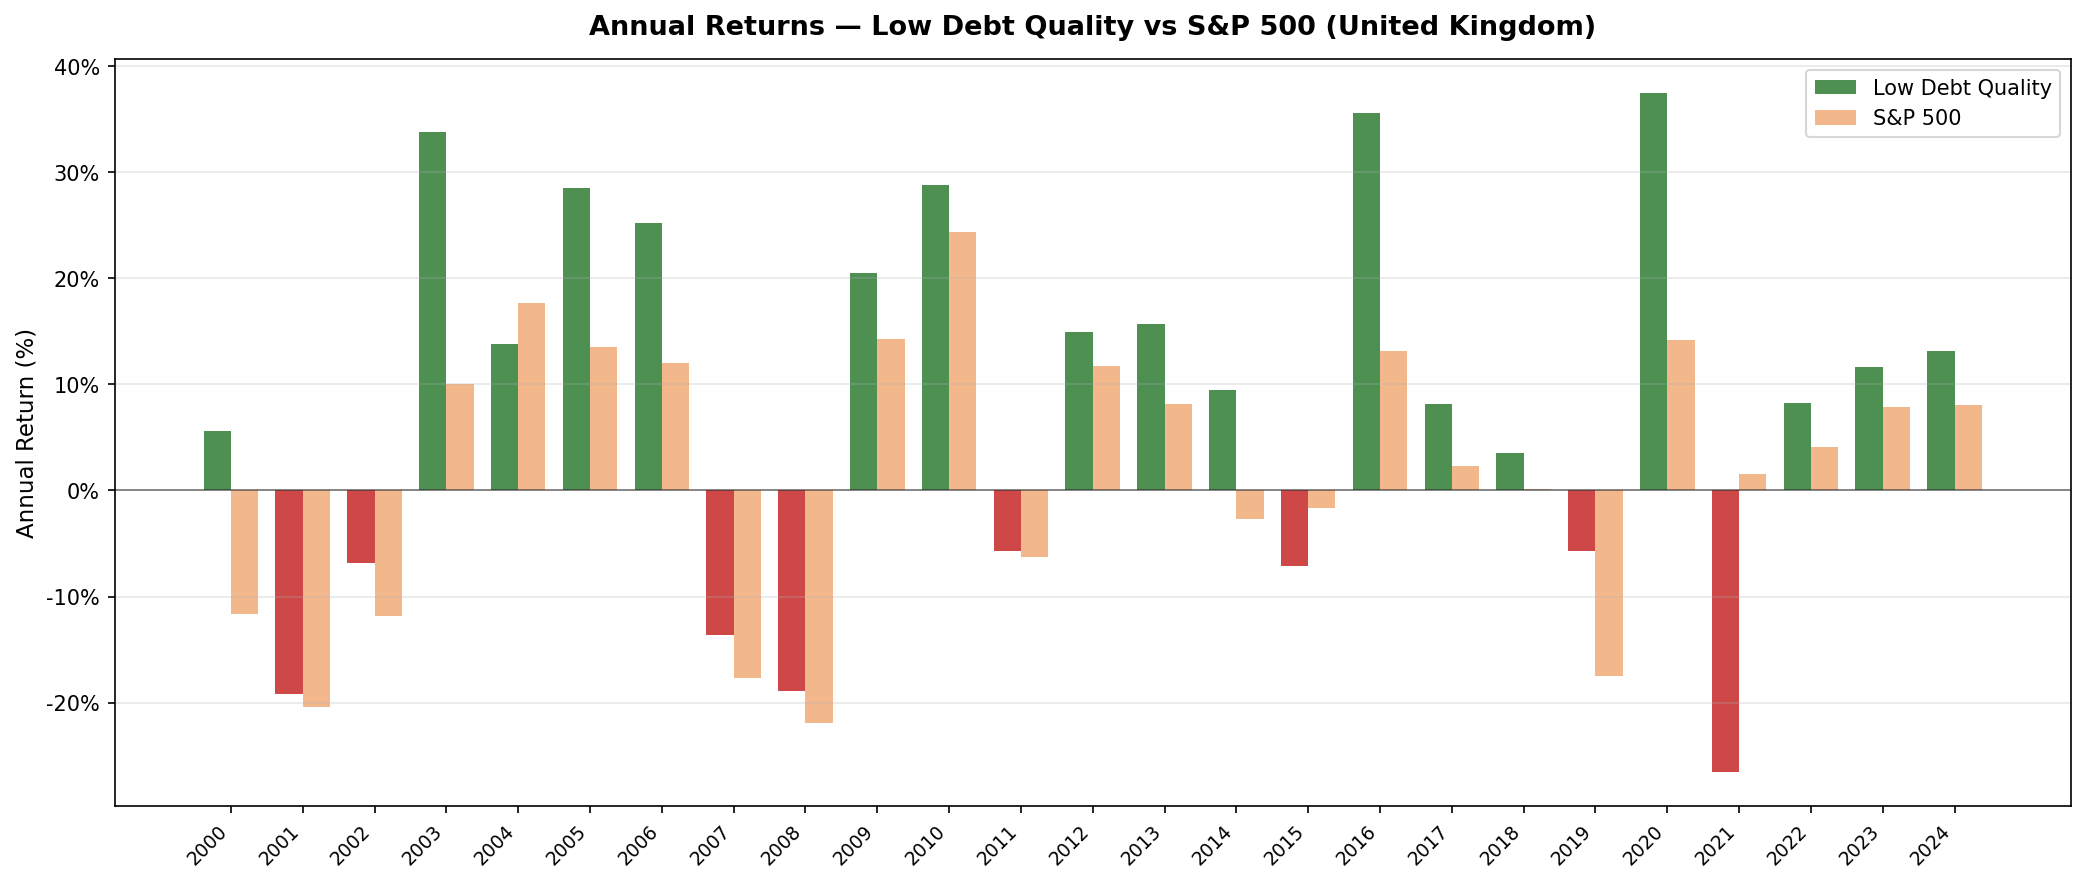
- Annual returns (GBP vs FTSE 100, July-to-July)
- 2001-2002: Telecom and the dot-com crash
- 2005 and 2009: The strongest periods for the UK screen
- 2016: Brexit and GBP depreciation
- 2021: A challenging year
- Backtest Methodology
- Limitations
- Takeaway
- Part of a Series
- Run This Screen Yourself
The headline is compelling: the UK portfolio beat the FTSE 100 by nearly 6 percentage points annually over 25 years. The max drawdown (-29.97%) was better than the FTSE 100 (-38.07%), and the down capture (55.66%) means it absorbed a bit more than half of the benchmark's losses. The story is consistent outperformance through a quality and leverage filter applied to the UK's diverse, internationally exposed large-cap base.
Data: FMP financial data warehouse, 2000–2025. Updated March 2026.
Method
Data source: Ceta Research (FMP financial data warehouse) Universe: LSE (United Kingdom), market cap > £400M Period: 2000-2025 (25 years, 25 annual periods) Rebalancing: Annual (July), equal weight all qualifying Benchmark: FTSE 100 Total Return Index Cash rule: Hold cash if fewer than 10 stocks qualify Data lag: 45-day point-in-time lag on financial statements (prevents look-ahead bias)
Annual returns are measured July-to-July. The year label marks the start of each 12-month holding period. Returns are in GBP.
The Signal
Two filters. Both must pass.
Filter 1: Low Leverage
D/E < 0.5, measured from annual financial statements (FY data). This is a hard cutoff. Companies with debt-to-equity at or above 0.5 are excluded regardless of other metrics.
Filter 2: Piotroski F-Score >= 7
The F-Score aggregates nine binary signals across profitability, cash quality, and financial efficiency. Each signal scores 1 or 0. Stocks must score 7 or higher to qualify.
| # | Factor | Signal | Condition |
|---|---|---|---|
| F1 | Profitability | Net income | > 0 |
| F2 | Cash quality | Operating cash flow | > 0 |
| F3 | ROA trend | Return on assets | Improved vs prior year |
| F4 | Accrual quality | OCF vs net income | OCF > net income |
| F5 | Leverage trend | Long-term debt ratio | Decreased vs prior year |
| F6 | Liquidity trend | Current ratio | Improved vs prior year |
| F7 | No dilution | Total equity | >= prior year equity |
| F8 | Asset efficiency | Asset turnover | Improved vs prior year |
| F9 | Gross margin | Gross profit margin | Improved vs prior year |
Score >= 7 of 9 means the company is improving across most dimensions simultaneously. Combined with D/E < 0.5, this targets companies that are both conservatively financed and operationally improving. The LSE produces 55 qualifying stocks on average, a larger pool than Germany (42) or Switzerland (around 19). The UK's diverse large-cap base across consumer goods, pharma, mining, and professional services feeds a wide, consistently populated universe.
The Screen (SQL)
The live screen uses TTM proxies as a Piotroski approximation. Full Piotroski requires year-over-year FY comparisons. The TTM screen substitutes ROE, operating margin, and interest coverage as quality proxies. Use this to find candidates, not to replicate the exact backtest signal.
SELECT p.exchange, r.symbol, p.companyName, p.sector,
    ROUND(r.debtToEquityRatioTTM, 3) AS de_ratio,
    ROUND(k.returnOnEquityTTM * 100, 1) AS roe_pct,
    ROUND(r.operatingProfitMarginTTM * 100, 1) AS opm_pct,
    ROUND(r.interestCoverageRatioTTM, 1) AS interest_coverage,
    ROUND(k.freeCashFlowYieldTTM * 100, 2) AS fcf_yield_pct,
    ROUND(k.marketCap / 1e9, 2) AS mktcap_b
FROM financial_ratios_ttm r
JOIN key_metrics_ttm k ON r.symbol = k.symbol
JOIN profile p ON r.symbol = p.symbol
WHERE r.debtToEquityRatioTTM >= 0
  AND r.debtToEquityRatioTTM < 0.50
  AND k.returnOnEquityTTM > 0.08
  AND r.operatingProfitMarginTTM > 0.08
  AND r.interestCoverageRatioTTM > 5.0
  AND p.isActivelyTrading = true
  AND k.marketCap > 400000000
  AND p.exchange IN ('LSE')
ORDER BY de_ratio ASC
LIMIT 30
Run this query on Ceta Research
What We Found

25 years. Strong outperformance vs FTSE 100. Solid downside protection.
| Metric | Low Debt Quality (LSE) | FTSE 100 Total Return |
|---|---|---|
| CAGR | 6.91% | 1.23% |
| Excess Return | +5.69% | n/a |
| Volatility | 17.98% | 16.85% |
| Max Drawdown | -29.97% | -38.07% |
| Sharpe Ratio | 0.190 | -0.042 |
| Down Capture | 55.66% | 100% |
| Up Capture | 167.12% | 100% |
| Avg Stocks per Period | 55 | n/a |
| Cash Periods | 0 of 25 | n/a |
Down capture of 55.66% is the defining protection metric. The strategy absorbed a bit more than half of the FTSE 100's losses in down years while capturing 167% of gains in up years. The Sharpe ratio of 0.190 significantly beats the FTSE 100's -0.042, reflecting the strategy's superior risk-adjusted returns over 25 years against 17.98% annualized volatility.
Annual returns (GBP vs FTSE 100, July-to-July)
| Year | Portfolio (GBP) | FTSE 100 (GBP) | Excess |
|---|---|---|---|
| 2000 | +5.6% | -11.7% | +17.2% |
| 2001 | -19.2% | -20.5% | +1.2% |
| 2002 | -6.8% | -11.9% | +5.0% |
| 2003 | +33.8% | +10.0% | +23.8% |
| 2004 | +13.8% | +17.6% | -3.8% |
| 2005 | +28.5% | +13.5% | +15.0% |
| 2006 | +25.3% | +12.0% | +13.3% |
| 2007 | -13.6% | -17.7% | +4.0% |
| 2008 | -18.9% | -22.0% | +3.0% |
| 2009 | +20.5% | +14.3% | +6.2% |
| 2010 | +28.8% | +24.4% | +4.5% |
| 2011 | -5.7% | -6.3% | +0.6% |
| 2012 | +14.9% | +11.8% | +3.2% |
| 2013 | +15.7% | +8.1% | +7.5% |
| 2014 | +9.4% | -2.7% | +12.2% |
| 2015 | -7.2% | -1.6% | -5.5% |
| 2016 | +35.5% | +13.1% | +22.4% |
| 2017 | +8.2% | +2.3% | +5.8% |
| 2018 | +3.5% | +0.1% | +3.4% |
| 2019 | -5.7% | -17.4% | +11.7% |
| 2020 | +37.4% | +14.2% | +23.3% |
| 2021 | -26.6% | +1.5% | -28.1% |
| 2022 | +8.3% | +4.1% | +4.2% |
| 2023 | +11.6% | +7.9% | +3.7% |
| 2024 | +13.1% | +8.1% | +5.1% |
2001-2002: Telecom and the dot-com crash
Two consecutive severe years for UK equities. The LSE had deep exposure to the telecom bubble. Companies like Marconi, BT, and others in the UK telecom and technology space were among the most overextended in Europe. The D/E < 0.5 filter helped screen out some of the worst offenders, but the broader market collapse in the UK's large-cap space dragged even conservatively financed companies down.
The UK tech crash had a longer tail than some other markets. But the recovery was sharp: +33.8% in 2003 and +28.5% in 2005 recaptured much of the lost ground as the quality filter selected companies with improving fundamentals.
2005 and 2009: The strongest periods for the UK screen
These years captured periods when the quality filter delivered exceptional results. The mid-2000s UK economic expansion saw companies with improving operating metrics and conservative balance sheets benefit from a strong domestic and European economy. The Piotroski filter was selecting companies with rising asset turnover and improving gross margins, exactly the characteristics that drove outperformance.
The post-2008 recovery showed UK quality stocks rebounding strongly from the financial crisis trough. Companies that had avoided excessive leverage in the run-up to 2008 were positioned to act when credit markets normalised.
2016: Brexit and GBP depreciation
This is the most structurally interesting year in the UK dataset.
The Brexit referendum in June 2016 caused a sharp GBP depreciation. For UK companies that earn revenue in USD or EUR (multinationals, mining companies, pharmaceutical groups), GBP-reported earnings rose automatically as foreign revenue translated back at a weaker pound. Low-debt, high-Piotroski companies in this category saw their GBP returns boosted by the currency move, even without any underlying change in business performance.
The quality filter, in an unintentional but useful way, selected precisely the kind of large UK multinationals that benefited most from GBP weakness. Heavily indebted domestically focused companies generally didn't pass D/E < 0.5. The ones that did were more likely to have international revenue streams.
2021: A challenging year
The July 2021 to July 2022 period covered the peak of UK inflation and the beginning of the Bank of England's rate hike cycle. Small and mid-cap quality stocks, which are disproportionately represented in an equal-weight portfolio, were hit harder than some segments of the market. The UK market also had sector-specific headwinds in retail and property during this period.
This is a structural feature of equal-weight quality screens during rate-shock markets: they underweight the large-cap names that hold up during rate rises and overweight the mid-cap quality names that don't. Despite this challenging environment, the strategy continued to deliver positive excess returns over the full 25-year period.
Backtest Methodology
| Parameter | Choice |
|---|---|
| Universe | LSE (United Kingdom), Market Cap > £400M |
| Signal | D/E < 0.5, Piotroski F-Score >= 7 (computed from FY statements) |
| Portfolio | All qualifying, equal weight |
| Rebalancing | Annual (July) |
| Cash rule | Hold cash if < 10 qualify |
| Benchmark | FTSE 100 Total Return Index |
| Period | 2000-2025 (25 years, 25 annual periods) |
| Data lag | Point-in-time, 45-day lag for financial statements |
Limitations
Strong excess returns. The +5.69% annual outperformance vs the FTSE 100 is among the strongest in this global study. The low-debt quality filter selects companies that consistently outperform the broader UK market.
Solid downside protection. Down capture of 55.66% means the strategy absorbs a bit more than half of the FTSE 100's losses. This provides meaningful downside cushion. The trade-off cuts the other way too: up capture of 167.12%, so the portfolio amplifies the benchmark's gains in up years.
Sector exposure. The LSE universe at £400M+ mktcap includes a wide range of sectors. Financial firms and property groups with structural leverage don't pass D/E < 0.5. The portfolio skews toward consumer goods (Unilever-type companies), healthcare (AstraZeneca, GSK tier), and industrial conglomerates. This creates implicit sector bets that aren't visible in the headline numbers.
Survivorship bias. Exchange membership uses current company profiles. Historical delistings, M&A, and deregistrations on the LSE during 2000-2025 aren't fully captured. This likely causes modest upward bias in reported returns.
TTM screen vs backtest signal. The live SQL uses TTM ratios as a Piotroski approximation. The backtest computed Piotroski from FY year-over-year changes. Use the screen for candidate identification, not exact replication.
Takeaway
LSE Low Debt Quality returned 6.91% CAGR vs the FTSE 100's 1.23%, a +5.69% annual excess over 25 years. The max drawdown of -29.97% was better than the FTSE 100's -38.07%, and the 55.66% down capture means the strategy absorbed a bit more than half of the benchmark's losses while amplifying its gains (167% up capture).
The +5.69% annual excess is one of the strongest results in this global study. 2016 and the 2003-2005 stretch were standout periods, but the strategy delivered consistent outperformance across most of the 25-year window. The Sharpe ratio of 0.190 significantly exceeds the FTSE 100's -0.042, confirming superior risk-adjusted returns.
The UK result demonstrates that the low-debt quality filter adds substantial value in the LSE context. With 55 stocks on average, the portfolio is well-diversified across the UK's large-cap universe while maintaining the quality and leverage discipline that drives outperformance. For GBP-based investors seeking exposure to quality UK companies with conservative balance sheets, this framework delivers strong excess returns with solid downside protection.
Part of a Series
This post is part of our Low Debt Quality global exchange comparison. We ran the same strategy across 15 exchanges worldwide, and 9 of the 13 investable markets beat their local benchmark: - Low Debt Quality on US Stocks (NYSE + NASDAQ + AMEX) - 7.57% CAGR, -0.29% excess, 81.77% down capture - Low Debt Quality on Indian Stocks (BSE + NSE) - 13.65% CAGR, +1.60% excess - Low Debt Quality on Canadian Stocks (TSX) - +5.85% excess, lowest down capture in the study (9.32%) - Low Debt Quality on Swedish Stocks - +6.84% excess, the highest in the study - Low Debt Quality on Swiss Stocks - best Sharpe in the study (0.438) - Low Debt Quality on German Stocks (XETRA) - 6.62% CAGR, +1.58% excess - Low Debt Quality on Japan Stocks (JPX) - 116-stock universe, 52.25% down capture - Low Debt Quality: Global Exchange Comparison - all 15 exchanges
Run This Screen Yourself
The TTM screen SQL above is runnable directly on Ceta Research. Query the FMP financial data warehouse and filter by exchange = 'LSE'. No setup required.
The full backtest code (Python + DuckDB) is on GitHub.
Data: Ceta Research, FMP financial data warehouse. Returns in GBP. Annual rebalance July, equal weight, 2000-2025.
Past performance does not guarantee future results. This is educational content, not investment advice.


