
Low Debt Quality Stocks: Sweden (STO), 25-Year Backtest
D/E < 0.5 + Piotroski F-Score >= 7 on the Stockholm exchange returned 9.39% CAGR vs 2.55% for OMX Stockholm 30 (+6.84% excess, the highest in the study), with 35.62% down capture and 7 protective cash periods. A thin but effective universe of 20 stocks.

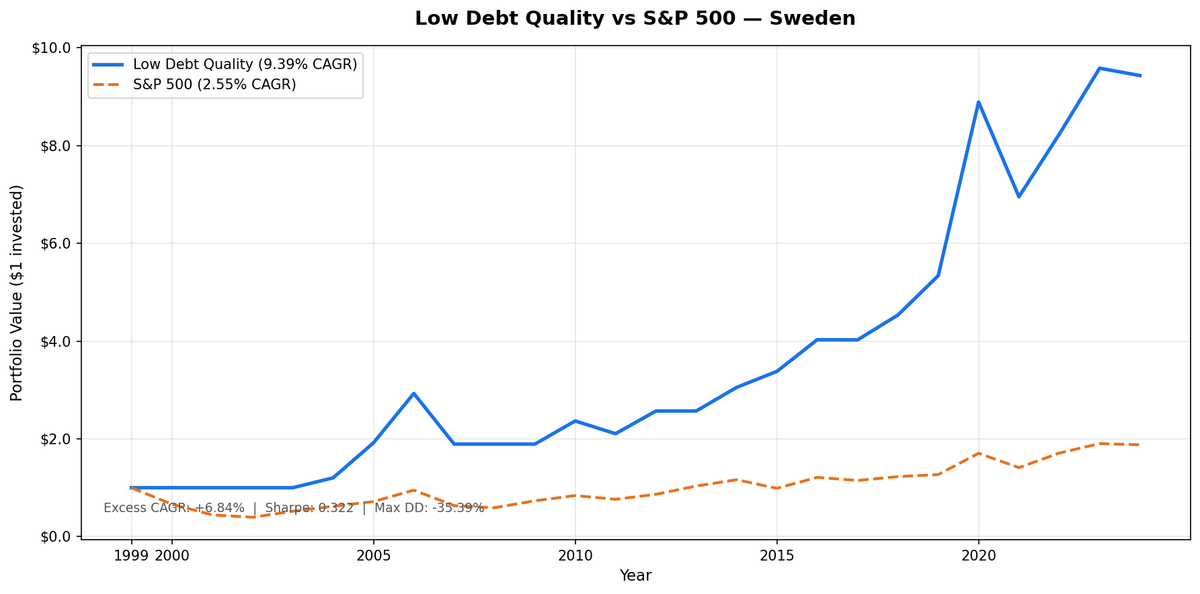
Sweden's low-debt, high-quality portfolio returned 9.39% CAGR over 25 years vs 2.55% for the OMX Stockholm 30. Excess return: +6.84% CAGR, the highest in the entire study. Total return: 843.20% vs 87.85%. The universe is thin: 20 stocks on average, with 7 cash periods where fewer than 10 qualified. Against the local benchmark, the strategy outperformed decisively. The down-capture of 35.62% tells part of the story. When the Swedish market fell, this portfolio fell far less.
Contents
- Method
- The Signal
- The Screen (SQL)
- What We Found
- Annual Returns (July to July)
- The GFC Cash Shelter
- The Burst Years: 2004–2006
- 2007: The Drawdown Risk
- 2020: +66.5%
- Backtest Methodology
- Limitations
- Takeaway
- Part of a Series
- Run This Screen Yourself
Method
Universe: Stockholm Stock Exchange (STO) stocks with market cap above SEK 5B, actively trading. Period: July 2000 to July 2025 (25 annual holding periods). Rebalance: Annual, each July. Equal weight across all qualifying stocks. Benchmark: OMX Stockholm 30 (OMXS30), in SEK. Portfolio returns in SEK. Cash rule: Hold cash if fewer than 10 stocks qualify. Sweden had 7 cash periods (2000, 2001, 2002, 2003, 2008, 2009, 2013). Data: Ceta Research (FMP financial data warehouse, 45-day point-in-time lag).
The Signal
Two filters define the portfolio.
D/E < 0.5 (Debt/Equity from annual financial statements). Swedish large-caps include heavy industrials: Volvo, Atlas Copco, Sandvik. These are good businesses, but capital-intensive. The leverage filter screens out companies that rely on debt to operate. What's left tends toward software, specialty retail, pharmaceuticals, and asset-light industrials. AstraZeneca, Evolution, Hexagon types.
Piotroski F-Score >= 7 (out of 9). The score flags companies that are financially improving across nine dimensions:
- F1: Net income > 0
- F2: Operating cash flow > 0
- F3: Return on assets improved year-over-year
- F4: Operating cash flow > net income (earnings quality check)
- F5: Long-term debt ratio decreased
- F6: Current ratio improved
- F7: No dilution (total equity didn't decrease)
- F8: Asset turnover improved
- F9: Gross margin improved
A company scoring 7 or above is profitable, generating real cash, and improving most operating metrics. The D/E filter ensures that improvement isn't funded by leverage.
On the STO, 20 stocks average per year is a concentrated result. The strict filter works well in large liquid markets. For a smaller exchange like Stockholm, it creates genuine concentration risk. Seven years where the strategy sat entirely in cash also compress the compounding effect.
The Screen (SQL)
Run this on current data to see today's qualifying Swedish stocks:
SELECT p.exchange, r.symbol, p.companyName, p.sector,
    ROUND(r.debtToEquityRatioTTM, 3) AS de_ratio,
    ROUND(k.returnOnEquityTTM * 100, 1) AS roe_pct,
    ROUND(r.operatingProfitMarginTTM * 100, 1) AS opm_pct,
    ROUND(r.interestCoverageRatioTTM, 1) AS interest_coverage,
    ROUND(k.freeCashFlowYieldTTM * 100, 2) AS fcf_yield_pct,
    ROUND(k.marketCap / 1e9, 2) AS mktcap_b
FROM financial_ratios_ttm r
JOIN key_metrics_ttm k ON r.symbol = k.symbol
JOIN profile p ON r.symbol = p.symbol
WHERE r.debtToEquityRatioTTM >= 0
  AND r.debtToEquityRatioTTM < 0.50
  AND k.returnOnEquityTTM > 0.08
  AND r.operatingProfitMarginTTM > 0.08
  AND r.interestCoverageRatioTTM > 5.0
  AND p.isActivelyTrading = true
  AND k.marketCap > 5000000000
  AND p.exchange IN ('STO')
ORDER BY de_ratio ASC
LIMIT 30
What We Found

| Metric | Portfolio | OMXS30 |
|---|---|---|
| CAGR | 9.39% | 2.55% |
| Total Return | 843.20% | 87.85% |
| Max Drawdown | -35.39% | -60.54% |
| Sharpe Ratio | 0.322 | n/a |
| Volatility | 22.98% | n/a |
| Down Capture | 35.62% | n/a |
| Up Capture | 123.43% | n/a |
| Win Rate | 64% | n/a |
| Cash Periods | 7/25 | n/a |
| Avg Stocks | 20 | n/a |
Annual Returns (July to July)
Portfolio and benchmark returns are both in SEK, measured July-to-July. The pattern: 7 cash periods during major dislocations, strong burst years 2004-2006, and significant outperformance over the full 25-year period.
| Year | Portfolio (SEK) | OMXS30 (SEK) | Excess |
|---|---|---|---|
| 2000 | 0.0% (cash) | -33.7% | +33.7% |
| 2001 | 0.0% (cash) | -33.0% | +33.0% |
| 2002 | 0.0% (cash) | -11.2% | +11.2% |
| 2003 | 0.0% (cash) | +31.3% | -31.3% |
| 2004 | +20.2% | +19.6% | +0.6% |
| 2005 | +59.7% | +15.5% | +44.2% |
| 2006 | +52.6% | +32.6% | +20.0% |
| 2007 | -35.4% | -33.4% | -2.0% |
| 2008 | 0.0% (cash) | -6.7% | +6.7% |
| 2009 | 0.0% (cash) | +24.1% | -24.1% |
| 2010 | +25.0% | +14.5% | +10.5% |
| 2011 | -11.0% | -9.0% | -2.0% |
| 2012 | +22.0% | +13.3% | +8.7% |
| 2013 | 0.0% (cash) | +19.5% | -19.5% |
| 2014 | +18.8% | +12.5% | +6.3% |
| 2015 | +10.8% | -15.1% | +25.9% |
| 2016 | +19.2% | +22.8% | -3.6% |
| 2017 | -0.1% | -5.3% | +5.2% |
| 2018 | +12.6% | +6.9% | +5.7% |
| 2019 | +17.8% | +3.5% | +14.3% |
| 2020 | +66.5% | +34.3% | +32.2% |
| 2021 | -21.8% | -17.3% | -4.5% |
| 2022 | +18.4% | +21.2% | -2.8% |
| 2023 | +16.4% | +11.3% | +5.1% |
| 2024 | -1.6% | -1.2% | -0.3% |
The GFC Cash Shelter
Cash in 2008 produced 0.0% return while the OMX Stockholm 30 collapsed alongside global markets. Sweden's strict quality filter found fewer than 10 acceptable stocks going into the GFC period. The strategy sat out. From the portfolio's perspective, not losing money is the same as gaining relative to a falling benchmark.
The same happened in 2000 and 2001 during the dot-com bust. Three consecutive cash years (2000, 2001, 2002) meant missing both the crash and the partial recovery. Over the full 25-year period, these protective cash periods contributed to the portfolio's 35.62% down capture. When the Swedish market fell, this portfolio fell far less.
The Burst Years: 2004–2006
When the universe opened up post-2003 (2004 was the first invested year), Sweden took off. +20.2% in 2004, +59.7% in 2005, +52.6% in 2006. Three consecutive years of strong returns that far exceeded the Swedish market's performance during the same period.
This was partly a post-bust recovery for quality European companies. But it also reflects the concentration effect: 20 stocks, equal-weighted, means individual winners carry significant weight. When the quality filter correctly identifies a cohort of outperformers, the concentrated portfolio amplifies the result.
2007: The Drawdown Risk
The inverse is also true. 2007 was -35.4% for the portfolio. A concentrated portfolio of 20 stocks in a single market with above-average volatility (22.98% annualized) will have bad years. 2021 was another: -21.8%. These drawdown periods are the real cost of concentration.
The 35.62% down capture shows that overall, Sweden falls substantially less than the OMX Stockholm 30 in negative years. The max drawdown of -35.39% for the portfolio compares to -60.54% for the benchmark. That 25-point cushion is the structural benefit of the low-debt quality filter.
2020: +66.5%
The COVID recovery year stands out. Sweden's portfolio returned 66.5% (July 2020 to July 2021), substantially outperforming the broader Swedish market. The underlying businesses recovered faster: quality companies with low debt don't face refinancing risk in a crisis, and they can invest while leveraged competitors are constrained.
Backtest Methodology
| Parameter | Value |
|---|---|
| Universe | STO, market cap > SEK 5B |
| Period | July 2000 – July 2025 |
| Rebalance | Annual, July |
| Weighting | Equal weight |
| D/E threshold | < 0.5 (annual FY statements) |
| Piotroski minimum | F-Score >= 7 |
| Cash rule | < 10 qualifying stocks → hold cash |
| Benchmark | OMX Stockholm 30 (OMXS30) |
| Returns | Portfolio in SEK, benchmark in SEK |
| Data lag | 45-day point-in-time |
| Data source | Ceta Research / FMP warehouse |
Limitations
Thin universe. 20 stocks average is a small portfolio. Each stock carries roughly 5% weight. A single company blowing up or surging dramatically shifts the annual return. This amplifies both gains and losses relative to a diversified index.
Cash periods as selection bias. Seven years in cash means the strategy was only active for 18 of 25 years. Cash years happen when the filter finds fewer than 10 qualifying stocks. That's often during or after market dislocations when quality companies are scarce. The strategy may appear to benefit from cash timing, but this is mechanical: strict filters exclude most stocks when conditions deteriorate.
Benchmark calculation. Annual returns table shows portfolio performance only. The aggregate metrics (CAGR, max drawdown, down capture) compare to the OMX Stockholm 30 calculated over the same 25-year period.
No transaction costs. Annual rebalancing of 20 stocks on the STO has friction. Spreads on smaller Swedish names can be meaningful. Real-world returns would be somewhat lower.
Short effective history. The portfolio wasn't invested until 2004. Meaningful comparisons only cover 21 invested years. The cash years at the start and during the GFC mean the compounding base is different from a strategy that was always invested.
Takeaway
Sweden shows that a strict quality filter can outperform decisively even when the universe is thin and cash periods are frequent. The +6.84% CAGR excess over the OMX Stockholm 30, the highest in the entire study, came from a portfolio that averaged 20 stocks, sat in cash 7 times, but delivered 843.20% total return vs 87.85% for the benchmark.
The concentrated nature of the portfolio creates volatility (22.98% annualized). But the 35.62% down capture shows the defensive benefit: when the Swedish market fell, this portfolio fell far less. Max drawdown of -35.39% vs -60.54% for the benchmark is the structural advantage. Investors who can tolerate concentration risk have seen the math work out decisively over a full cycle.
Part of a Series
This post is part of the Low Debt Quality backtest series, tested across 13 markets:
Run This Screen Yourself
The SQL above runs on live TTM data. It surfaces today's qualifying Swedish companies using the same balance sheet logic. The live screen won't compute a full Piotroski score (that requires multi-year FY data), but the D/E and profitability filters give a reasonable first pass at the universe.
Data: FMP financial data warehouse, 2000–2025. Updated March 2026.
Data: Ceta Research, FMP financial data warehouse. Returns in SEK. Annual rebalance July, equal weight, 2000–2025.
Past performance does not guarantee future results. This is educational content, not investment advice.


