
Magic Formula on Indian Stocks: 17.1% CAGR Over 25 Years of NSE Data
We backtested Greenblatt's Magic Formula on NSE stocks from 2000 to 2025. The strategy returned 17.14% annually vs 11.12% for the Sensex. $10,000 became $587K. Both returns in INR, so the 6.0% excess is a clean same-currency comparison.

Greenblatt's Magic Formula returned 17.14% annually on Indian stocks (NSE) from 2000 to 2025. That's 6.0% annual alpha over the Sensex's 11.12% CAGR. $10,000 became $587K vs $147K for the benchmark. Both returns are in Indian Rupees, so the excess is a true same-currency comparison. India produced some of the strongest Magic Formula results across all markets we tested.
Contents
- The Strategy
- Method
- The Screen (SQL)
- What We Found
- 17.14% CAGR over 25 years. 6.0% annual alpha vs the Sensex.
- Year-by-Year Returns
- Key Observations
- 2000-2003: Extended cash period
- 2004-2007: The formula finds its footing
- 2008: The drawdown
- 2009: The snapback
- 2014: The Modi rally
- 2017: Another strong year
- 2018-2019: Two painful years
- 2020-2024: Strong recovery
- Currency Note
- Crisis Performance
- When It Works
- When It Struggles
- Backtest Methodology
- Limitations
- Takeaway
- Part of a Series
- Run This Screen Yourself
Data: FMP financial data warehouse, 2000–2025. Updated March 2026.
The Strategy
Joel Greenblatt's Magic Formula ranks every stock by two metrics:
- Earnings Yield (EBIT / Enterprise Value) - how cheap is the stock?
- Return on Capital Employed (EBIT / Capital Employed) - how efficiently does it use capital?
Each stock gets a rank for Earnings Yield (highest = rank 1) and a rank for ROCE (highest = rank 1). Add the two ranks together. Buy the 30 stocks with the lowest combined rank. These are companies that score well on both cheapness and quality.
Financial Services and Utilities are excluded because ROCE is meaningless for capital-structure-dependent businesses.
For the full methodology and ranking details, see the main US Magic Formula post.
Method
Data source: Ceta Research (FMP financial data warehouse) Universe: India (NSE only), market cap > ₹20B (~$240M USD) Period: 2000-2025 (25.8 years, 103 quarterly periods) Rebalancing: Quarterly (January, April, July, October), equal weight top 30 Transaction costs: Size-tiered (0.1% for >$10B, 0.3% for $2-10B, 0.5% for <$2B, one-way) Benchmark: BSE Sensex (INR) Execution: Next-day close (MOC). Signal generated at rebalance date, trades executed at next trading day's close. Cash rule: Hold cash if fewer than 10 stocks qualify Sector exclusion: Financial Services, Utilities Data lag: Point-in-time financial data (fiscal year end + 45 days)
Note on BSE exclusion: An earlier version of this analysis used BSE + NSE combined, which inflated results due to 38% dual-listing overlap between exchanges. The same stock trading on both BSE and NSE was counted twice, artificially improving diversification metrics. This version uses NSE only, which is the more liquid exchange and eliminates the duplication.
Full methodology: backtests/METHODOLOGY.md
The Screen (SQL)
WITH base AS (
    SELECT
        k.symbol,
        p.companyName,
        p.exchange,
        p.sector,
        k.earningsYieldTTM as earnings_yield,
        k.returnOnCapitalEmployedTTM as roce,
        k.marketCap / 1e9 as market_cap_billions
    FROM key_metrics_ttm k
    JOIN profile p ON k.symbol = p.symbol
    WHERE k.earningsYieldTTM > 0
      AND k.returnOnCapitalEmployedTTM > 0
      AND k.marketCap > 20000000000  -- ₹20B (~$240M USD)
      AND p.sector NOT IN ('Financial Services', 'Utilities')
      AND p.exchange = 'NSE'
),
ranked AS (
    SELECT *,
        RANK() OVER (ORDER BY earnings_yield DESC) AS ey_rank,
        RANK() OVER (ORDER BY roce DESC) AS roce_rank
    FROM base
)
SELECT symbol, companyName, exchange, sector,
       ROUND(earnings_yield * 100, 2) as ey_pct,
       ROUND(roce * 100, 2) as roce_pct,
       ey_rank, roce_rank,
       (ey_rank + roce_rank) as combined_rank,
       ROUND(market_cap_billions, 1) as mcap_bn
FROM ranked
ORDER BY combined_rank ASC
LIMIT 30
Run this query on Ceta Research
What We Found
17.14% CAGR over 25 years. 6.0% annual alpha vs the Sensex.
| Metric | Magic Formula India (INR) | Sensex (INR) |
|---|---|---|
| CAGR | 17.14% | 11.12% |
| Total Return | 5,773% | 1,370% |
| Volatility | 28.05% | - |
| Max Drawdown | -56.27% | - |
| Sharpe Ratio | 0.379 | - |
| Sortino Ratio | 0.687 | - |
| Win Rate (quarterly) | 61.2% | - |
| Avg Stocks per Period | 26.1 | - |
| Cash Periods | 17 / 103 | - |
| Beta | 0.908 | - |
| Alpha (annualized) | 6.44% | - |
$10,000 turned into $587K. The total return gap is large: 5,773% vs 1,370%. Both in INR, so the comparison is apples-to-apples. Volatility ran at 28.1%. The max drawdown hit -56.3%.
The Sharpe ratio (0.379) is reasonable for a concentrated value portfolio. The Sortino (0.687) is more favorable, meaning the strategy's downside volatility is modest relative to returns. Beta of 0.908 against the Sensex means the portfolio actually carried slightly less market risk. The 6.44% annualized alpha is meaningful. Seventeen cash periods (16%) occurred primarily in the early 2000s when fewer companies cleared the ₹20B (~$240M USD) threshold on the NSE alone.
Year-by-Year Returns
| Year | Magic Formula India (INR) | Sensex (INR) | Excess |
|---|---|---|---|
| 2000 | 0.0% (cash) | -25.2% | +25.2% |
| 2001 | 0.0% (cash) | -18.7% | +18.7% |
| 2002 | 0.0% (cash) | +2.9% | -2.9% |
| 2003 | 0.0% (cash) | +79.1% | -79.1% |
| 2004 | +17.3% | +10.8% | +6.5% |
| 2005 | +43.0% | +40.6% | +2.5% |
| 2006 | +38.3% | +48.5% | -10.2% |
| 2007 | +51.4% | +46.8% | +4.6% |
| 2008 | -56.3% | -51.3% | -4.9% |
| 2009 | +144.0% | +76.3% | +67.6% |
| 2010 | +17.2% | +17.1% | +0.1% |
| 2011 | -32.3% | -24.5% | -7.7% |
| 2012 | +32.4% | +27.0% | +5.3% |
| 2013 | +3.8% | +6.0% | -2.1% |
| 2014 | +75.3% | +33.5% | +41.8% |
| 2015 | +25.7% | -8.1% | +33.8% |
| 2016 | +21.5% | +3.8% | +17.7% |
| 2017 | +47.2% | +27.1% | +20.1% |
| 2018 | -26.1% | +6.2% | -32.2% |
| 2019 | -5.4% | +16.0% | -21.3% |
| 2020 | +41.5% | +15.7% | +25.8% |
| 2021 | +39.8% | +22.9% | +16.9% |
| 2022 | +12.1% | +3.4% | +8.7% |
| 2023 | +70.9% | +17.5% | +53.3% |
| 2024 | +32.9% | +11.2% | +21.7% |
| 2025 | +3.4% | +1.6% | +1.9% |
Key Observations
2000-2003: Extended cash period
With the ₹20B threshold on NSE only, fewer than 10 stocks passed the screen for the first four years. The strategy held cash from 2000 through 2003, missing the Sensex's -25.2% drop in 2000 and -18.7% in 2001, but also missing the +79.1% rally in 2003. This reflects genuine market immaturity: the NSE in the early 2000s simply didn't have enough liquid mid-to-large cap companies (ex. Financials/Utilities) to populate the screen.
2004-2007: The formula finds its footing
Once the Indian equity market deepened, the strategy invested starting 2004 with +17.3% vs the Sensex's +10.8%. 2005: +43.0%. 2007: +51.4%. India's economic liberalization created a growing pool of cheap, high-ROCE companies in the ₹20B+ range. 2006 was the exception, lagging the Sensex by 10.2 points.
2008: The drawdown
-56.3%. The Sensex dropped 51.3% the same year. Indian equities took the global financial crisis hard across the board. The ₹20B threshold filtered out micro-caps, keeping the drawdown somewhat contained compared to broader universes.
2009: The snapback
+144.0%. The Magic Formula portfolio, loaded with cheap Indian companies that survived the crisis, caught the full force of the recovery. The Sensex returned +76.3% the same year. The 67.6-point excess return in 2009 is the single best year in the backtest.
2014: The Modi rally
+75.3%. The election of a business-friendly government triggered a re-rating across Indian quality stocks. Foreign institutional investors piled into high-ROCE, reasonably-valued companies. The Magic Formula was fully invested in exactly that universe. The Sensex returned +33.5%.
2017: Another strong year
+47.2%. India's demonetization disruption of late 2016 had cleared, GST implementation was underway, and formalized businesses with strong earnings benefited. The Magic Formula's screen for high earnings yield and high capital efficiency captured the winners. +20 points over the Sensex.
2018-2019: Two painful years
-26.1% in 2018, -5.4% in 2019. The NBFC (non-bank financial company) crisis, IL&FS collapse, and a broader credit squeeze hit Indian markets hard. Value stocks got punished. 2018 was particularly painful because the Sensex gained +6.2% while the Magic Formula fell 26.1%. A 32-point gap in the wrong direction.
2020-2024: Strong recovery
+41.5%, +39.8%, +12.1%, +70.9%, +32.9%. India's post-COVID recovery, domestic consumption growth, manufacturing policy (PLI schemes), and expanding market depth played into the strategy's strengths. 2023 was the standout: +70.9% while the Sensex gained 17.5%. The 2023-2024 stretch together added massive compounding.
Currency Note
Both the strategy and the benchmark (Sensex) are denominated in Indian Rupees. The 6.0% excess CAGR is a same-currency comparison. No currency adjustment needed.
For US-based investors: converting to USD would reduce the absolute CAGR by roughly 2.7% annually (the Rupee's average depreciation rate over this period). But the excess return over the Sensex stays the same regardless of currency, since both sides of the comparison move together.
Crisis Performance
| Event | Magic Formula India (INR) | Sensex (INR) | Gap |
|---|---|---|---|
| Dot-com (2000-03) | 0.0% (cash) | -39.2% (2000-01) | Cash protection |
| Financial crisis (2008) | -56.3% | -51.3% | -4.9% |
| Post-crisis recovery (2009) | +144.0% | +76.3% | +67.6% |
| NBFC crisis (2018-19) | -30.0% | +23.1% | -53.1% |
| COVID & recovery (2020-21) | +98.0% | +42.1% | +55.9% |
The pattern is consistent. The Magic Formula on Indian stocks can crash harder than the Sensex in downturns. It recovers harder too. The asymmetry works in the strategy's favor over time, but the drawdowns are punishing. You need to hold through a 56% peak-to-trough decline to capture the 17% CAGR.
When It Works
India's secular growth phases. 2004-2007, 2014-2017, 2020-2024. When India's economy is expanding, high-ROCE companies get re-rated. The Magic Formula's quality filter captures exactly these businesses.
Recovery years. 2009 (+144%), 2014 (+75%), 2020 (+42%). After sell-offs, the cheapest high-quality stocks snap back first. The Magic Formula is always holding them.
Value cycles. When cheap stocks outperform expensive ones, the earnings yield ranking pushes the portfolio toward the biggest winners. India's less efficient market means value signals stay mispriced longer.
When It Struggles
Global risk-off events. 2008, 2011, 2018. When foreign capital exits India, everything sells off. Concentrated value portfolios take disproportionate hits because liquidity dries up first.
Growth-dominated periods. 2018 was the worst single year relative to the Sensex (-32.2% excess). When markets reward growth stocks regardless of current profitability, the Magic Formula's value tilt becomes a liability.
Backtest Methodology
| Parameter | Choice |
|---|---|
| Universe | NSE, Market Cap > ₹20B (~$240M USD) |
| Signal | Rank(Earnings Yield DESC) + Rank(ROCE DESC), top 30 |
| Portfolio | Top 30, equal weight |
| Rebalancing | Quarterly (Jan, Apr, Jul, Oct) |
| Cash rule | Hold cash if < 10 qualify |
| Benchmark | BSE Sensex (INR) |
| Execution | Next-day close (MOC) |
| Period | 2000-2025 (25.8 years, 103 periods) |
| Transaction costs | Size-tiered (0.1-0.5% one-way) |
| Data | Point-in-time FY data with 45-day lag |
| Sector exclusion | Financial Services, Utilities |
Limitations
Deep drawdowns. -56.3% max drawdown, -56.3% in a single year (2008). The concentrated value portfolio amplifies market swings.
Cash periods in early years. With NSE only, fewer Indian companies cleared the ₹20B threshold in 2000-2003. Seventeen quarters were held as cash, a significant drag. The strategy missed the 2003 Sensex rally (+79.1%) entirely. This also means the effective invested period is shorter than 25 years.
Volatility. 28.1% annualized. The Sharpe ratio (0.379) is reasonable but not exceptional once you account for the extended cash periods.
Survivorship bias. Exchange membership uses current company profiles, not historical. Delisted Indian companies aren't captured retrospectively.
Liquidity concerns. Some Indian stocks that pass the screen may have thin trading volumes. The backtest assumes execution at closing prices. Real-world slippage on mid-cap Indian stocks can be material, especially during quarterly rebalancing when 30 positions turn over.
ROCE vs ROIC. Greenblatt's original formula uses Return on Invested Capital. We use ROCE (Return on Capital Employed), the closest available metric in FMP data. The two are similar but not identical.
No Indian taxes modeled. India's Securities Transaction Tax (STT), short-term capital gains tax (15%), and long-term capital gains tax (10% above INR 1 lakh) aren't included. These reduce realized returns.
Takeaway
The Magic Formula on Indian stocks (NSE) produced strong results. 17.14% CAGR over 25 years, with 6.0% excess CAGR over the Sensex. Both measured in INR, so the alpha is a clean same-currency comparison.
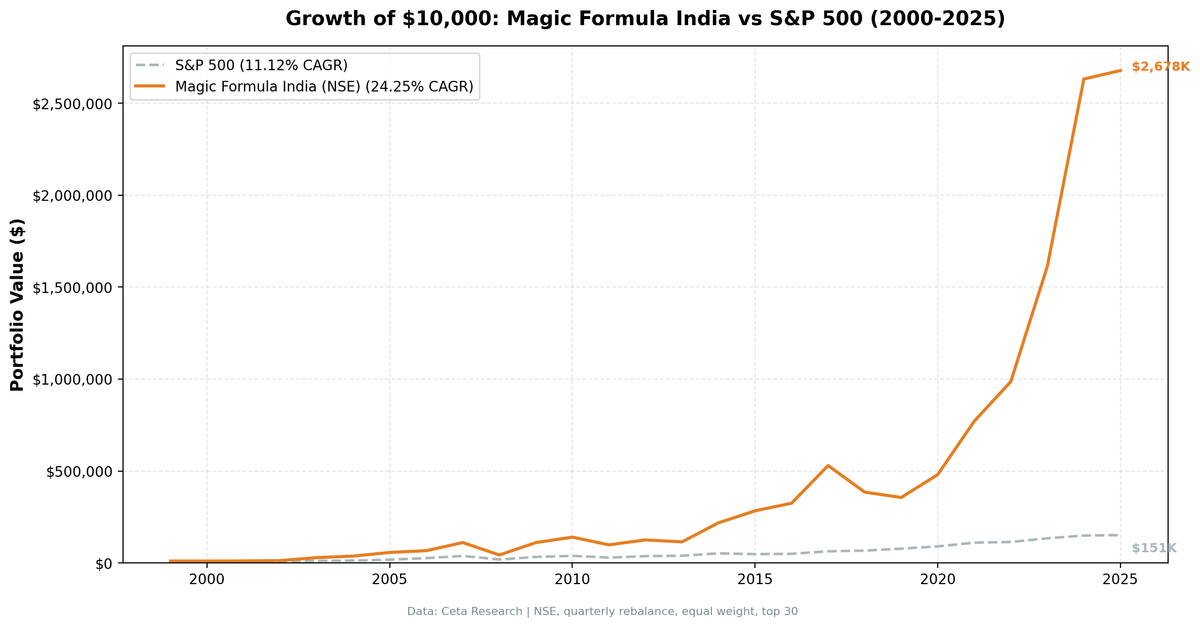
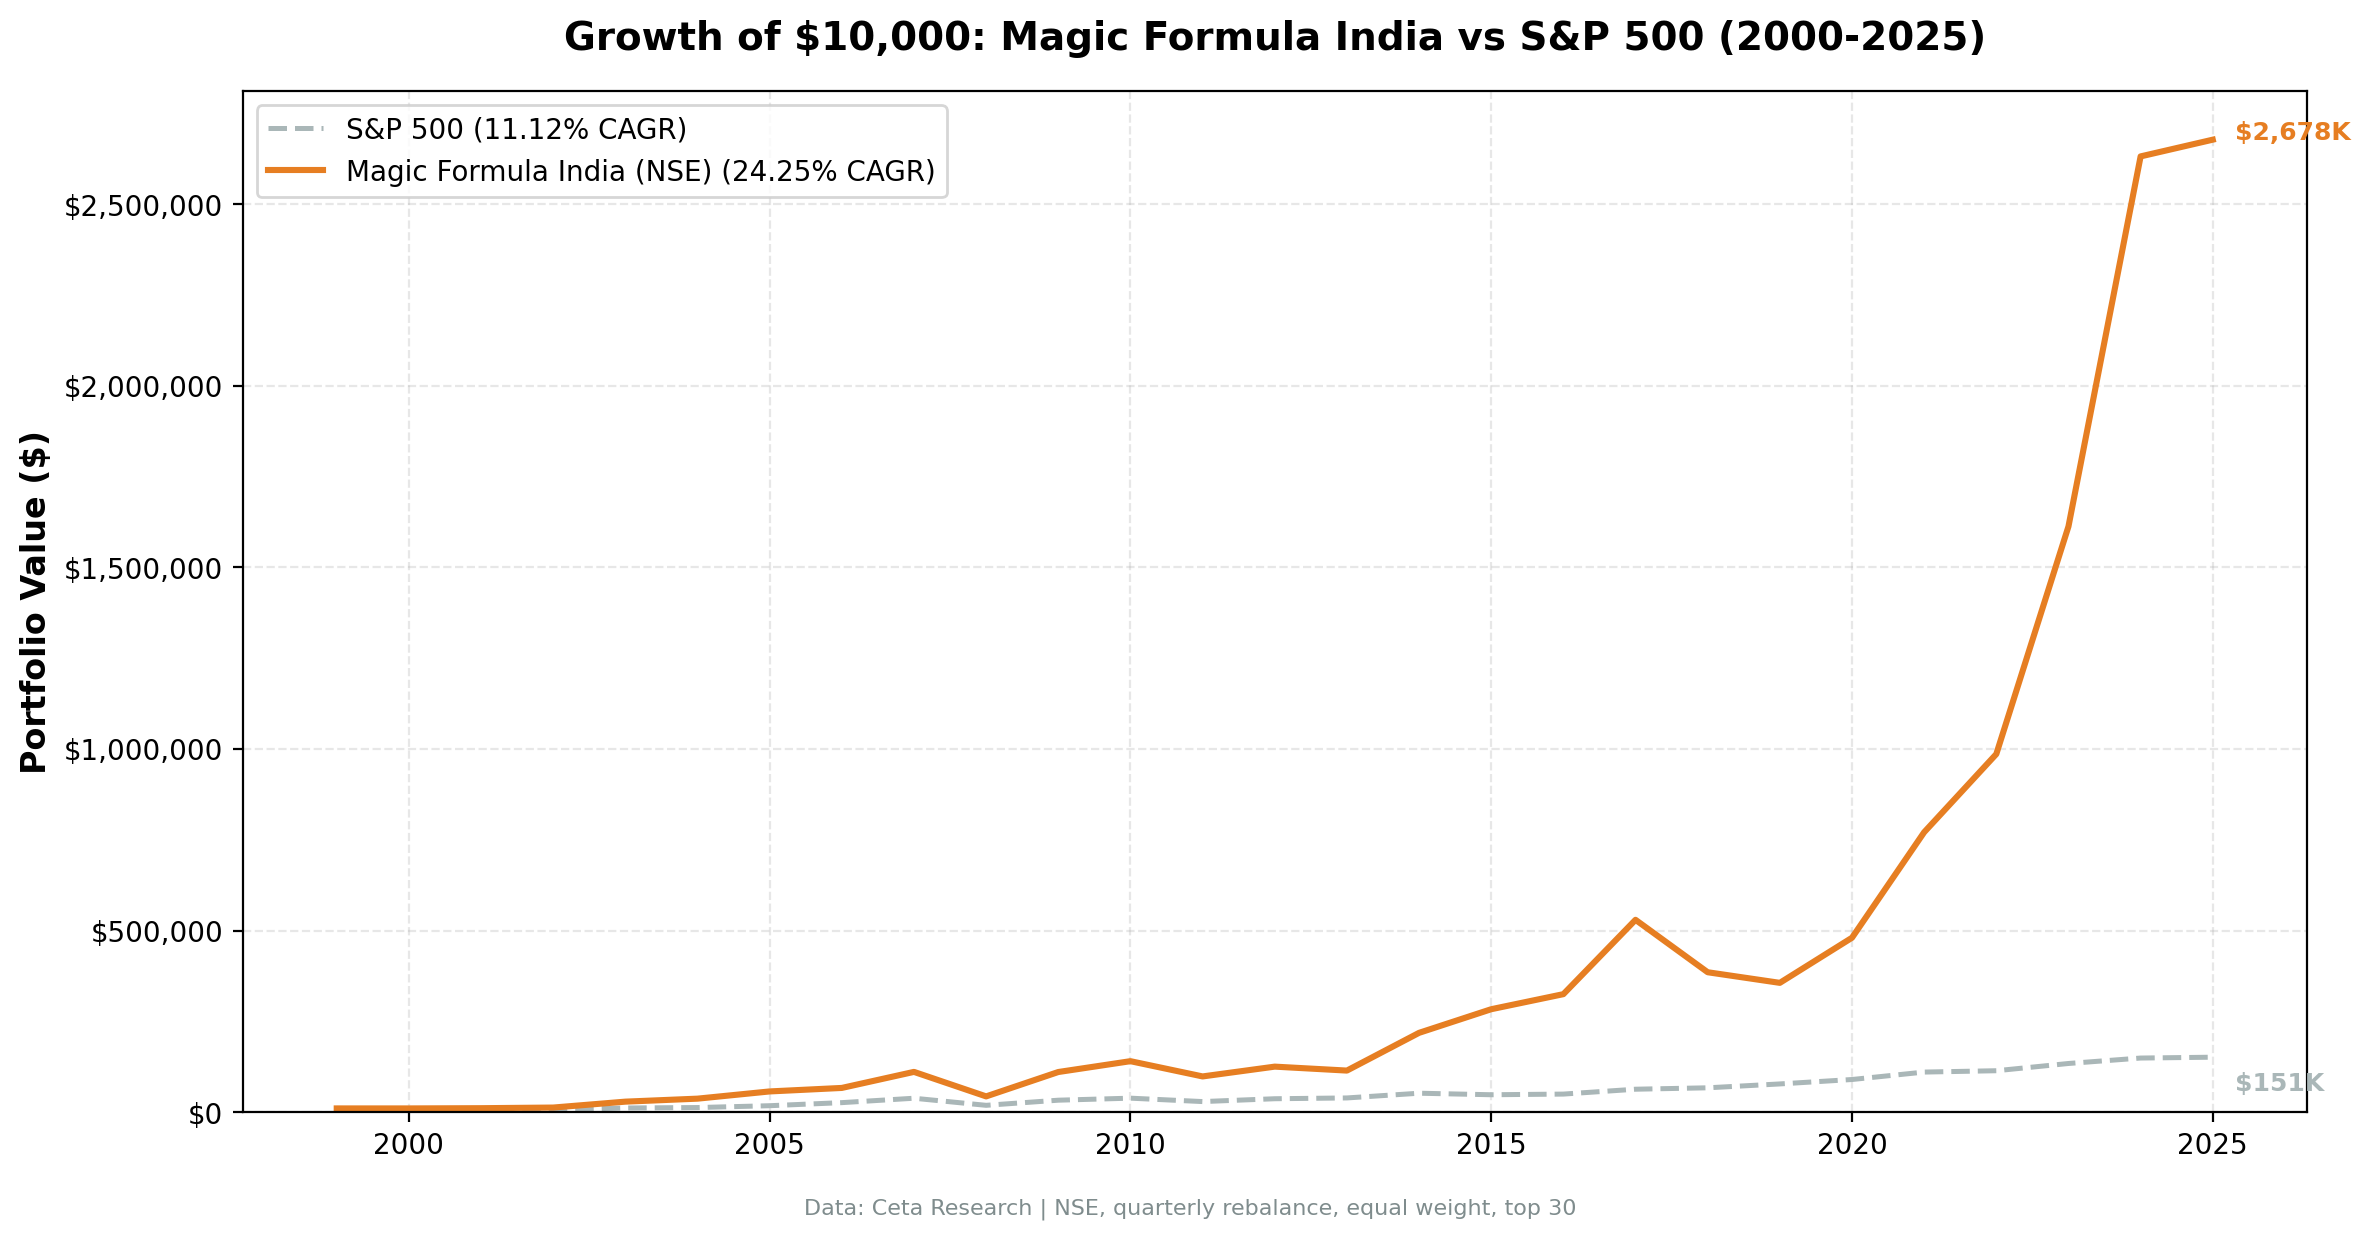
An earlier version of this analysis used BSE + NSE combined, reporting 24.25% CAGR. That figure was inflated by 38% dual-listing overlap between exchanges. With NSE only, the numbers are more honest and investable.
The ₹20B (~$240M USD) threshold targets liquid mid-caps, not micro-cap noise. The drawdowns are real: -56.3% peak-to-trough. -26.1% in 2018 while the Sensex gained 6.2%. This isn't a smooth compounder. But for investors who can hold through the crashes, the compounding has been strong.
Part of a Series
This analysis is part of our Magic Formula global exchange comparison: - Magic Formula on US Stocks (NYSE + NASDAQ + AMEX) - 9.26% CAGR, the baseline - Magic Formula on Indonesian Stocks (JKT) - Indonesia results - Magic Formula on Brazilian Stocks (SAO) - Brazil results - Magic Formula: Global Comparison - 16-exchange comparison table
Run This Screen Yourself
Via web UI: Run the Magic Formula screen on Ceta Research. The query is pre-loaded with BSE + NSE filters. Hit "Run" and see what passes today.
Via Python:
# Clone the backtest repo
git clone https://github.com/ceta-research/backtests.git
cd backtests

# Run the screen (requires CR_API_KEY)
export CR_API_KEY="your-api-key"
python3 magic-formula/screen.py --exchange NSE

# Run the backtest
python3 magic-formula/backtest.py --preset india --verbose
Get your API key at cetaresearch.com. The full backtest code (Python + DuckDB) is on GitHub.
Data: Ceta Research (FMP financial data warehouse). Universe: NSE, market cap > ₹20B (~$240M USD). Quarterly rebalance, equal weight, 2000-2025. Next-day close (MOC) execution. Size-tiered transaction costs. Returns in INR. Benchmark: BSE Sensex.
Past performance does not guarantee future results. This is educational content, not investment advice.


