
P/E Compression in the UK: 9.02% CAGR with Defensive Characteristics

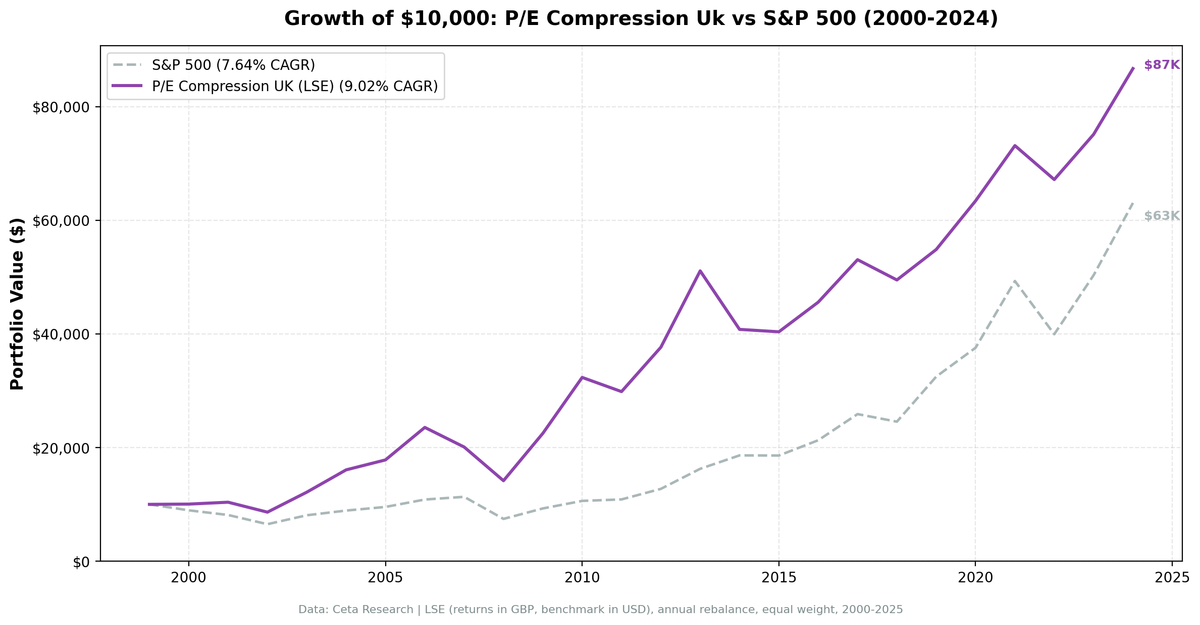
We tested a P/E compression mean reversion screen on 25 years of UK stock data from the London Stock Exchange. The signal triggers when current P/E drops 15% below the 5-year average, filtered for quality. The strategy returned 9.02% annually (GBP-denominated returns) vs 7.64% for SPY (USD), with 1.38% excess return and exceptional downside protection: 60% down-capture means the portfolio captured only 60% of SPY's losses on average.
Contents
- Method
- What We Found
- 25 years. 1.38% annual alpha. Best-in-class downside protection.
- Year-by-year returns
- Why the UK works for P/E compression
- Backtest Methodology
- Limitations
- Conclusion
Method
- Data source: Ceta Research (FMP financial data warehouse)
- Universe: LSE, market cap > £500M
- Period: 2000-2025 (25 years, 25 annual periods)
- Rebalancing: Annual (January), equal weight, top 30 by compression ratio
- Benchmark: S&P 500 Total Return (SPY, USD)
- Cash rule: Hold cash if fewer than 10 stocks qualify
Returns are in GBP. Benchmark (SPY) is in USD. Direct comparison reflects how a UK-based investor would experience the strategy vs holding US equities.
What We Found
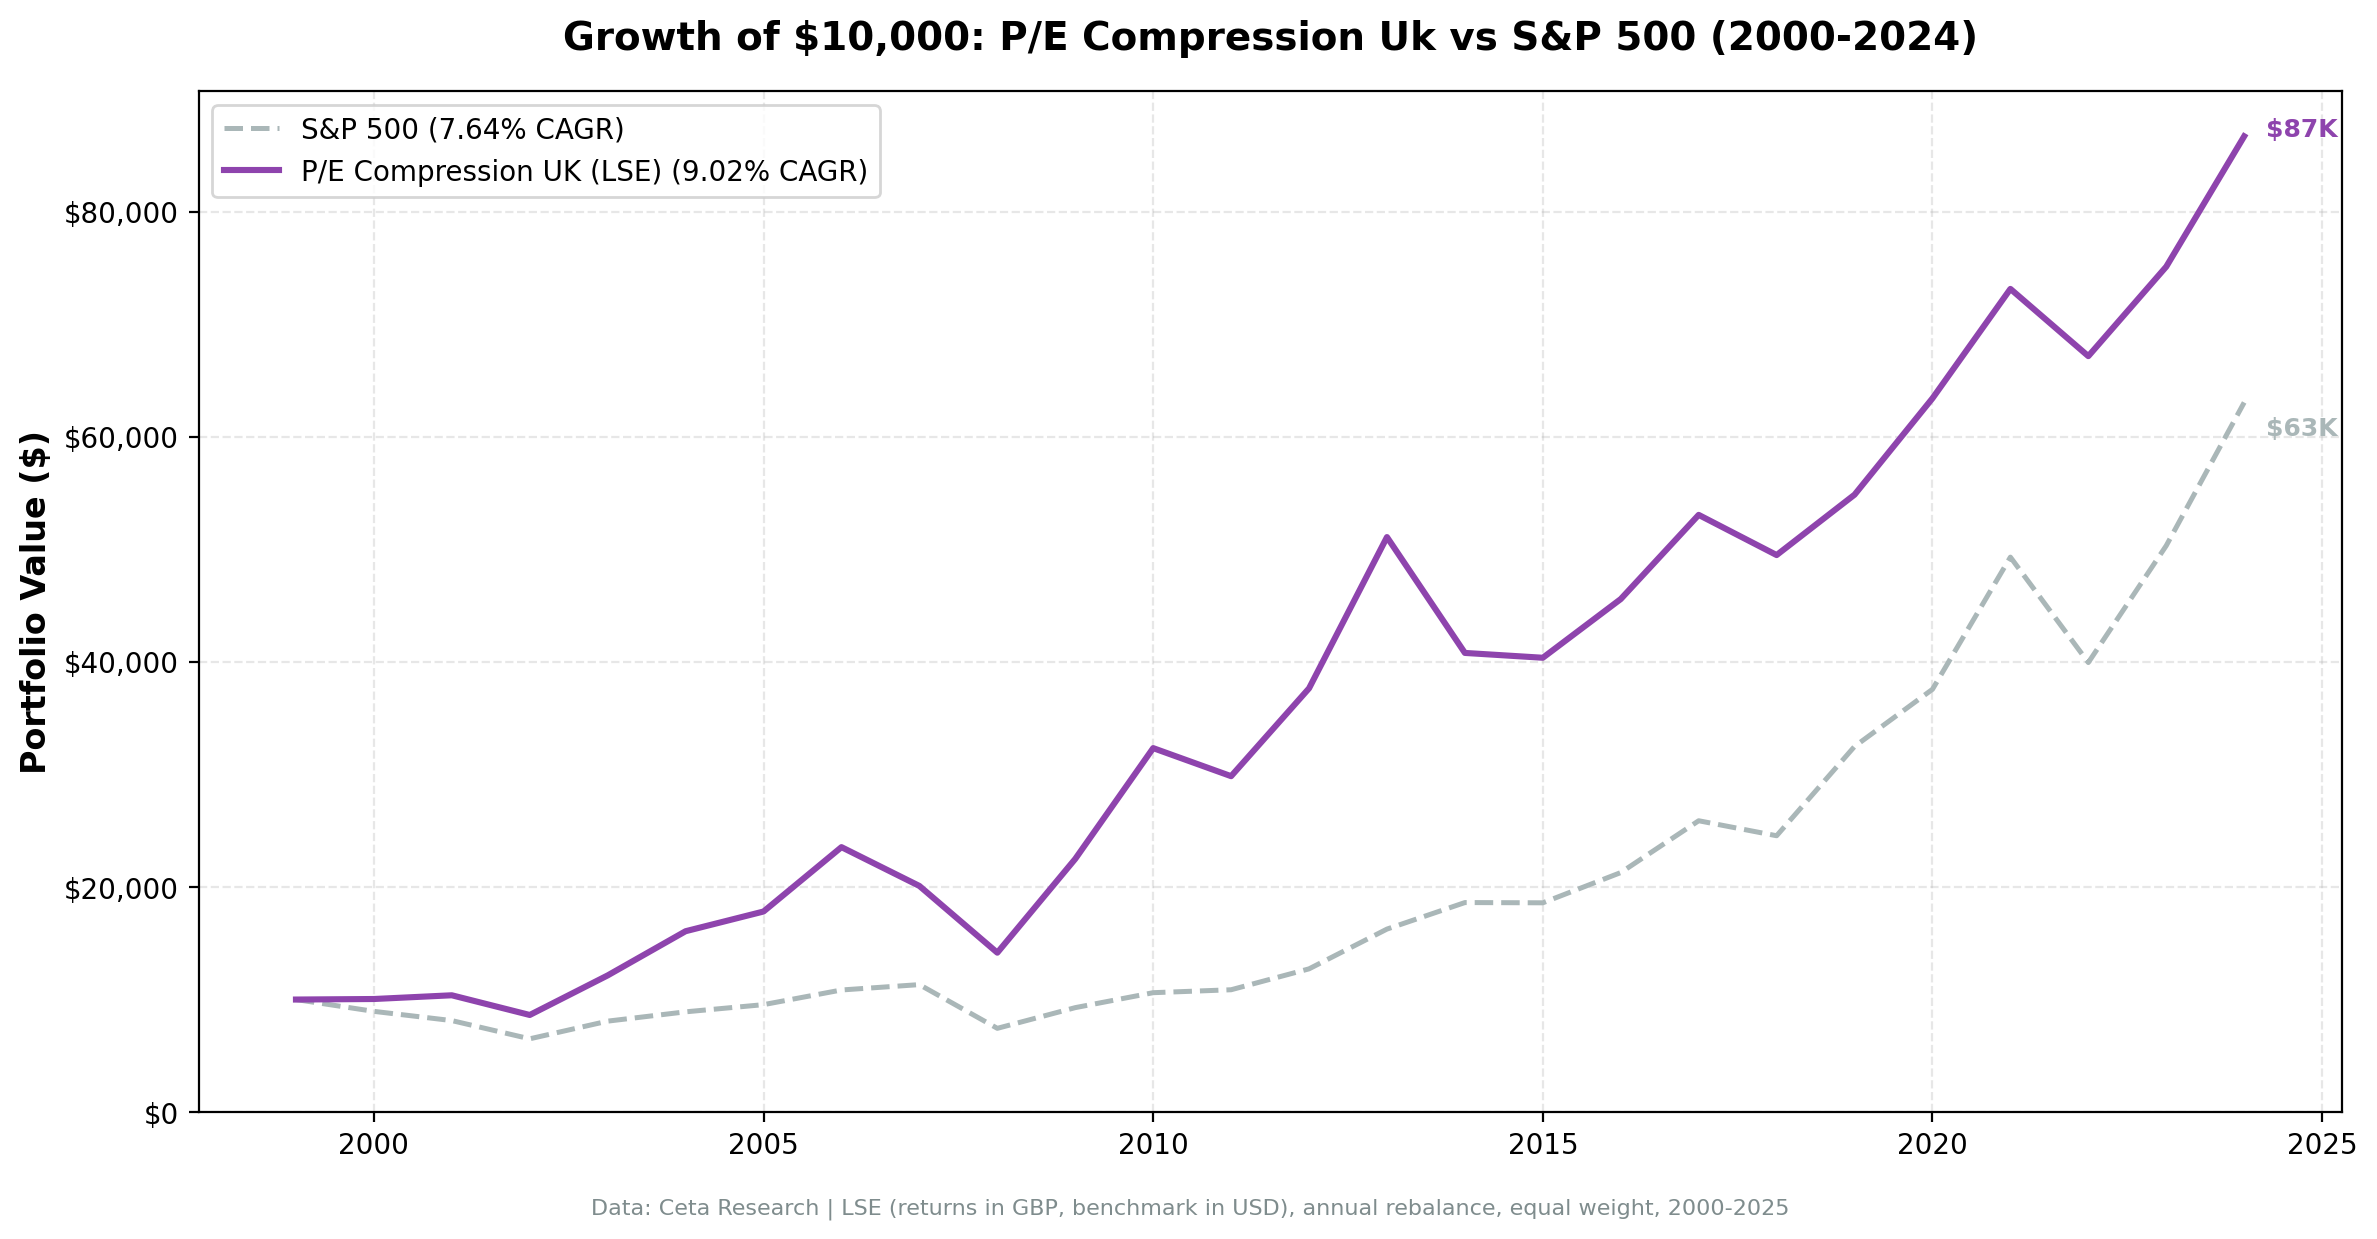
25 years. 1.38% annual alpha. Best-in-class downside protection.
| Metric | P/E Compression (UK) | S&P 500 (USD) |
|---|---|---|
| CAGR | 9.02% | 7.64% |
| Total Return | 767% | 531% |
| Sharpe Ratio | 0.253 | 0.322 |
| Max Drawdown | -39.85% | -34.90% |
| Up Capture | 102.87% | 100% |
| Down Capture | 59.66% | 100% |
| Avg Stocks per Year | 14.0 | - |
| Cash Periods | 0 of 25 | - |
The standout metric is the 60% down-capture. When SPY lost 10%, this portfolio lost 6%. That's exceptional downside protection for a value-oriented strategy. The trade-off is a lower Sharpe ratio (0.253 vs 0.322), driven partly by currency effects and the smaller, more concentrated universe (14 stocks on average vs 25 in the US).
The up-capture of 103% means the strategy matches SPY's gains without sacrificing participation. Combined with the defensive down-capture, this creates favorable asymmetry.
Year-by-year returns
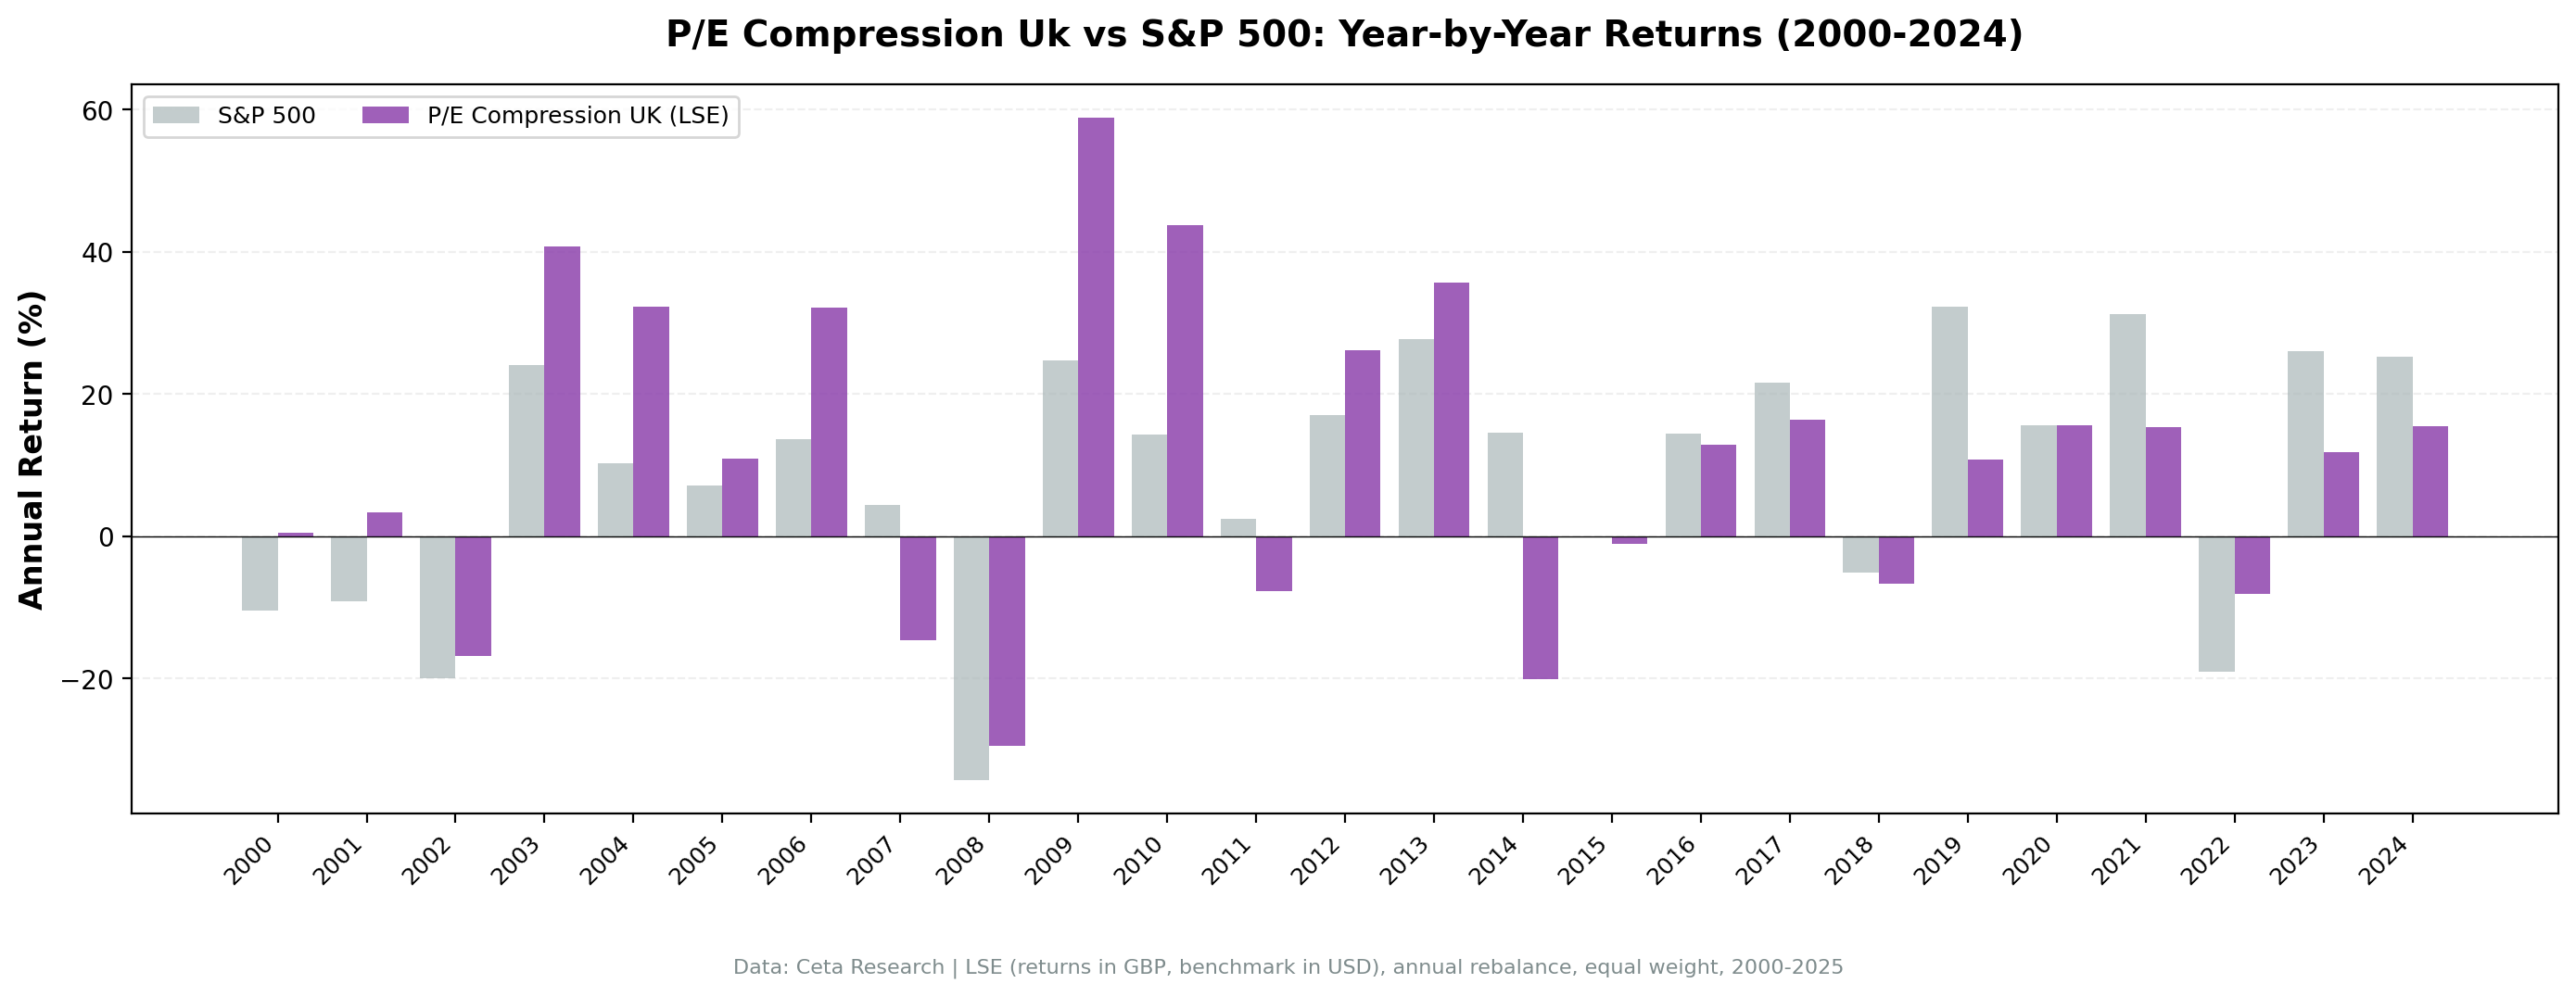
The UK strategy outperformed during the dot-com recovery (2003-2005) and value comeback periods (2016, 2022-2023), similar to the US. It underperformed during growth-dominated years but with smaller gaps than the US strategy, suggesting UK markets are less polarized between growth and value styles.
Why the UK works for P/E compression
Efficient price discovery. The LSE is a mature, liquid market. P/E compression signals genuine temporary undervaluation, not structural deterioration.
Defensive sectors well-represented. UK markets have strong exposure to healthcare, consumer staples, and utilities. These sectors experience P/E compression from temporary sentiment shifts, not earnings collapses, making them ideal for mean reversion.
Less growth dominance. The UK market has fewer extreme-multiple tech stocks compared to the US. This means growth-dominated years (2019, 2021) don't punish value strategies as severely.
Stable earnings. UK large caps are mature businesses with predictable cash flows. P/E compression driven by sentiment (not fundamentals) is more likely to revert.
Backtest Methodology
Full methodology documentation: backtests/METHODOLOGY.md
| Parameter | Choice |
|---|---|
| Universe | LSE, Market Cap > £500M |
| Signal | Current P/E < 85% of 5-year avg, P/E 5-40, ROE > 10%, D/E < 2.0 |
| Portfolio | Top 30 by lowest compression ratio, equal weight |
| Rebalancing | Annual (January) |
| Cash rule | Hold cash if < 10 qualify |
| Benchmark | S&P 500 Total Return (SPY, USD) |
| Period | 2000-2025 (25 years) |
| Returns | GBP-denominated (portfolio), USD (benchmark) |
| Transaction costs | 0.3% one-way (£500M-£5B market cap tier) |
Limitations
Smaller universe. 14 stocks on average vs 25 in the US creates concentration risk. Single-stock moves have larger portfolio impact.
Currency mismatch. Portfolio returns are in GBP, benchmark in USD. This comparison reflects a UK investor's experience but introduces FX volatility that's not present in a same-currency comparison.
Sector bias. Without sector constraints, the portfolio can cluster in financials, healthcare, or energy depending on which sectors experience compression.
Brexit impact not isolated. The 2016-2020 period includes Brexit uncertainty, which compressed many UK stocks' P/E ratios. The strategy benefited from this, but it's a one-time regime-specific event.
Conclusion
P/E compression works well in the UK, delivering 1.38% annual alpha with exceptional downside protection (60% down-capture). The defensive characteristics make this particularly appealing for risk-conscious investors.
The UK's mature market structure, efficient pricing, and strong defensive sector representation create an ideal environment for mean reversion strategies. Currency effects add complexity for international comparisons, but for UK-based investors, the strategy offers a compelling risk-reward profile.
Part of a Series: Global | US | UK | Thailand | Thailand | Switzerland | Switzerland | Japan
Run It Yourself
Explore the data behind this analysis on Ceta Research. Query our financial data warehouse with SQL, build custom screens, and run your own backtests across 70,000+ stocks on 20 exchanges.
Data: Ceta Research (FMP financial data warehouse). Returns in GBP. Past performance doesn't guarantee future results. See full methodology at github.com/ceta-research/backtests.


