
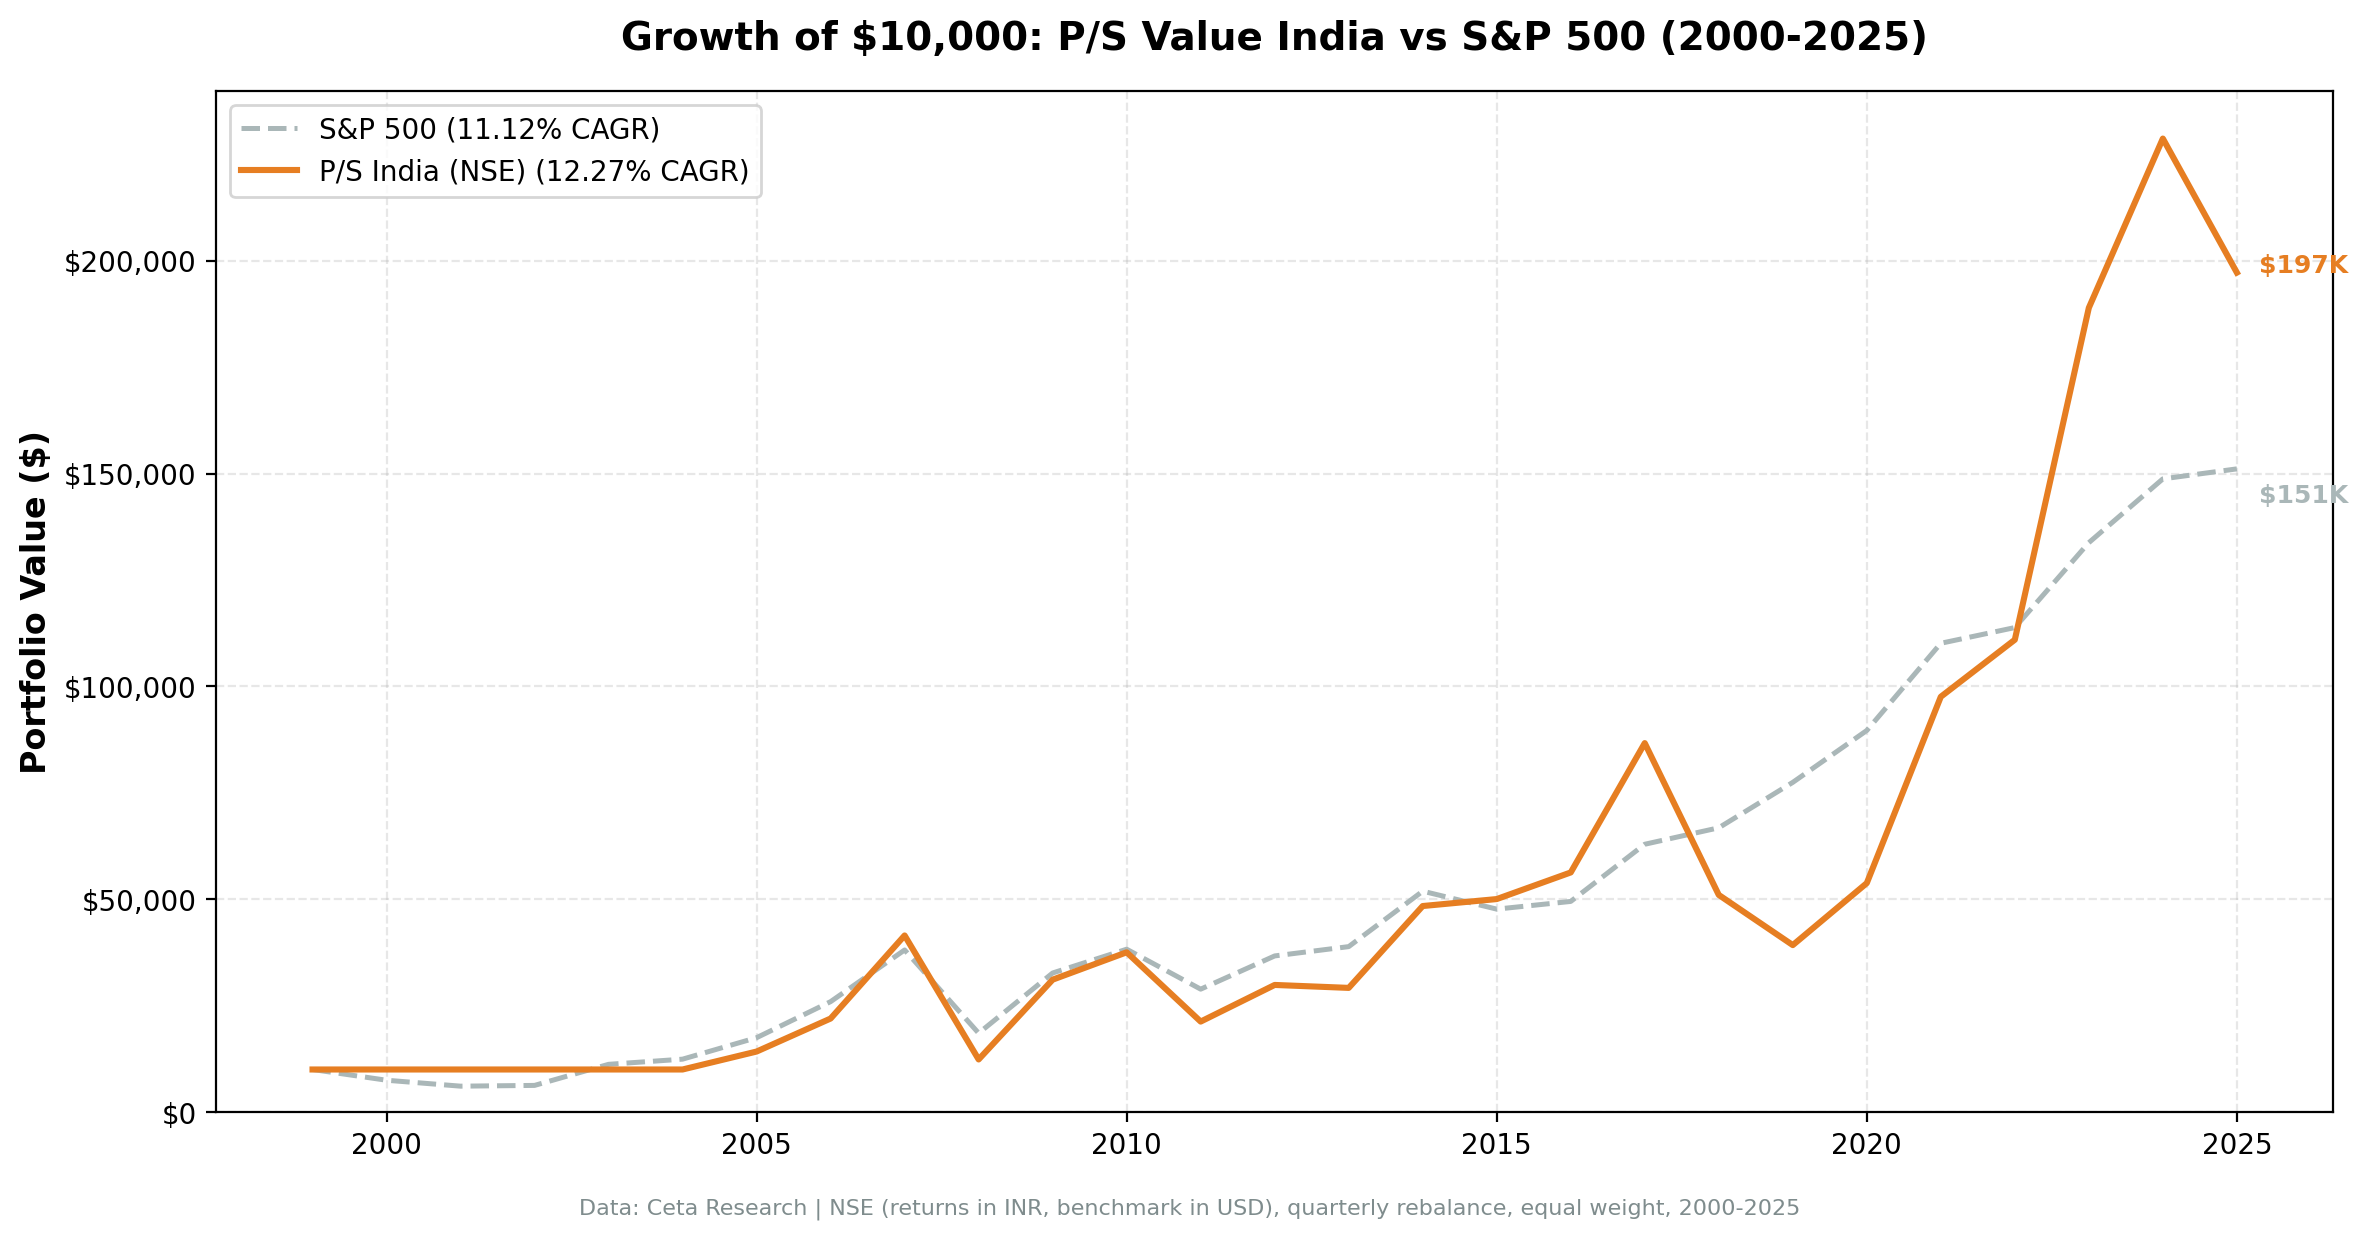
Price-to-Sales Below 1 in India: 12.27% CAGR on NSE, Narrow Edge Over the Sensex
A quality-filtered P/S value screen on NSE returned 12.27% CAGR from 2000 to 2025, against a Sensex that returned 11.12%. The strategy beats the local index by 1.15 percentage points. India's market itself rose strongly. The screen adds a modest, real edge on top.

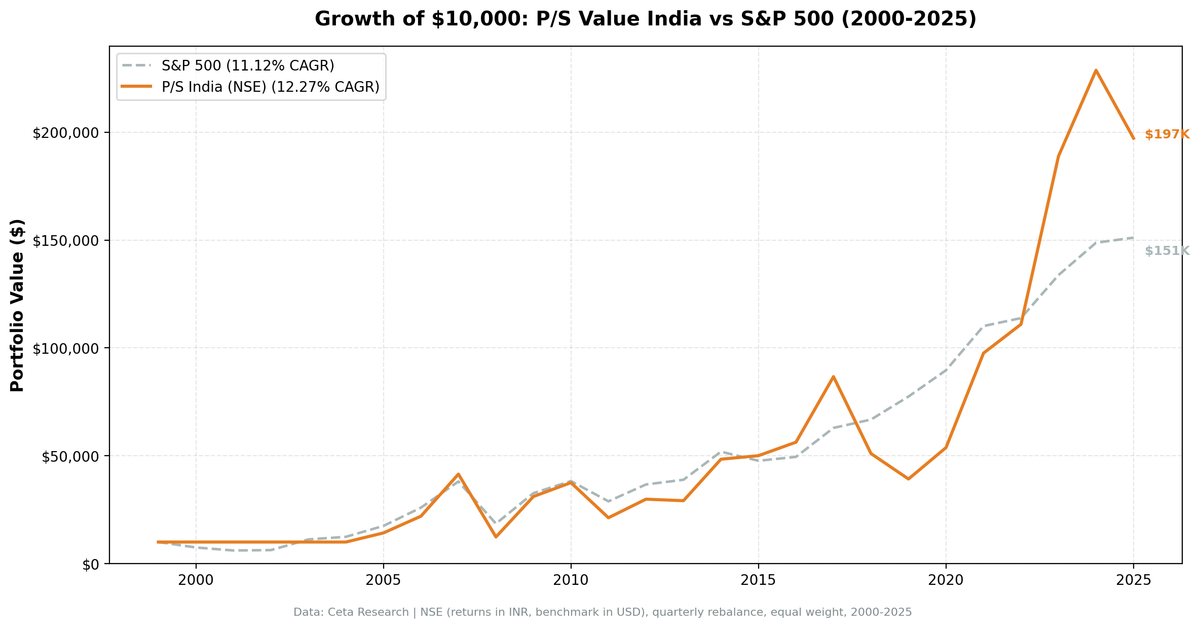
We ran a P/S value screen on NSE from 2000 to 2025. The strategy requires P/S below 1.0, gross margin above 20%, operating margin above 5%, and ROE above 10%, with the top 30 by lowest P/S selected each quarter. The result: 12.27% CAGR against a Sensex benchmark that returned 11.12%. The strategy beats the local index by 1.15 percentage points. India's bull market explains most of the return. The screen adds a modest, real edge on top.
Contents
- Method
- The Screen
- P/S Value Screen (SQL, India)
- What We Found
- 12.27% CAGR. Sensex at 11.12%. Excess of 1.15%.
- Year-by-year returns
- 2005-2007: the opening run
- 2008-2009: the crash and the bounce
- The recurring pattern: overshoot in both directions
- 2018-2019: the domestic credit crisis
- Win rate vs the Sensex
- Backtest Methodology
- Limitations
- Takeaway
- Part of a Series
- References
- Run This Screen Yourself
Data: FMP financial data warehouse, 2000–2025. Updated June 2026.
Method
Data source: Ceta Research (FMP financial data warehouse) Universe: NSE only, market cap > ₹20B INR (approximately $240M USD) Period: 2000-2025 (25 years, 103 quarterly periods; first qualifying stocks appear in 2005) Rebalancing: Quarterly (January, April, July, October), equal weight, top 30 by lowest P/S Benchmark: Sensex (BSE 30 index), INR terms Cash rule: Hold cash if fewer than 10 stocks qualify Execution: Next-bar entry at close (MOC), 45-day lag on FY financial statements, data-quality guards remove price-oscillation artifacts and cap single-period returns at 200%.
BSE was removed from the universe because 38% of stocks are dual-listed on both exchanges. Including both would double-count those positions and inflate returns. NSE is the larger, more liquid exchange and the cleaner dataset.
Returns are in INR terms.
The Screen
The same four-filter screen as the US version, adjusted for the Indian market cap threshold.
Valuation:
| Criterion | Metric | Threshold |
|---|---|---|
| Cheap on sales | Price-to-Sales (FY) | < 1.0 |
Quality Filters:
| Criterion | Metric | Threshold |
|---|---|---|
| Margin quality | Gross Margin | > 20% |
| Operational efficiency | Operating Margin | > 5% |
| Capital returns | Return on Equity | > 10% |
Size:
| Criterion | Metric | Threshold |
|---|---|---|
| Mid-cap and above | Market Cap | > ₹20B INR |
The ₹20B threshold targets the mid-cap and large-cap segment where FMP data coverage is reliable. At current exchange rates it's roughly $240M USD, capturing a different size tier than the US screen's $1B USD cutoff. This matters for interpretation: the Indian screen includes smaller companies with more room to re-rate.
P/S Value Screen (SQL, India)
SELECT
    f.symbol,
    p.companyName,
    p.exchange,
    p.sector,
    ROUND(f.priceToSalesRatioTTM, 3) AS ps_ratio,
    ROUND(f.grossProfitMarginTTM * 100, 1) AS gross_margin_pct,
    ROUND(f.operatingProfitMarginTTM * 100, 1) AS op_margin_pct,
    ROUND(k.returnOnEquityTTM * 100, 1) AS roe_pct,
    ROUND(k.marketCap / 1e9, 2) AS mktcap_b
FROM financial_ratios_ttm f
JOIN key_metrics_ttm k ON f.symbol = k.symbol
JOIN profile p ON f.symbol = p.symbol
WHERE f.priceToSalesRatioTTM > 0
  AND f.priceToSalesRatioTTM < 1
  AND f.grossProfitMarginTTM > 0.20
  AND f.operatingProfitMarginTTM > 0.05
  AND k.returnOnEquityTTM > 0.10
  AND k.marketCap > 20000000000
  AND p.exchange IN ('BSE', 'NSE')
QUALIFY ROW_NUMBER() OVER (PARTITION BY f.symbol ORDER BY f.priceToSalesRatioTTM ASC) = 1
ORDER BY f.priceToSalesRatioTTM ASC
LIMIT 30
Run this query on Ceta Research
What We Found
12.27% CAGR. Sensex at 11.12%. Excess of 1.15%.
| Metric | P/S Screen (NSE) | Sensex |
|---|---|---|
| CAGR | 12.27% | 11.12% |
| Excess Return | +1.15% | - |
| Sharpe Ratio | 0.156 | - |
| Max Drawdown | -75.69% | - |
| Avg Stocks per Period | 26.8 (when invested) | - |
| Cash Periods | 22 of 103 | - |
The Sensex itself compounded at 11.12% over this period. The strategy added 1.15% on top. That's the honest headline. A Sharpe of 0.156 is weak, meaning you're taking on substantial volatility for returns barely above the index. The risk-adjusted case is hard to make against simply buying an index fund.
The cash periods (22 of 103) are concentrated in 2000-2004. FY financial data for Indian companies didn't arrive in sufficient volume until 2005, so the early quarters show no qualifying stocks. The effective investment period is roughly 20 years. The 12.27% CAGR is computed over the full 25-year window including those cash years.
India's risk-free rate runs around 6.5% (10-year government bond yield). The strategy clears that threshold. But it clears the Sensex by only 1.15%, and it does so with a max drawdown of -75.69%.
Year-by-year returns
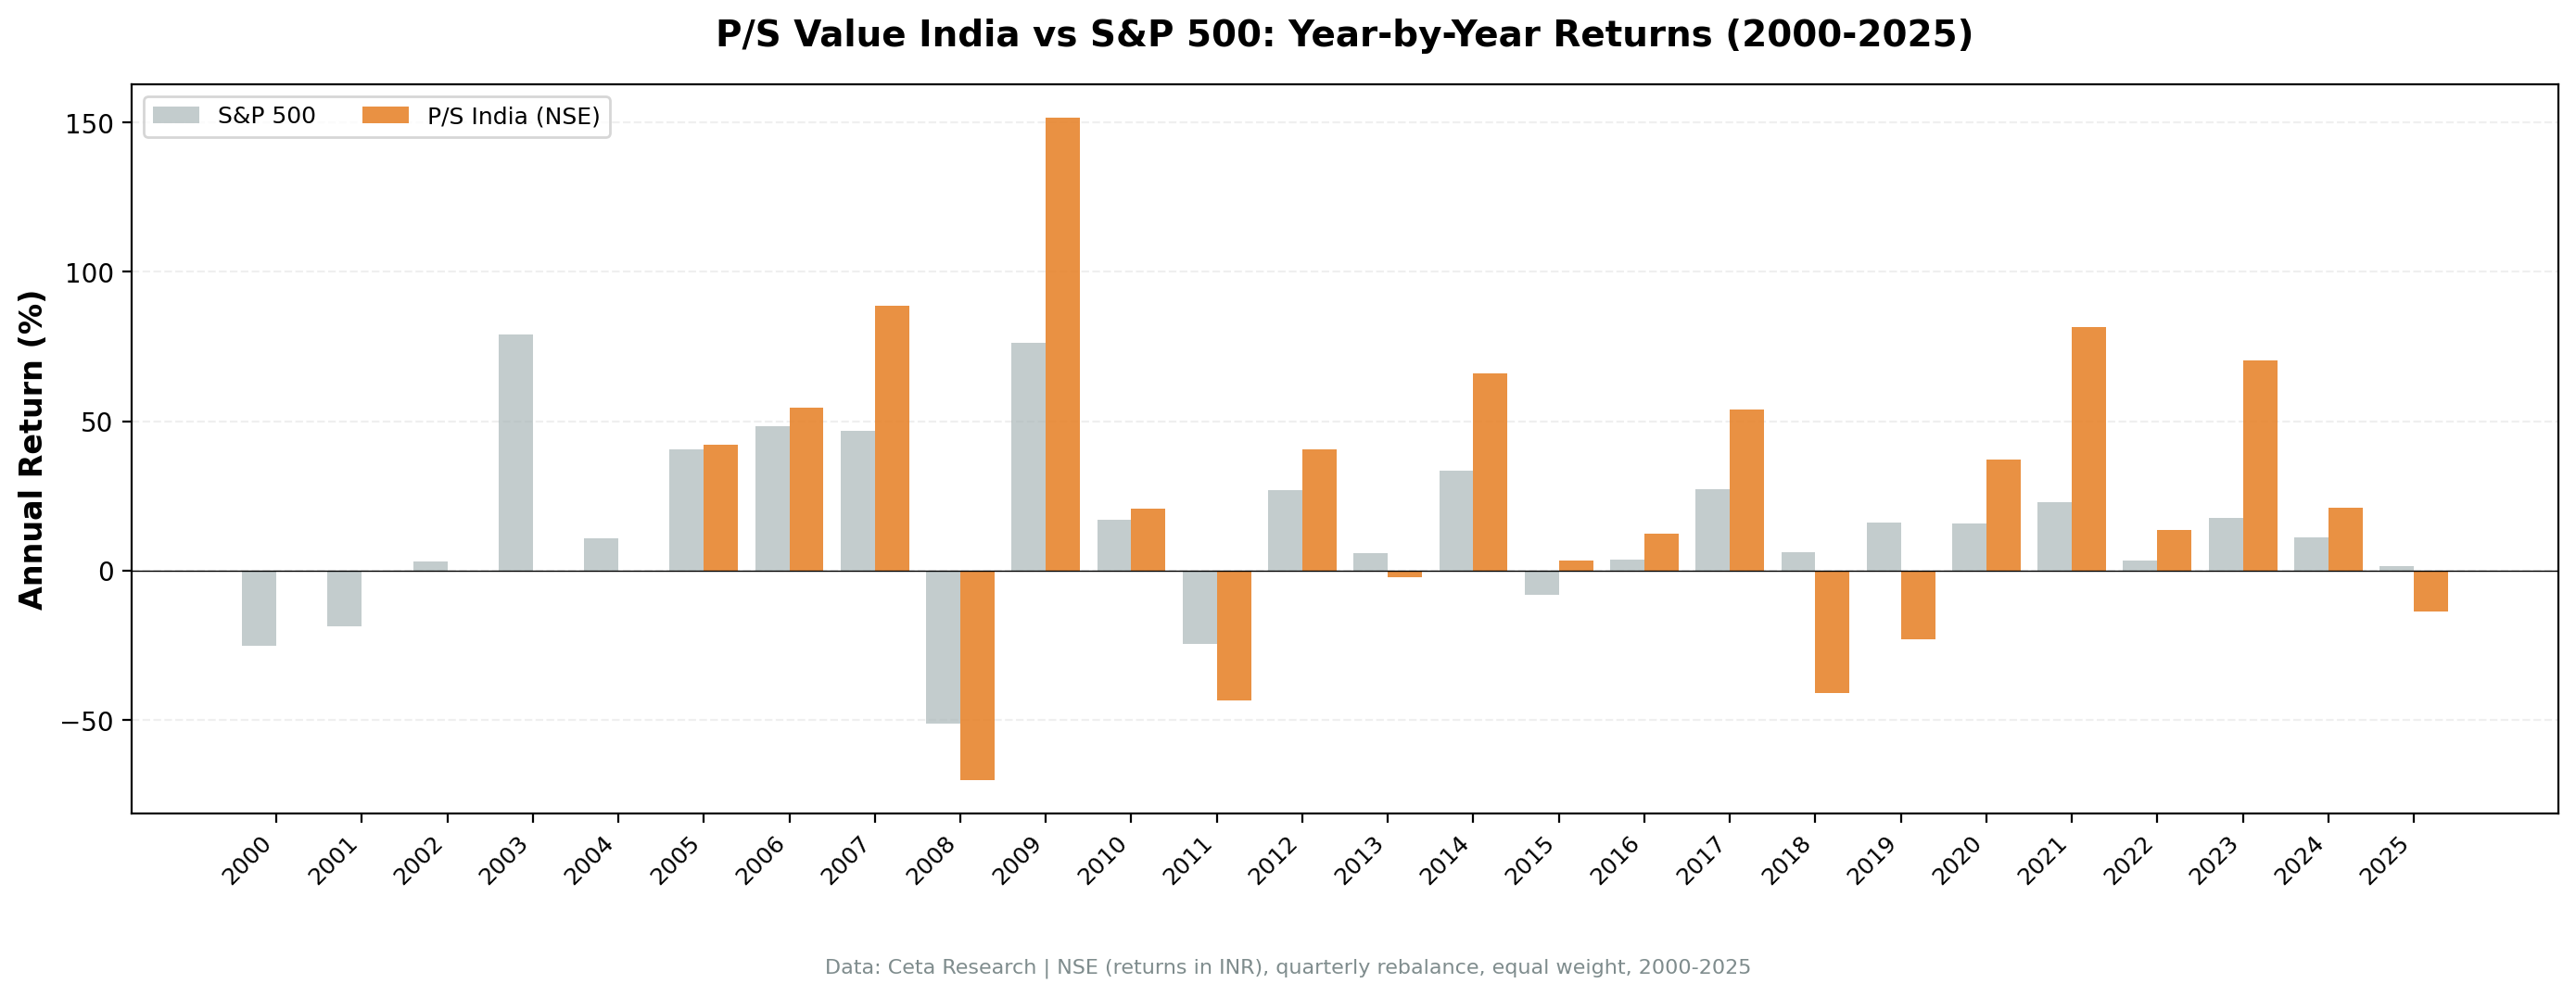
| Year | P/S Screen (NSE) | Sensex | Excess |
|---|---|---|---|
| 2000 | 0.0% (cash) | -25.23% | - |
| 2001 | 0.0% (cash) | -18.65% | - |
| 2002 | 0.0% (cash) | +2.93% | - |
| 2003 | 0.0% (cash) | +79.09% | - |
| 2004 | 0.0% (cash) | +10.83% | - |
| 2005 | +42.17% | +40.59% | +1.58% |
| 2006 | +54.55% | +48.48% | +6.07% |
| 2007 | +88.81% | +46.79% | +42.02% |
| 2008 | -70.21% | -51.34% | -18.87% |
| 2009 | +151.66% | +76.32% | +75.34% |
| 2010 | +20.67% | +17.10% | +3.57% |
| 2011 | -43.36% | -24.53% | -18.84% |
| 2012 | +40.48% | +27.04% | +13.43% |
| 2013 | -2.32% | +5.96% | -8.28% |
| 2014 | +65.93% | +33.51% | +32.42% |
| 2015 | +3.38% | -8.12% | +11.50% |
| 2016 | +12.50% | +3.79% | +8.70% |
| 2017 | +53.98% | +27.14% | +26.84% |
| 2018 | -41.15% | +6.15% | -47.30% |
| 2019 | -23.11% | +15.98% | -39.09% |
| 2020 | +37.13% | +15.74% | +21.39% |
| 2021 | +81.40% | +22.85% | +58.55% |
| 2022 | +13.73% | +3.35% | +10.38% |
| 2023 | +70.27% | +17.53% | +52.74% |
| 2024 | +21.05% | +11.20% | +9.85% |
| 2025 | -13.77% | +1.58% | -15.35% |
2005-2007: the opening run
The first three years of active investment were strong. The screen captured India's mid-cap expansion in the pre-crisis boom. Companies with P/S below 1 and decent margins re-rated sharply as the Sensex climbed. The 2007 return of +88.81% reflects concentrated exposure to stocks that nearly doubled in a single year. The Sensex itself gained 46.79% that year, so the screen did add value. But the starting point was a bull market doing most of the heavy lifting.
2008-2009: the crash and the bounce
2008 was the defining risk event: -70.21%, against the Sensex at -51.34%. Indian mid-cap stocks with illiquid ownership structures collapsed further than the large-cap Sensex during the global credit freeze. Quality filters don't protect against a market-wide liquidity crisis.
2009 reversed it: +151.66%, against the Sensex at +76.32%. If you held through 2008, the recovery looked complete within the year. But the practical challenge is that a -70% drawdown is severe enough to force selling at the worst moment for many investors.
The recurring pattern: overshoot in both directions
| Cycle | Strong years | Crash | Recovery |
|---|---|---|---|
| 2005-2007 / 2008 / 2009 | +42% to +89% per year | -70.21% | +151.66% |
| 2012-2017 | +40% to +66% in good years | 2018: -41.15%, 2019: -23.11% | 2020-2023 run |
| 2020-2023 / 2025 | +37% to +81% per year | -13.77% (2025) | TBD |
The strategy overshoots on both sides relative to the Sensex. Strong years are genuinely strong. Bad years are worse than the index. The long-run compounding produces a result narrowly above the benchmark because losses in bad years erode the gains from good ones.
2018-2019: the domestic credit crisis
Two consecutive years of underperformance vs the Sensex: -41.15% in 2018 (Sensex +6.15%), -23.11% in 2019 (Sensex +15.98%). That's a two-year period where the strategy lost roughly 55% while the Sensex gained 23.3%. The IL&FS collapse triggered a domestic credit crunch that hit mid-cap and small-cap stocks disproportionately. Quality filters didn't help. The companies that passed the screen still saw their prices fall sharply when liquidity dried up across the market.
Win rate vs the Sensex
The strategy beats the Sensex in 55.3% of periods where it was invested. That's slightly better than a coin flip. It doesn't mean the strategy is useless. It does mean the outperformance is concentrated in a handful of exceptional years (2007, 2009, 2014, 2021, 2023) rather than consistent quarterly edge.
Backtest Methodology
| Parameter | Choice |
|---|---|
| Universe | NSE only, Market Cap > ₹20B INR |
| Signal | P/S < 1.0, Gross Margin > 20%, Op. Margin > 5%, ROE > 10% |
| Portfolio | Top 30 by lowest P/S, equal weight |
| Rebalancing | Quarterly (January, April, July, October) |
| Cash rule | Hold cash if < 10 qualify |
| Benchmark | Sensex (BSE 30 index) |
| Period | 2000-2025 (25 years, 103 quarterly periods) |
| Execution | Next-bar (MOC), 45-day lag on FY data, data-quality guards |
| Returns | INR terms |
Limitations
Extreme drawdown risk. -75.69% max drawdown. Investors need to hold conviction through crashes of that magnitude. Most won't.
Weak Sharpe ratio. 0.156 means the risk-adjusted case is poor. The screen narrowly beats the Sensex on raw return and does so with far more volatility. An index fund is the simpler alternative.
Currency risk. Returns are in INR. USD-based investors face additional FX exposure. The INR has depreciated against the USD over this period, which would reduce returns in USD terms.
Cash drag in early years. Twenty-two cash periods, mostly 2000-2004, reflect data availability rather than any signal. The strategy missed the Sensex's 79.09% gain in 2003 entirely due to insufficient coverage.
Survivorship bias. Exchange membership uses current profiles, not historical. Delistings and corporate failures are not tracked over time.
Transaction costs not included. Indian mid-cap stocks can carry higher bid-ask spreads than US large-caps. Quarterly rebalancing of 30 names at 0.3-0.8% one-way transaction costs is approximately 0.8-2.0% annual drag depending on portfolio size and execution quality.
Data coverage. FMP's Indian data depth improves substantially after 2005. The early backtest years may have coverage gaps that affect stock selection at the margin.
BSE excluded. The live screen SQL above shows IN ('BSE', 'NSE') for practical use. The backtest uses NSE only to avoid double-counting the 38% of stocks dual-listed on both exchanges.
Takeaway
The headline of the old BSE+NSE analysis was 15.53% CAGR vs SPY's 8.01%. That looked impressive. The problem was the benchmark. Comparing Indian stocks to the S&P 500 in USD terms mixes currency movements and different economic cycles. When you measure against the Sensex in INR terms, the picture changes.
NSE-only P/S screen: 12.27% CAGR. Sensex: 11.12% CAGR. The strategy adds 1.15%.
The quality filters (gross margin > 20%, operating margin > 5%, ROE > 10%) do real work. They exclude pass-through traders, commodity middlemen, and capital-light distribution businesses with structurally thin margins. The universe of profitable, asset-light NSE companies with P/S below 1 does exist. But after 20 years, that selection produces returns narrowly above the index.
India's bull market is the story. The Sensex itself compounded at 11.12% over this period, one of the stronger long-run returns of any major market. Beating that benchmark by 1.15 percentage points is real but not overwhelming.
If you're investing in India for the long run, a Sensex or Nifty 50 index fund captures most of the return at far lower drawdown risk. The P/S screen reduces diversification, adds volatility, increases drawdown, and delivers a thin excess on top.
Part of a Series
This analysis is part of our global P/S value screen comparison. We tested the same screen across 15 exchanges worldwide: - P/S Value Screen on US Stocks (NYSE + NASDAQ + AMEX) - 11.66% CAGR, the flagship analysis - P/S Value Screen on Swedish Stocks (STO) - 10.96% CAGR, +7.79% vs OMX, Sharpe 0.452 (best globally) - P/S Value Screen on German Stocks (XETRA) - 8.13% CAGR, +3.01% vs DAX - P/S Value Screen on Canadian Stocks (TSX) - 8.42% CAGR, +3.33% vs TSX Comp - P/S Value Screen on Japanese Stocks (JPX) - 7.71% CAGR, +4.31% vs Nikkei - P/S Value Screen on South African Stocks (JNB) - 6.24% CAGR, -1.77% vs SPY - P/S Value Screen: Global Exchange Comparison
References
- Fisher, K. (1984). Super Stocks. Dow Jones-Irwin.
- Barbee, W., Mukherji, S. & Raines, G. (1996). "Do Sales-Price and Debt-Equity Explain Stock Returns Better than Book-Market and Firm Size?" Financial Analysts Journal, 52(2), 56-60.
- Gray, W. & Vogel, J. (2012). "Analyzing Valuation Measures: A Performance Horse-Race over the Past 40 Years." Journal of Portfolio Management, 39(1), 112-121.
- Novy-Marx, R. (2013). "The Other Side of Value: The Gross Profitability Premium." Journal of Financial Economics, 108(1), 1-28.
Run This Screen Yourself
Via web UI: Run the India P/S value screen on Ceta Research. The query is pre-loaded. Hit "Run" and see what qualifies today.
Via Python:
import requests, time

API_KEY = "your_api_key"  # get one at cetaresearch.com
BASE = "https://tradingstudio.finance/api/v1"

resp = requests.post(f"{BASE}/data-explorer/execute", headers={
    "X-API-Key": API_KEY, "Content-Type": "application/json"
}, json={
    "query": """
        SELECT f.symbol, p.companyName, p.sector,
            ROUND(f.priceToSalesRatioTTM, 3) AS ps_ratio,
            ROUND(f.grossProfitMarginTTM * 100, 1) AS gross_margin_pct,
            ROUND(f.operatingProfitMarginTTM * 100, 1) AS op_margin_pct,
            ROUND(k.returnOnEquityTTM * 100, 1) AS roe_pct,
            ROUND(k.marketCap / 1e9, 2) AS mktcap_b
        FROM financial_ratios_ttm f
        JOIN key_metrics_ttm k ON f.symbol = k.symbol
        JOIN profile p ON f.symbol = p.symbol
        WHERE f.priceToSalesRatioTTM > 0
          AND f.priceToSalesRatioTTM < 1
          AND f.grossProfitMarginTTM > 0.20
          AND f.operatingProfitMarginTTM > 0.05
          AND k.returnOnEquityTTM > 0.10
          AND k.marketCap > 20000000000
          AND p.exchange IN ('NSE')
        QUALIFY ROW_NUMBER() OVER (PARTITION BY f.symbol ORDER BY f.priceToSalesRatioTTM ASC) = 1
        ORDER BY f.priceToSalesRatioTTM ASC
        LIMIT 30
    """,
    "options": {"format": "json", "limit": 100}
})
task_id = resp.json()["taskId"]

while True:
    result = requests.get(f"{BASE}/tasks/data-query/{task_id}",
                          headers={"X-API-Key": API_KEY}).json()
    if result["status"] in ("completed", "failed"):
        break
    time.sleep(2)

for r in result["result"]["rows"][:10]:
    print(f"{r['symbol']:12s} P/S={r['ps_ratio']:.3f} GM={r['gross_margin_pct']:.1f}% ROE={r['roe_pct']:.1f}%")
Get your API key at cetaresearch.com. The full backtest code (Python + DuckDB) is on GitHub.
Data: Ceta Research, FMP financial data warehouse. Universe: NSE only. Returns in INR. Quarterly rebalance, equal weight, MOC execution with data-quality guards. 2000-2025.
Past performance does not guarantee future results. This is educational content, not investment advice.


