
Price-to-Sales Below 1: A Quality-Filtered Value Screen on 25 Years of US Stock Data
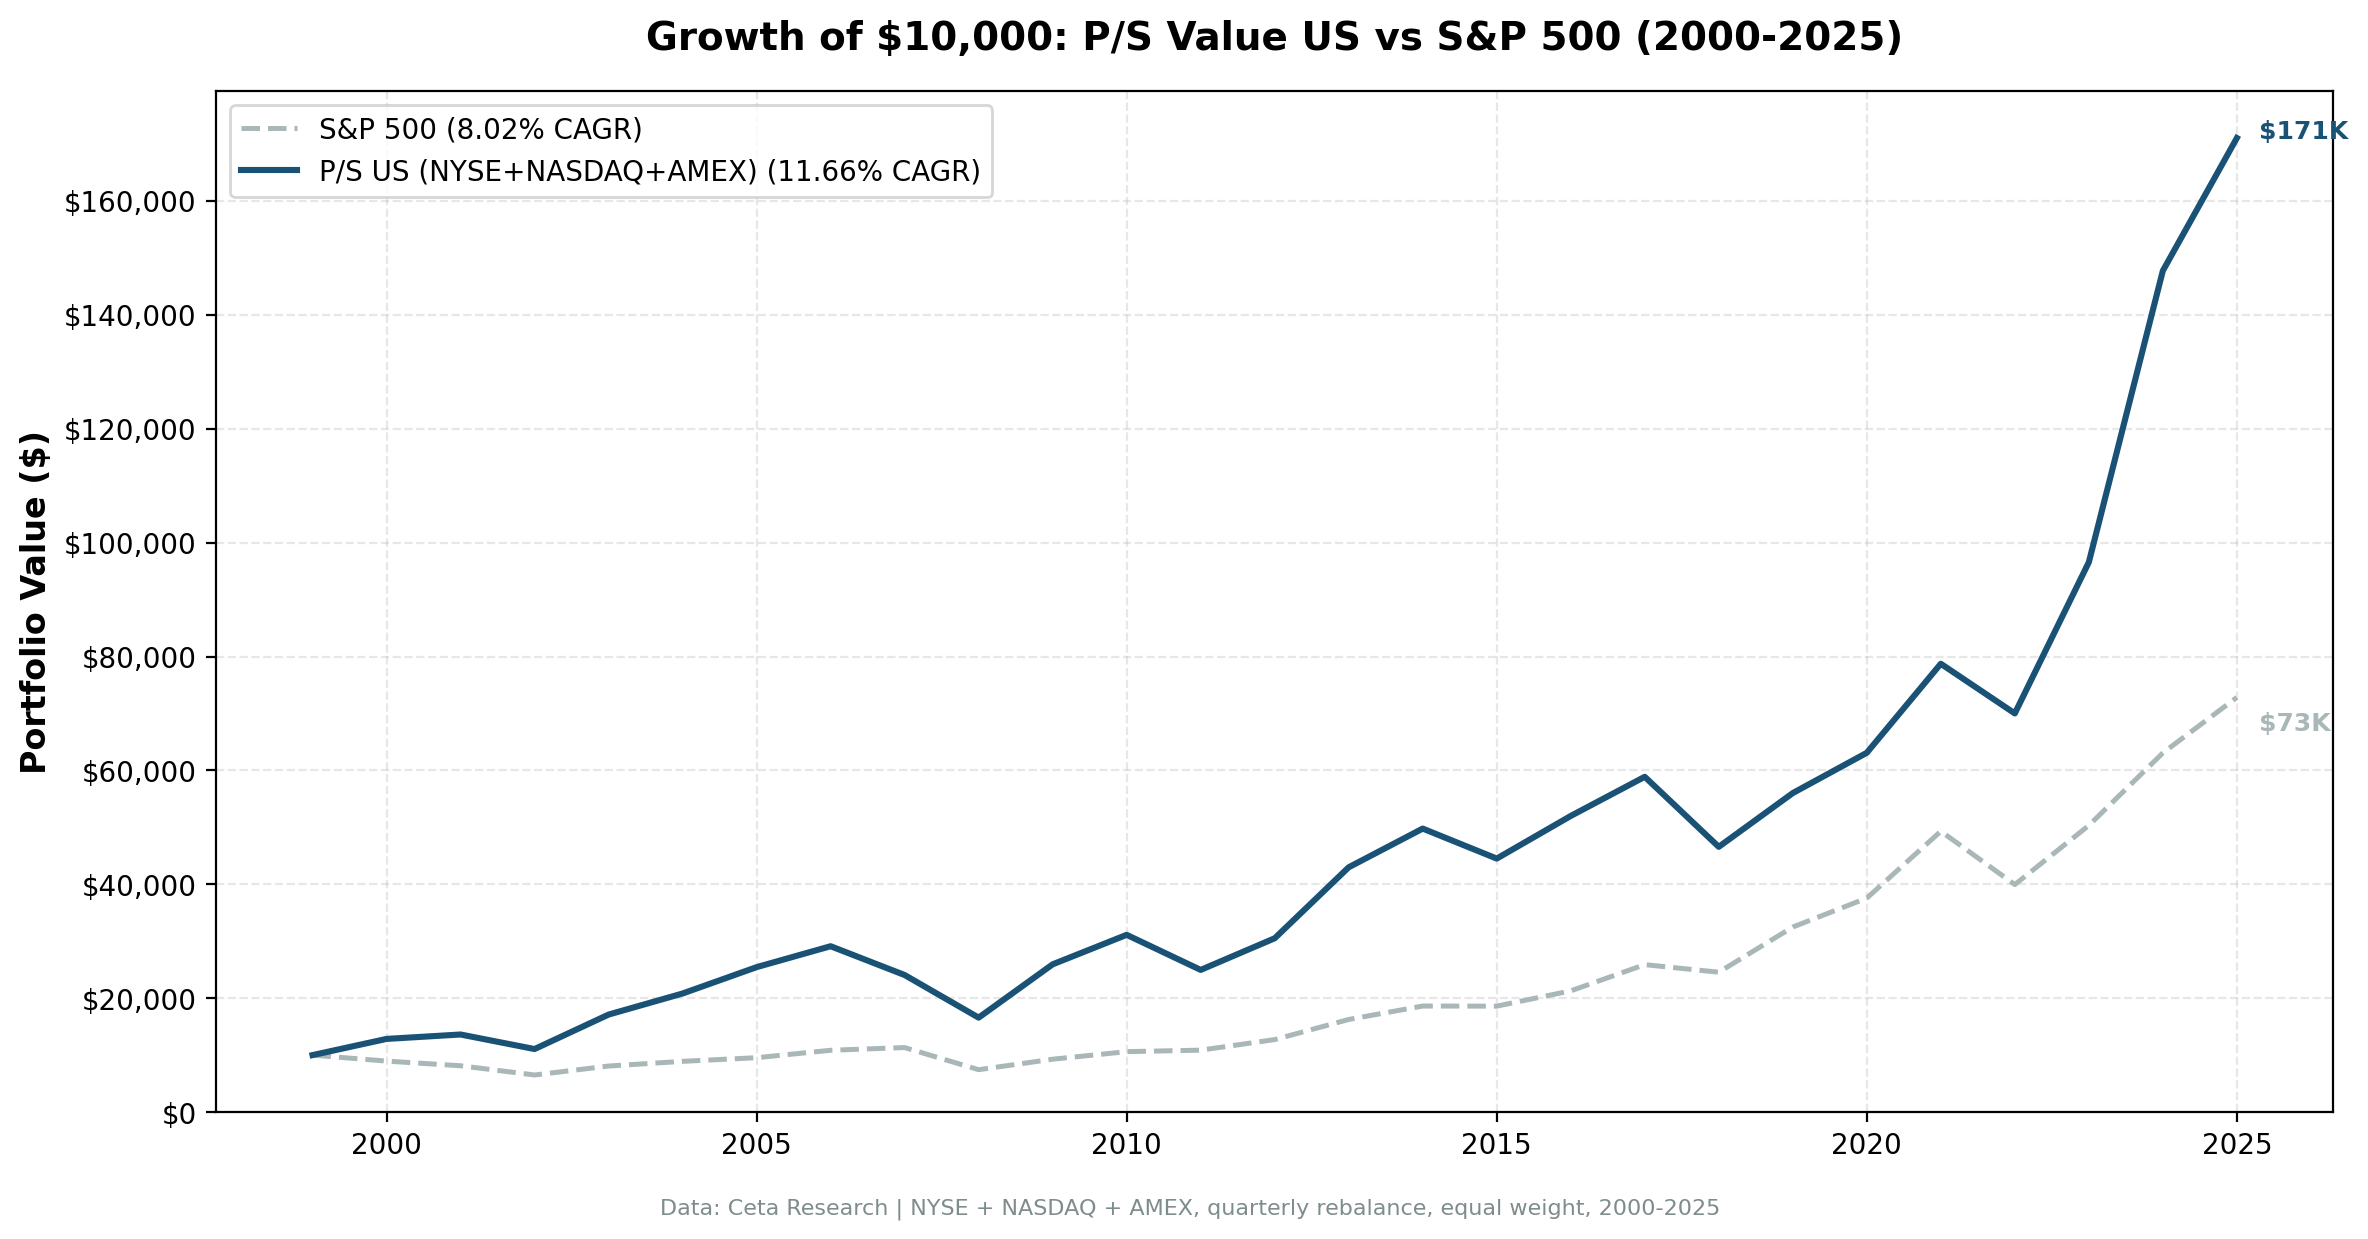
We ran a P/S value screen on NYSE, NASDAQ, and AMEX from 2000 to 2025 requiring P/S below 1.0, gross margin above 20%, operating margin above 5%, and ROE above 10%. The strategy returned 11.66% annually vs 8.02% for the S&P 500.

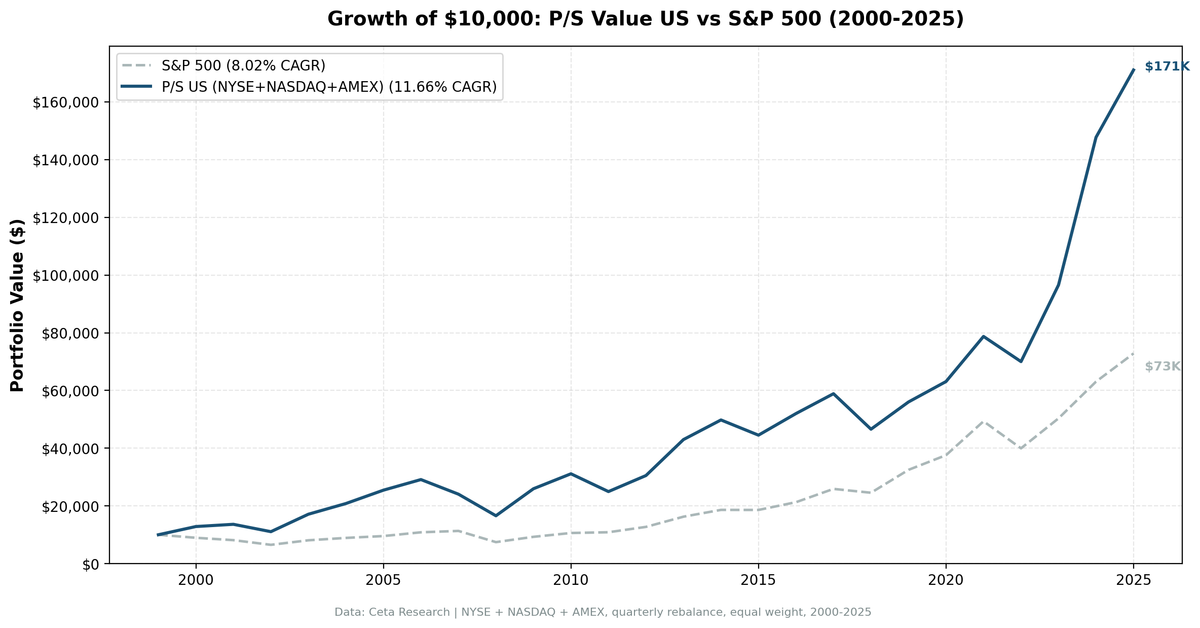
We ran a P/S value screen on NYSE, NASDAQ, and AMEX from 2000 to 2025. The strategy requires P/S below 1.0, gross margin above 20%, operating margin above 5%, and ROE above 10%. It returned 11.66% annually vs 8.02% for the S&P 500, with zero cash periods across 25 years and an average of 22.1 stocks per quarter.
Contents
- Method
- What Is the P/S Screen?
- The Screen
- P/S Value Screen (SQL)
- What We Found
- 25 years. 3.64% annual alpha. Stronger Sharpe than SPY.
- Year-by-year returns
- 2000-2005: the strategy's best period
- Crisis comparison
- 2017-2019: where the strategy lost ground
- 2022-2024: value makes its return
- Backtest Methodology
- Limitations
- Takeaway
- Part of a Series
- References
- Run This Screen Yourself
Data: FMP financial data warehouse, 2000–2025. Updated June 2026.
Method
Data source: Ceta Research (FMP financial data warehouse) Universe: NYSE + NASDAQ + AMEX, market cap > $1B USD Period: 2000-2025 (25 years, 103 quarterly periods) Rebalancing: Quarterly (January, April, July, October), equal weight, top 30 by lowest P/S Benchmark: S&P 500 Total Return (SPY) Cash rule: Hold cash if fewer than 10 stocks qualify Execution: Next-bar entry at close (MOC), 45-day lag on FY financial statements, data-quality guards remove price-oscillation artifacts and cap single-period returns at 200%.
Financial data sourced from financial_ratios (FY) for P/S ratio and margins, key_metrics (FY) for ROE and market cap.
What Is the P/S Screen?
Price-to-sales divides a company's market cap by its annual revenue. A ratio below 1.0 means you're paying less than $1 for every $1 of sales the business generates. Kenneth Fisher popularized P/S as a valuation metric in Super Stocks (1984), arguing it was a cleaner signal than P/E because revenue is harder to manipulate than earnings.
The screen doesn't stop at P/S < 1.0. Without quality filters, that criterion alone fills the portfolio with grocery chains, fuel distributors, and commodity traders, all of which run thin margins by design. The quality gates change the character of what qualifies.
Valuation:
| Criterion | Metric | Threshold |
|---|---|---|
| Cheap on sales | Price-to-Sales (FY) | < 1.0 |
Quality Filters:
| Criterion | Metric | Threshold |
|---|---|---|
| Margin quality | Gross Margin | > 20% |
| Operational efficiency | Operating Margin | > 5% |
| Capital returns | Return on Equity | > 10% |
Size:
| Criterion | Metric | Threshold |
|---|---|---|
| Institutional grade | Market Cap | > $1B USD |
Stocks must pass all four to enter. The top 30 by lowest P/S ratio are selected each quarter, equal weighted.
The Screen
P/S Value Screen (SQL)
SELECT
    f.symbol,
    p.companyName,
    p.exchange,
    p.sector,
    ROUND(f.priceToSalesRatioTTM, 3) AS ps_ratio,
    ROUND(f.grossProfitMarginTTM * 100, 1) AS gross_margin_pct,
    ROUND(f.operatingProfitMarginTTM * 100, 1) AS op_margin_pct,
    ROUND(k.returnOnEquityTTM * 100, 1) AS roe_pct,
    ROUND(k.marketCap / 1e9, 2) AS mktcap_b
FROM financial_ratios_ttm f
JOIN key_metrics_ttm k ON f.symbol = k.symbol
JOIN profile p ON f.symbol = p.symbol
WHERE f.priceToSalesRatioTTM > 0
  AND f.priceToSalesRatioTTM < 1
  AND f.grossProfitMarginTTM > 0.20
  AND f.operatingProfitMarginTTM > 0.05
  AND k.returnOnEquityTTM > 0.10
  AND k.marketCap > 1000000000
  AND p.exchange IN ('NYSE', 'NASDAQ', 'AMEX')
QUALIFY ROW_NUMBER() OVER (PARTITION BY f.symbol ORDER BY f.priceToSalesRatioTTM ASC) = 1
ORDER BY f.priceToSalesRatioTTM ASC
LIMIT 30
Run this query on Ceta Research
What We Found
25 years. 3.64% annual alpha. Stronger Sharpe than SPY.
| Metric | P/S Screen (US) | S&P 500 |
|---|---|---|
| CAGR | 11.66% | 8.02% |
| Sharpe Ratio | 0.404 | 0.361 |
| Max Drawdown | -52.48% | -43.86% |
| Avg Stocks per Period | 22.1 | - |
| Cash Periods | 0 of 103 | - |
The raw return is strong: $10,000 grew to roughly $160,000 vs $73,000 for the S&P 500. The Sharpe ratio is meaningfully higher (0.404 vs 0.361). The max drawdown is deeper: -52.48% vs SPY's -43.86%. More return, better risk-adjusted efficiency, at the cost of a harder drawdown to sit through.
The zero cash periods tell you one thing clearly: the screen always finds qualifying stocks. US large caps have enough breadth that even in elevated markets, some combination of sectors passes the P/S and margin filters.
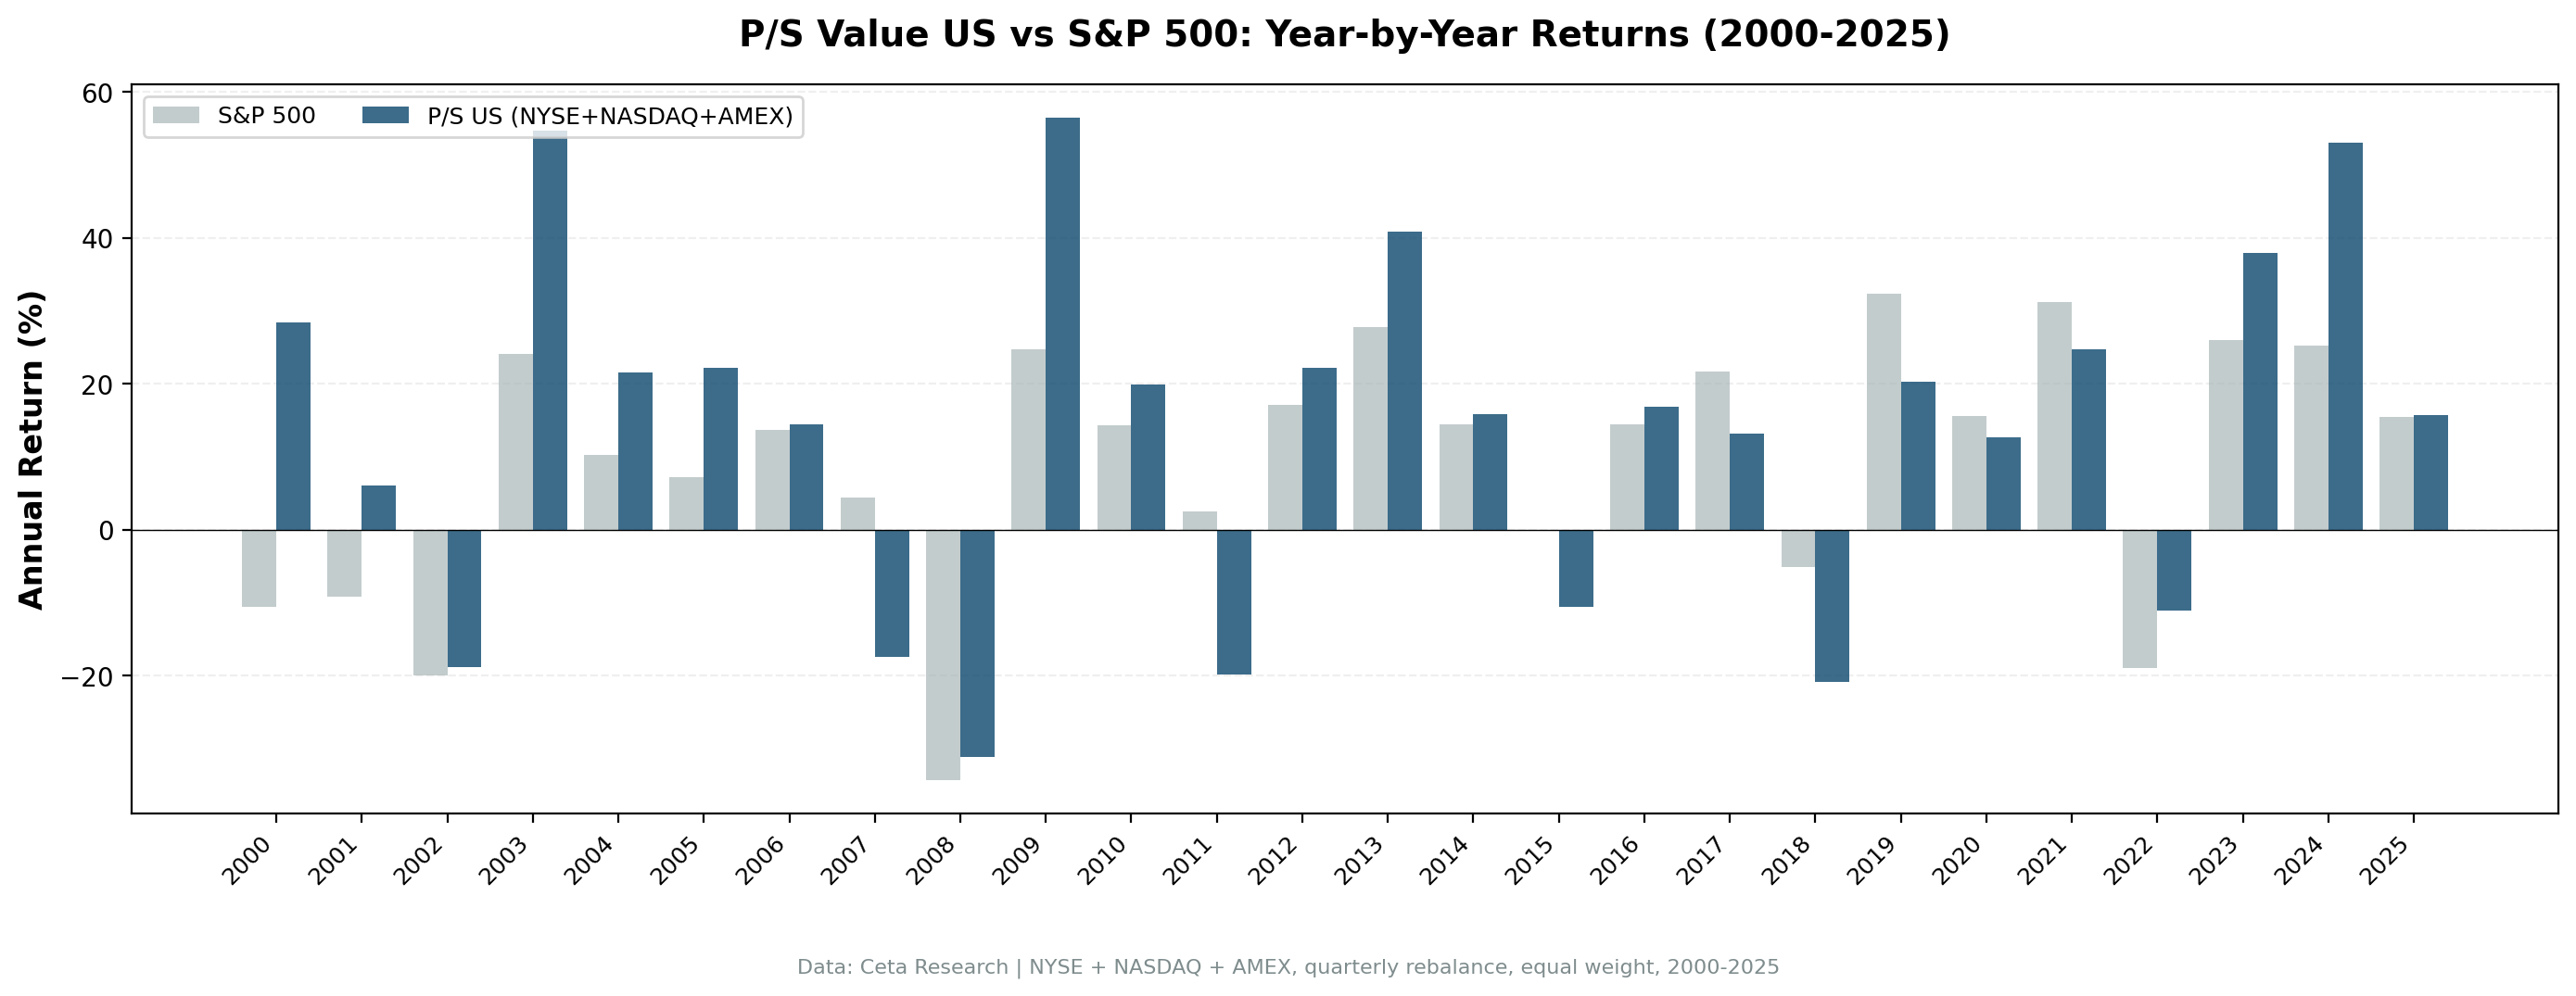
Year-by-year returns
| Year | P/S Screen | S&P 500 | Excess |
|---|---|---|---|
| 2000 | +28.46% | -10.50% | +38.96% |
| 2001 | +6.03% | -9.17% | +15.19% |
| 2002 | -18.75% | -19.92% | +1.17% |
| 2003 | +54.69% | +24.12% | +30.57% |
| 2004 | +21.62% | +10.24% | +11.38% |
| 2005 | +22.23% | +7.17% | +15.06% |
| 2006 | +14.44% | +13.65% | +0.80% |
| 2007 | -17.36% | +4.40% | -21.76% |
| 2008 | -31.11% | -34.31% | +3.20% |
| 2009 | +56.47% | +24.73% | +31.74% |
| 2010 | +19.97% | +14.31% | +5.66% |
| 2011 | -19.79% | +2.46% | -22.26% |
| 2012 | +22.25% | +17.09% | +5.16% |
| 2013 | +40.85% | +27.77% | +13.07% |
| 2014 | +15.81% | +14.50% | +1.32% |
| 2015 | -10.58% | -0.12% | -10.46% |
| 2016 | +16.82% | +14.45% | +2.36% |
| 2017 | +13.22% | +21.64% | -8.42% |
| 2018 | -20.89% | -5.15% | -15.74% |
| 2019 | +20.27% | +32.31% | -12.05% |
| 2020 | +12.63% | +15.64% | -3.01% |
| 2021 | +24.78% | +31.26% | -6.48% |
| 2022 | -11.08% | -18.99% | +7.91% |
| 2023 | +37.93% | +26.00% | +11.93% |
| 2024 | +53.01% | +25.28% | +27.73% |
| 2025 | +15.78% | +15.47% | +0.31% |
2000-2005: the strategy's best period
| Period | P/S Screen | S&P 500 | Excess |
|---|---|---|---|
| 2000-2001 | +36.2% | -18.8% | +55.0% |
| 2002 | -18.75% | -19.92% | +1.17% |
| 2003-2005 | +130.7% | +45.0% | +85.7% |
During the dot-com bust, P/S below 1 with margin requirements excluded nearly every overvalued tech name. Companies trading at 20x or 50x sales simply don't appear in this screen. The portfolio sat in cash-generative industrials, healthcare, and select financials that the tech rally had ignored. When the market crashed, those stocks held up. When the recovery came in 2003-2005, they caught a double tailwind: earnings recovery plus multiple expansion from depressed levels.
Crisis comparison
| Event | P/S Screen | S&P 500 | Gap |
|---|---|---|---|
| Dot-com peak (2000-01) | +36.2% | -18.8% | +55.0% |
| Financial Crisis (2008) | -31.11% | -34.31% | +3.20% |
| COVID (2020) | +12.63% | +15.64% | -3.01% |
| 2022 Bear | -11.08% | -18.99% | +7.91% |
2008 was the sharpest illustration of the drawdown risk. The portfolio beat SPY by 3.20% that year (-31.11% vs -34.31%). Even so, the cumulative drawdown hit -52.48%. The low P/S filter doesn't inherently protect against systemic deleveraging. When credit freezes and everything sells off, cheap-on-sales stocks are not immune.
2017-2019: where the strategy lost ground
Three consecutive years of underperformance, with 2018 being the worst single-year gap: -20.89% vs SPY -5.15%. This wasn't a fluke. It reflects the strategy's structural positioning.
The US market from 2015 to 2021 was heavily driven by software, cloud, and platform companies with high revenue multiples. Those companies were growing fast but trading at P/S ratios of 5x, 10x, or higher. They don't qualify for this screen by definition. Meanwhile, the stocks that did qualify (traditional value sectors: retail, energy, healthcare services) went through a rough patch as investors rotated toward growth.
The quality filters help here. Without the gross margin and operating margin requirements, the screen would have held more commodity distributors and margin-thin retailers, which would have hurt further. The screens didn't prevent underperformance, but they kept it from being worse.
2022-2024: value makes its return
| Year | P/S Screen | S&P 500 | Excess |
|---|---|---|---|
| 2022 | -11.08% | -18.99% | +7.91% |
| 2023 | +37.93% | +26.00% | +11.93% |
| 2024 | +53.01% | +25.28% | +27.73% |
The three-year sequence from 2022 to 2024 was the strongest consecutive run in the backtest. Rising rates hammered long-duration growth assets and sent investors back to profitable companies with real revenues. The P/S screen was well-positioned for exactly this regime: cheap on sales, operationally solid, positive ROE. 2024's +53.01% is the single biggest year in the backtest.
Backtest Methodology
| Parameter | Choice |
|---|---|
| Universe | NYSE + NASDAQ + AMEX, Market Cap > $1B USD |
| Signal | P/S < 1.0, Gross Margin > 20%, Op. Margin > 5%, ROE > 10% |
| Portfolio | Top 30 by lowest P/S, equal weight |
| Rebalancing | Quarterly (January, April, July, October) |
| Cash rule | Hold cash if < 10 qualify |
| Benchmark | S&P 500 Total Return (SPY) |
| Period | 2000-2025 (25 years, 103 quarterly periods) |
| Execution | Next-bar (MOC), 45-day lag on FY data, data-quality guards |
Limitations
Drawdown worse than benchmark. The -52.48% max drawdown exceeds SPY's -43.86%. The strategy doesn't protect capital as well in systemic crashes. Investors need to account for this explicitly.
Sharpe improvement is real but bounded. 0.404 vs 0.361 is a meaningful gain, but the alpha comes primarily from raw return. Investors who care about Sharpe first should weigh this carefully.
Sector concentration. Without a sector cap, the screen can cluster heavily in a single industry. Some periods skew toward healthcare services or industrial distributors. Single-sector risk is real.
Growth stock exclusion is intentional but painful. Any company with a high P/S ratio, including many of the best-performing stocks of the last decade, is excluded by construction. The screen will always underperform in growth-dominated markets.
Survivorship bias. Exchange membership uses current profiles, not historical. IPOs and delistings aren't tracked over time, which is a standard limitation of this type of backtest.
Transaction costs not included. Quarterly rebalancing of 30 large-cap stocks generates meaningful turnover. Cost drag at 0.2-0.5% per transaction one-way is approximately 0.4-1.0% annually depending on portfolio size.
Takeaway
The P/S screen generates meaningful alpha over 25 years: 11.66% CAGR vs 8.02% for SPY. The zero cash periods show the US market is deep enough that this screen always finds qualifying names. The 2022-2024 run demonstrates the strategy has real legs in value-friendly regimes.
What it doesn't fully resolve is drawdown risk. The max drawdown of -52.48% is still worse than SPY's -43.86%. If you're running this strategy, you're accepting deeper drawdowns in exchange for the return premium. That tradeoff works over 25 years. Whether it works for you depends on your capacity to sit through a -52% drawdown, which is a harder question than the numbers can answer.
The quality filters, gross margin above 20% and operating margin above 5%, are doing real work. A raw P/S screen without them fills with businesses that are cheap on sales for a good reason: they make very little on each dollar of revenue. The version tested here has a different character.
Part of a Series
This analysis is part of our global P/S value screen comparison. We tested the same screen across 15 exchanges worldwide: - P/S Value Screen on Indian Stocks (NSE) - 12.27% CAGR, narrow +1.15% vs Sensex - P/S Value Screen on Swedish Stocks (STO) - 10.96% CAGR, +7.79% vs OMX, Sharpe 0.452 (best globally) - P/S Value Screen on German Stocks (XETRA) - 8.13% CAGR, +3.01% vs DAX - P/S Value Screen on Canadian Stocks (TSX) - 8.42% CAGR, +3.33% vs TSX Comp - P/S Value Screen on Japanese Stocks (JPX) - 7.71% CAGR, +4.31% vs Nikkei - P/S Value Screen on South African Stocks (JNB) - 6.24% CAGR, -1.77% vs SPY - P/S Value Screen: Global Exchange Comparison
References
- Fisher, K. (1984). Super Stocks. Dow Jones-Irwin.
- Barbee, W., Mukherji, S. & Raines, G. (1996). "Do Sales-Price and Debt-Equity Explain Stock Returns Better than Book-Market and Firm Size?" Financial Analysts Journal, 52(2), 56-60.
- Gray, W. & Vogel, J. (2012). "Analyzing Valuation Measures: A Performance Horse-Race over the Past 40 Years." Journal of Portfolio Management, 39(1), 112-121.
- Novy-Marx, R. (2013). "The Other Side of Value: The Gross Profitability Premium." Journal of Financial Economics, 108(1), 1-28.
Run This Screen Yourself
Via web UI: Run the P/S value screen on Ceta Research. The query is pre-loaded. Hit "Run" and see what qualifies today.
Via Python:
import requests, time

API_KEY = "your_api_key"  # get one at cetaresearch.com
BASE = "https://tradingstudio.finance/api/v1"

resp = requests.post(f"{BASE}/data-explorer/execute", headers={
    "X-API-Key": API_KEY, "Content-Type": "application/json"
}, json={
    "query": """
        SELECT f.symbol, p.companyName, p.sector,
            ROUND(f.priceToSalesRatioTTM, 3) AS ps_ratio,
            ROUND(f.grossProfitMarginTTM * 100, 1) AS gross_margin_pct,
            ROUND(f.operatingProfitMarginTTM * 100, 1) AS op_margin_pct,
            ROUND(k.returnOnEquityTTM * 100, 1) AS roe_pct,
            ROUND(k.marketCap / 1e9, 2) AS mktcap_b
        FROM financial_ratios_ttm f
        JOIN key_metrics_ttm k ON f.symbol = k.symbol
        JOIN profile p ON f.symbol = p.symbol
        WHERE f.priceToSalesRatioTTM > 0
          AND f.priceToSalesRatioTTM < 1
          AND f.grossProfitMarginTTM > 0.20
          AND f.operatingProfitMarginTTM > 0.05
          AND k.returnOnEquityTTM > 0.10
          AND k.marketCap > 1000000000
          AND p.exchange IN ('NYSE', 'NASDAQ', 'AMEX')
        QUALIFY ROW_NUMBER() OVER (PARTITION BY f.symbol ORDER BY f.priceToSalesRatioTTM ASC) = 1
        ORDER BY f.priceToSalesRatioTTM ASC
        LIMIT 30
    """,
    "options": {"format": "json", "limit": 100}
})
task_id = resp.json()["taskId"]

while True:
    result = requests.get(f"{BASE}/tasks/data-query/{task_id}",
                          headers={"X-API-Key": API_KEY}).json()
    if result["status"] in ("completed", "failed"):
        break
    time.sleep(2)

for r in result["result"]["rows"][:10]:
    print(f"{r['symbol']:8s} P/S={r['ps_ratio']:.3f} GM={r['gross_margin_pct']:.1f}% ROE={r['roe_pct']:.1f}%")
Get your API key at cetaresearch.com. The full backtest code (Python + DuckDB) is on GitHub.
Data: Ceta Research, FMP financial data warehouse. Universe: NYSE + NASDAQ + AMEX, market cap > $1B USD. Period: 2000–2025, quarterly rebalance, equal weight, top 30 by P/S, MOC execution with data-quality guards. Transaction costs not included. Past performance does not guarantee future results. This is research content, not investment advice.


