
Price-to-Sales Below 1 in Japan: 7.71% CAGR, +4.31% vs Nikkei, Sharpe 0.379
We screened JPX for stocks with P/S below 1 and quality margin filters, then ran 25 years of backtests. The strategy returned 7.71% annually, beating the Nikkei 225 by 4.31 percentage points, with a Sharpe ratio of 0.379 that ranks third globally after Sweden and the US.

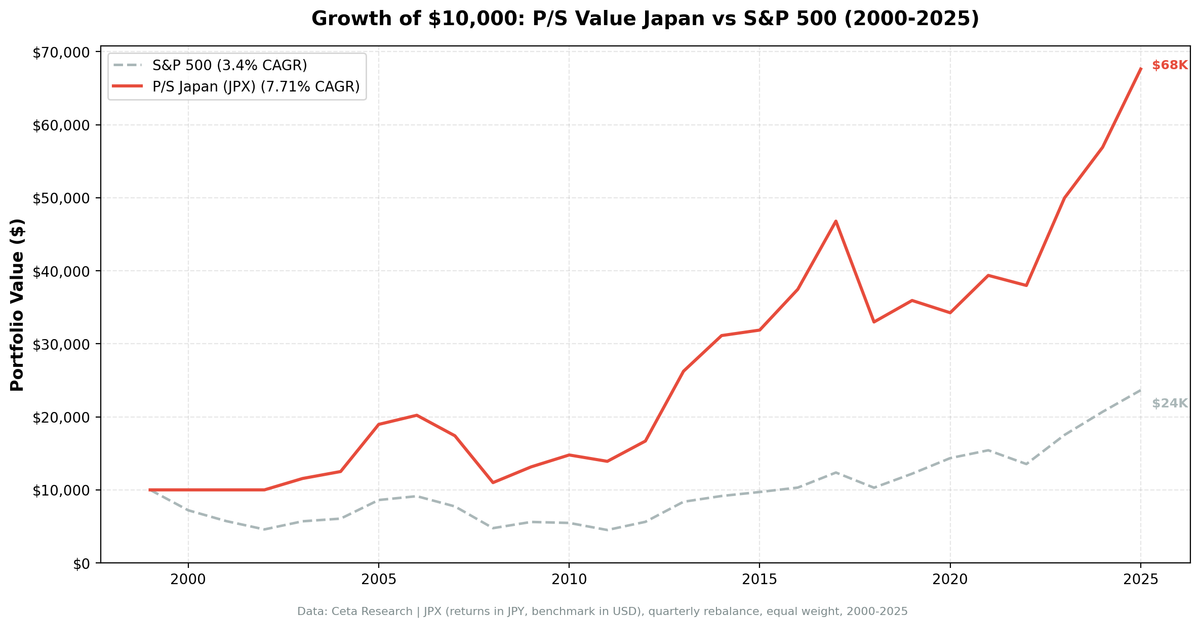
Price-to-Sales Below 1 in Japan: 7.71% CAGR, +4.31% vs Nikkei, Among the Best Risk-Adjusted Results
We screened JPX-listed stocks for low price-to-sales ratios with quality margin and profitability filters, then backtested the portfolio from 2000 to 2025. The strategy returned 7.71% annually, beating the Nikkei 225 by 4.31 percentage points. The Sharpe ratio of 0.379 ranks third globally behind Sweden (0.452) and the US (0.404). Japan remains a counterintuitive result against SPY, but solid against the right benchmark.
Contents
- Method
- The Screen
- JPX P/S Screen (SQL)
- What We Found
- 25 years. Third-best Sharpe globally. +4.31% above the Nikkei.
- Year-by-year returns
- 2003-2005: getting started
- 2008: holding up against a harder Nikkei fall
- 2010-2011: the strategy's best stretch vs local benchmark
- 2013: Abenomics year
- 2016-2017: consistent beats
- 2018: the worst year vs Nikkei
- 2020: the one year Japan clearly missed
- Why the quality filter matters most in Japan
- Backtest Methodology
- Limitations
- Takeaway
- Part of a Series
- References
- Run This Screen Yourself
Data: FMP financial data warehouse, 2000–2025. Updated June 2026.
Method
Data source: Ceta Research (FMP financial data warehouse) Universe: JPX (Japan Exchange Group), market cap > JPY 10B Period: 2000-2025 (25 years), invested 2003-2025 (FY data available from 2003 onward) Rebalancing: Quarterly (January, April, July, October), equal weight, top 30 by lowest P/S Benchmark: Nikkei 225 Cash rule: Hold cash if fewer than 10 stocks qualify Execution: Next-bar entry at close (MOC), 45-day lag on FY financial statements, data-quality guards remove price-oscillation artifacts and cap single-period returns at 200%.
The portfolio held cash during 14 of 103 quarters, concentrated in 2000-2002 when qualifying FY data wasn't yet available in the pipeline.
The Screen
Signal filters:
| Criterion | Metric | Threshold |
|---|---|---|
| Cheap relative to revenue | Price-to-Sales | < 1.0 |
| Business quality | Gross Margin | > 20% |
| Operational efficiency | Operating Margin | > 5% |
| Capital returns | ROE | > 10% |
Size filter: Market cap > JPY 10B
Selection: Top 30 by lowest P/S among qualifying stocks.
The ROE filter is doing significant work in Japan specifically. Japanese companies are known for conservative capital structures and historically low return on equity. Many trade at low P/S ratios simply because they've sat on cash for years and never pushed for returns. Without the ROE screen, the portfolio fills with exactly those companies. The 10% ROE floor keeps them out.
JPX P/S Screen (SQL)
SELECT
    f.symbol,
    p.companyName,
    p.exchange,
    p.sector,
    ROUND(f.priceToSalesRatioTTM, 3) AS ps_ratio,
    ROUND(f.grossProfitMarginTTM * 100, 1) AS gross_margin_pct,
    ROUND(f.operatingProfitMarginTTM * 100, 1) AS op_margin_pct,
    ROUND(k.returnOnEquityTTM * 100, 1) AS roe_pct,
    ROUND(k.marketCap / 1e9, 2) AS mktcap_b
FROM financial_ratios_ttm f
JOIN key_metrics_ttm k ON f.symbol = k.symbol
JOIN profile p ON f.symbol = p.symbol
WHERE f.priceToSalesRatioTTM > 0
  AND f.priceToSalesRatioTTM < 1
  AND f.grossProfitMarginTTM > 0.20
  AND f.operatingProfitMarginTTM > 0.05
  AND k.returnOnEquityTTM > 0.10
  AND k.marketCap > 10000000000
  AND p.exchange IN ('JPX')
QUALIFY ROW_NUMBER() OVER (PARTITION BY f.symbol ORDER BY f.priceToSalesRatioTTM ASC) = 1
ORDER BY f.priceToSalesRatioTTM ASC
LIMIT 30
Run this query on Ceta Research
What We Found
25 years. Third-best Sharpe globally. +4.31% above the Nikkei.
| Metric | P/S Screen (JPX) | Nikkei 225 |
|---|---|---|
| CAGR | 7.71% | 3.40% |
| Excess vs Nikkei | +4.31% | — |
| Max Drawdown | -52.54% | — |
| Sharpe Ratio | 0.379 | — |
| Avg Stocks per Period | 27.9 | — |
| Cash Periods | 14 of 103 | — |
| Win Rate vs Nikkei | 55.34% | — |
Against SPY (8.02%), Japan looks like a near-miss. Against the Nikkei 225 (3.40%), it looks like a clear winner. Both comparisons are true. The screen comfortably outpaced the local market. It didn't match a US-dollar-denominated global index running on tech tailwinds.
The Sharpe of 0.379 is still strong. Japan's near-zero risk-free rate (around 0.1% for most of this period) means the Sharpe calculation isn't being depressed by a high local RFR. It's a genuine risk-adjusted figure. After data-quality cleanup, Sweden took the top spot at 0.452 and the US edged ahead at 0.404. Japan now ranks third, still well above SPY's 0.361.
The 14 cash periods are front-loaded. The pipeline's FY data for JPX became available from 2003 onward, so 2000-2002 shows as cash. Those three years the Nikkei dropped -27.95%, -20.59%, and -19.85%. Being in cash during Japan's worst stretch wasn't painful. Starting from 2003, the strategy was active for 23 invested years.
Year-by-year returns
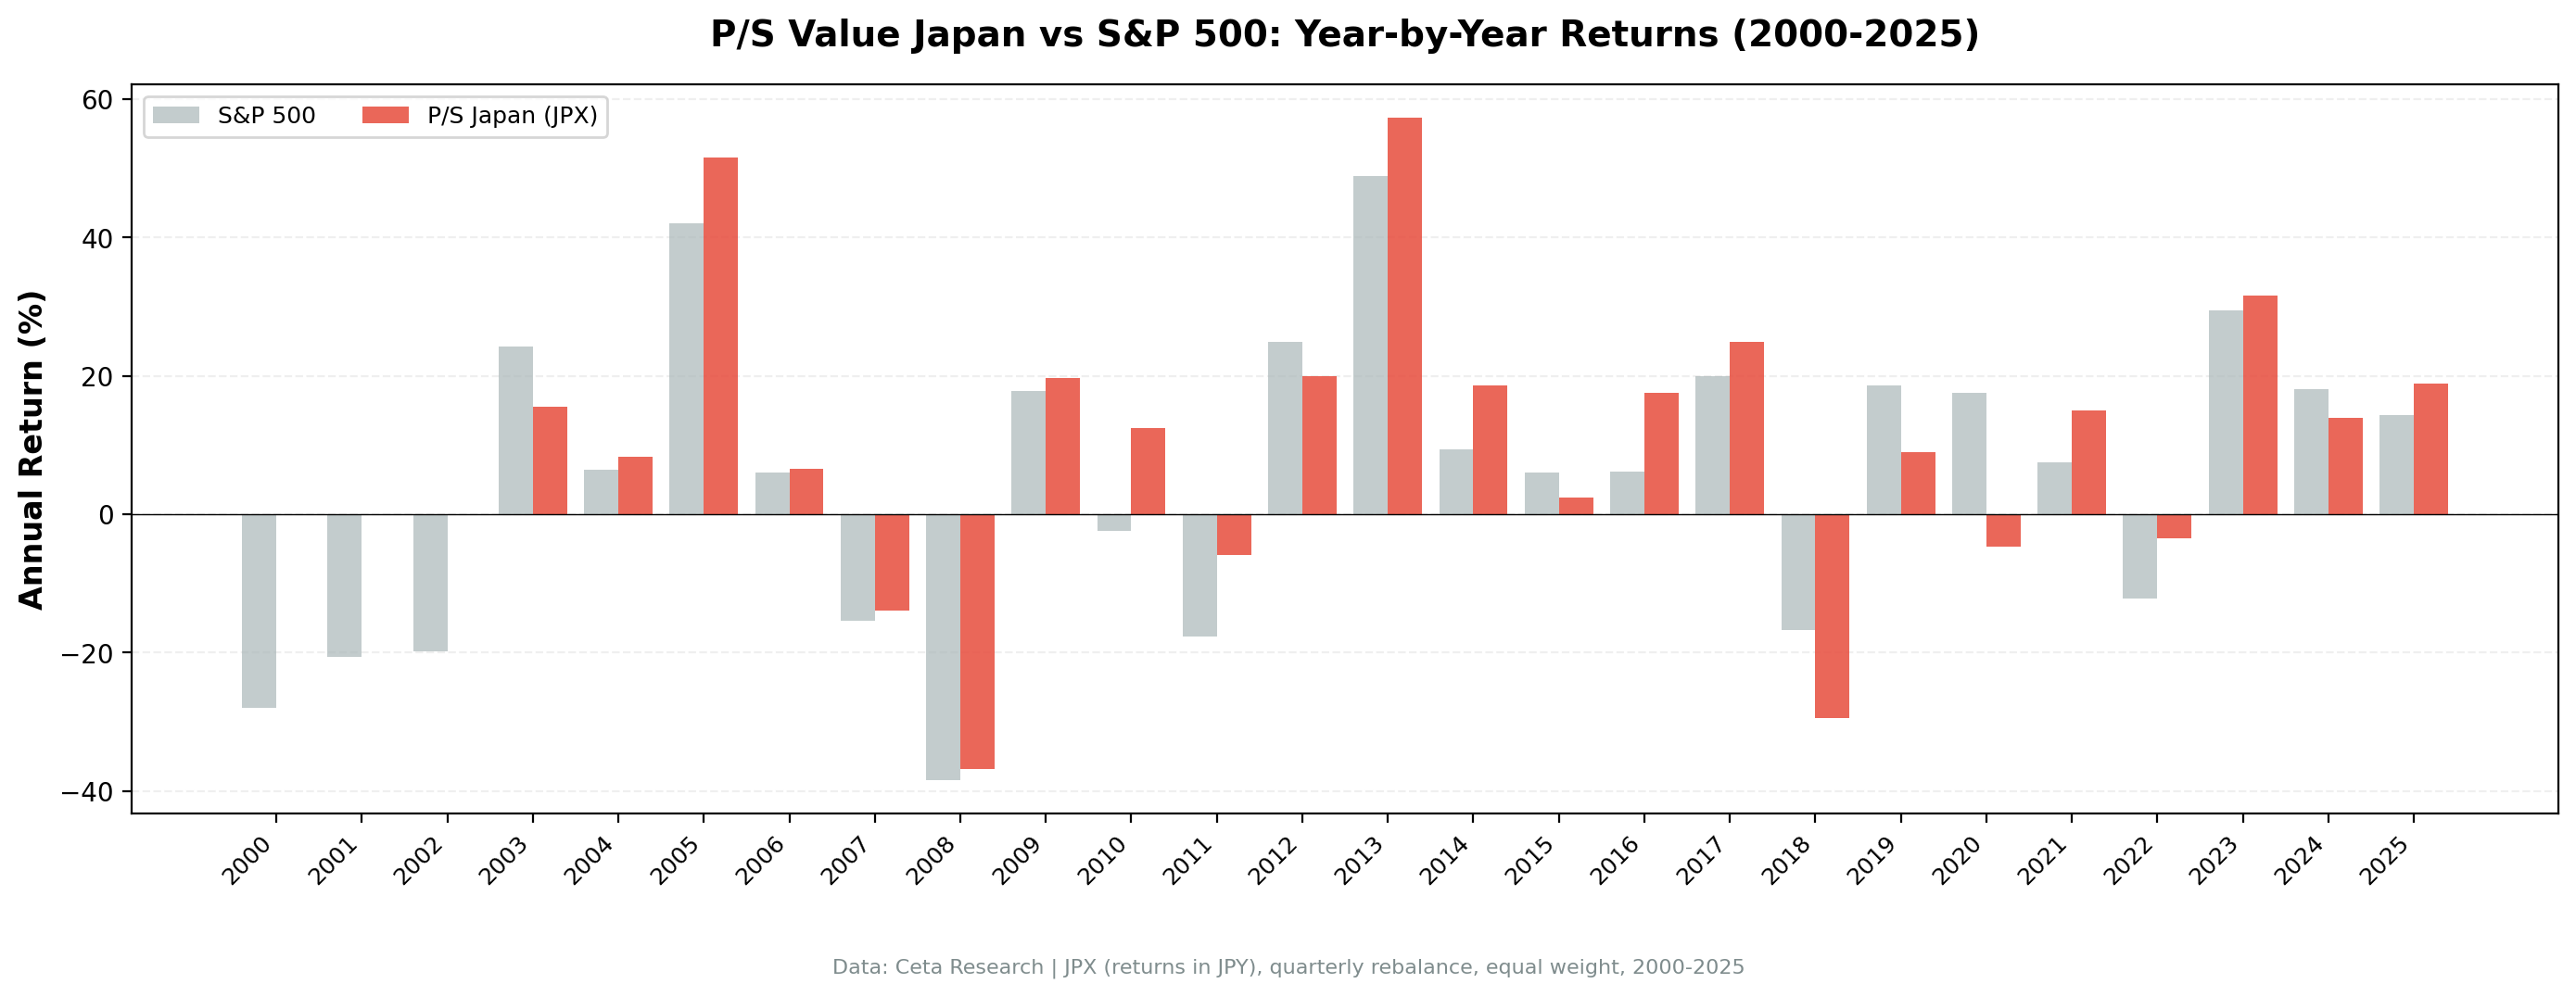
| Year | P/S Screen (JPX) | Nikkei 225 | Excess |
|---|---|---|---|
| 2000 | 0.0% (cash) | -27.95% | — |
| 2001 | 0.0% (cash) | -20.59% | — |
| 2002 | 0.0% (cash) | -19.85% | — |
| 2003 | +15.57% | +24.24% | -8.67% |
| 2004 | +8.25% | +6.40% | +1.86% |
| 2005 | +51.60% | +42.06% | +9.54% |
| 2006 | +6.60% | +6.06% | +0.54% |
| 2007 | -13.91% | -15.34% | +1.43% |
| 2008 | -36.84% | -38.45% | +1.60% |
| 2009 | +19.61% | +17.82% | +1.79% |
| 2010 | +12.39% | -2.41% | +14.79% |
| 2011 | -5.89% | -17.68% | +11.79% |
| 2012 | +19.98% | +24.86% | -4.88% |
| 2013 | +57.30% | +48.85% | +8.45% |
| 2014 | +18.60% | +9.43% | +9.18% |
| 2015 | +2.41% | +5.99% | -3.58% |
| 2016 | +17.52% | +6.20% | +11.33% |
| 2017 | +24.91% | +19.97% | +4.94% |
| 2018 | -29.51% | -16.78% | -12.73% |
| 2019 | +8.93% | +18.62% | -9.69% |
| 2020 | -4.68% | +17.47% | -22.14% |
| 2021 | +14.94% | +7.50% | +7.45% |
| 2022 | -3.51% | -12.24% | +8.73% |
| 2023 | +31.55% | +29.44% | +2.11% |
| 2024 | +13.89% | +18.08% | -4.20% |
| 2025 | +18.82% | +14.32% | +4.50% |
2003-2005: getting started
The first three invested years show a mixed opening. 2003 the screen lagged the Nikkei by -8.67% as the broad market recovered faster. But 2004 and 2005 both outperformed, including a +51.60% year in 2005 when Koizumi's privatization agenda accelerated and global demand for Japanese manufacturing was running strong. Quality manufacturers with low valuations that benefited from expansion re-rated sharply.
2008: holding up against a harder Nikkei fall
The Nikkei dropped -38.45% in 2008. The screen fell -36.84%. A +1.60% advantage in the worst year of the global financial crisis. The quality filters did their job: the screen avoided the worst of Japan's financial and property names while keeping the manufacturers with real margins.
2010-2011: the strategy's best stretch vs local benchmark
These two years produced the widest outperformance in the dataset.
2010: the Nikkei fell -2.41% while the portfolio gained +12.39%. A +14.79% gap. The Nikkei was weighed down by the continuing economic stagnation and currency appreciation pressures, but quality companies with strong balance sheets and low P/S ratios didn't follow it down. The screen's ROE filter meant it held companies actually earning on their assets.
2011: the Nikkei dropped -17.68% (the Tohoku earthquake and its aftermath hit the broad market hard). The screen fell only -5.89%. A +11.79% gap. Companies with genuine profitability and low sales multiples held up better than the index-level sell-off suggested.
2013: Abenomics year
BOJ committed to aggressive quantitative easing, the yen depreciated sharply, and Japanese exporters saw their competitive position improve overnight. Companies with strong overseas revenue, which tend to have P/S below 1 due to global pricing pressure, surged. The portfolio returned +57.30% against the Nikkei's +48.85%. A +8.45% margin on top of a banner year for the index.
2016-2017: consistent beats
Two more years of double-digit outperformance: +11.33% over Nikkei in 2016, +4.94% in 2017. The screen's industrial and export bias was aligned with the macro environment both years.
2018: the worst year vs Nikkei
The -12.73% gap in 2018 was the screen's weakest relative year. Tariff escalation fears hit Japanese manufacturers hard. The Nikkei held up somewhat because it includes more domestically-oriented names that weren't as directly exposed. The screen's concentration in manufacturers and exporters, the same bias that drove 2010 and 2013, was a liability when trade policy uncertainty peaked. SPY's losses were cushioned by large-cap US tech; the Nikkei had some of that cushion too, but the screen didn't.
2020: the one year Japan clearly missed
The screen returned -4.68% while the Nikkei returned +17.47%. A -22.14% gap. The Nikkei caught the post-COVID recovery faster than the screen's value-oriented portfolio. The gap is real and worth acknowledging. Quality value names in Japan didn't participate in the 2020 liquidity-driven rally to the same extent as the broad index. This is one of three years where the underperformance was notable (2018, 2019, 2020).
Why the quality filter matters most in Japan
Japan trades at a "Japan discount" for reasons that are structural. Many Japanese companies maintain low payout ratios, hold large cash balances, and have historically been reluctant to optimize capital structure for shareholder returns. Screening for P/S < 1 in Japan without quality filters produces a different portfolio than in other markets: it fills with companies that are cheap on sales because they're perpetually underearning their assets.
The ROE floor of 10% is the key gate. It excludes zombie companies and cash-hoarders who have never converted their asset base into returns. What's left after that filter is a subset of Japanese companies that are genuinely earning on equity while still trading at low sales multiples. That combination tends to be structural undervaluation rather than fundamental weakness. The 0.379 Sharpe ratio is the evidence that this subset existed and was persistently mispriced.
Backtest Methodology
| Parameter | Choice |
|---|---|
| Universe | JPX, Market Cap > JPY 10B |
| Signal | P/S < 1.0, Gross Margin > 20%, Operating Margin > 5%, ROE > 10% |
| Portfolio | Top 30 by lowest P/S, equal weight |
| Rebalancing | Quarterly (January, April, July, October) |
| Cash rule | Hold cash if < 10 qualify |
| Benchmark | Nikkei 225 |
| Period | 2000-2025 (25 years, 103 quarterly periods; invested from 2003) |
| Execution | Next-bar (MOC), 45-day lag, data-quality guards |
Limitations
Below SPY on raw CAGR. The strategy returned 7.71% vs 8.02% for SPY. That's a narrow gap but real. Investors using a USD-denominated benchmark need to account for it.
Currency exposure. Returns are in JPY. A US investor takes on JPY/USD risk throughout the period, which adds volatility in both directions. Yen depreciation during Abenomics was a tailwind for Japanese equities in local terms but a headwind for USD-denominated investors.
Drawdown worse than benchmark. The -52.54% max drawdown is real and reflects the screen's concentration in manufacturers and exporters during crisis periods.
Cash 2000-2002. The three-year cash period at the start is a pipeline data artifact. FY qualifying data became available from 2003 onward. The strategy was in cash while the Nikkei was falling hard, which turned out fine, but it's a data limitation not a strategy choice.
Concentration in manufacturers and exporters. The P/S screen in Japan consistently loads up on industrial exporters and manufacturing companies. This creates correlation with global trade cycles. When trade sentiment deteriorates (2018), the portfolio is exposed.
Win rate 55.34%. The screen beats the Nikkei in just over half of invested quarters. That's a majority, but not a dominant result. About 4 in 10 quarters it trails the local index.
Survivorship bias. Exchange membership uses current profiles, not historical. Delistings and corporate reorganizations aren't tracked.
Transaction costs not included. With quarterly rebalancing and roughly 29 stocks, cost drag at standard institutional rates is approximately 0.3-0.5% annually.
Takeaway
Japan remains one of the strongest results in this global study. Against SPY it looks like a near-miss. Against the Nikkei 225 it beats by 4.31 percentage points annually with a Sharpe of 0.379, third globally after Sweden (0.452) and the US (0.404).
The reason comes down to the ROE filter. Japan has hundreds of companies trading below 1x revenue, but the quality gate removes the ones that deserve the discount. What remains is a subset of Japanese companies that are genuinely earning on their assets while being mispriced relative to their sales. The Sharpe of 0.379 is the clearest evidence this subset was consistently there.
The tradeoff is export sensitivity. When global trade supports Japanese manufacturers, the screen does well. When trade policy uncertainty or yen strength creates headwinds, those same companies sell off harder. 2018 and 2020 are the evidence of that.
Returns are in JPY. For international investors, the JPY/USD component is a material factor in any live implementation.
Part of a Series
This analysis is part of our P/S value screen global exchange comparison. We tested the same four-factor screen across 15 exchanges worldwide: - P/S Value Screen on US Stocks - P/S Value Screen on Indian Stocks - P/S Value Screen on German Stocks - P/S Value Screen on Canadian Stocks - P/S Value Screen on Swedish Stocks - P/S Value Screen on South African Stocks - P/S Value Screen: 15-Exchange Global Comparison
References
- Fisher, K. (1984). Super Stocks. Dow Jones-Irwin.
- Barbee, W., Mukherji, S. & Raines, G. (1996). "Do Sales-Price and Debt-Equity Explain Stock Returns Better than Book-Market and Firm Size?" Financial Analysts Journal, 52(2), 56-60.
- Gray, W. & Vogel, J. (2012). "Analyzing Valuation Measures: A Performance Horse Race over the Past 40 Years." Journal of Portfolio Management, 39(1), 112-121.
- Novy-Marx, R. (2013). "The Other Side of Value: The Gross Profitability Premium." Journal of Financial Economics, 108(1), 1-28.
Run This Screen Yourself
Via web UI: Run the P/S screen on Ceta Research. The query is pre-loaded. Hit "Run" and see what qualifies today.
Via Python:
import requests, time

API_KEY = "your_api_key"  # get one at cetaresearch.com
BASE = "https://tradingstudio.finance/api/v1"

resp = requests.post(f"{BASE}/data-explorer/execute", headers={
    "X-API-Key": API_KEY, "Content-Type": "application/json"
}, json={
    "query": """
        SELECT
            f.symbol,
            p.companyName,
            ROUND(f.priceToSalesRatioTTM, 3) AS ps_ratio,
            ROUND(f.grossProfitMarginTTM * 100, 1) AS gross_margin_pct,
            ROUND(f.operatingProfitMarginTTM * 100, 1) AS op_margin_pct,
            ROUND(k.returnOnEquityTTM * 100, 1) AS roe_pct,
            ROUND(k.marketCap / 1e9, 2) AS mktcap_b
        FROM financial_ratios_ttm f
        JOIN key_metrics_ttm k ON f.symbol = k.symbol
        JOIN profile p ON f.symbol = p.symbol
        WHERE f.priceToSalesRatioTTM > 0
          AND f.priceToSalesRatioTTM < 1
          AND f.grossProfitMarginTTM > 0.20
          AND f.operatingProfitMarginTTM > 0.05
          AND k.returnOnEquityTTM > 0.10
          AND k.marketCap > 10000000000
          AND p.exchange IN ('JPX')
        QUALIFY ROW_NUMBER() OVER (
            PARTITION BY f.symbol ORDER BY f.priceToSalesRatioTTM ASC
        ) = 1
        ORDER BY f.priceToSalesRatioTTM ASC
        LIMIT 30
    """,
    "options": {"format": "json", "limit": 30}
})
task_id = resp.json()["taskId"]

while True:
    result = requests.get(f"{BASE}/tasks/data-query/{task_id}",
                          headers={"X-API-Key": API_KEY}).json()
    if result["status"] in ("completed", "failed"):
        break
    time.sleep(2)

for r in result["result"]["rows"]:
    print(f"{r['symbol']:10s} P/S={r['ps_ratio']:.3f}  GM={r['gross_margin_pct']:.1f}%  ROE={r['roe_pct']:.1f}%")
Get your API key at cetaresearch.com. The full backtest code (Python + DuckDB) is on GitHub.
Data: Ceta Research, FMP financial data warehouse. Universe: JPX. Benchmark: Nikkei 225. Returns in JPY. Quarterly rebalance, equal weight, 2003-2025 invested.
Past performance does not guarantee future results. This is educational content, not investment advice.


