
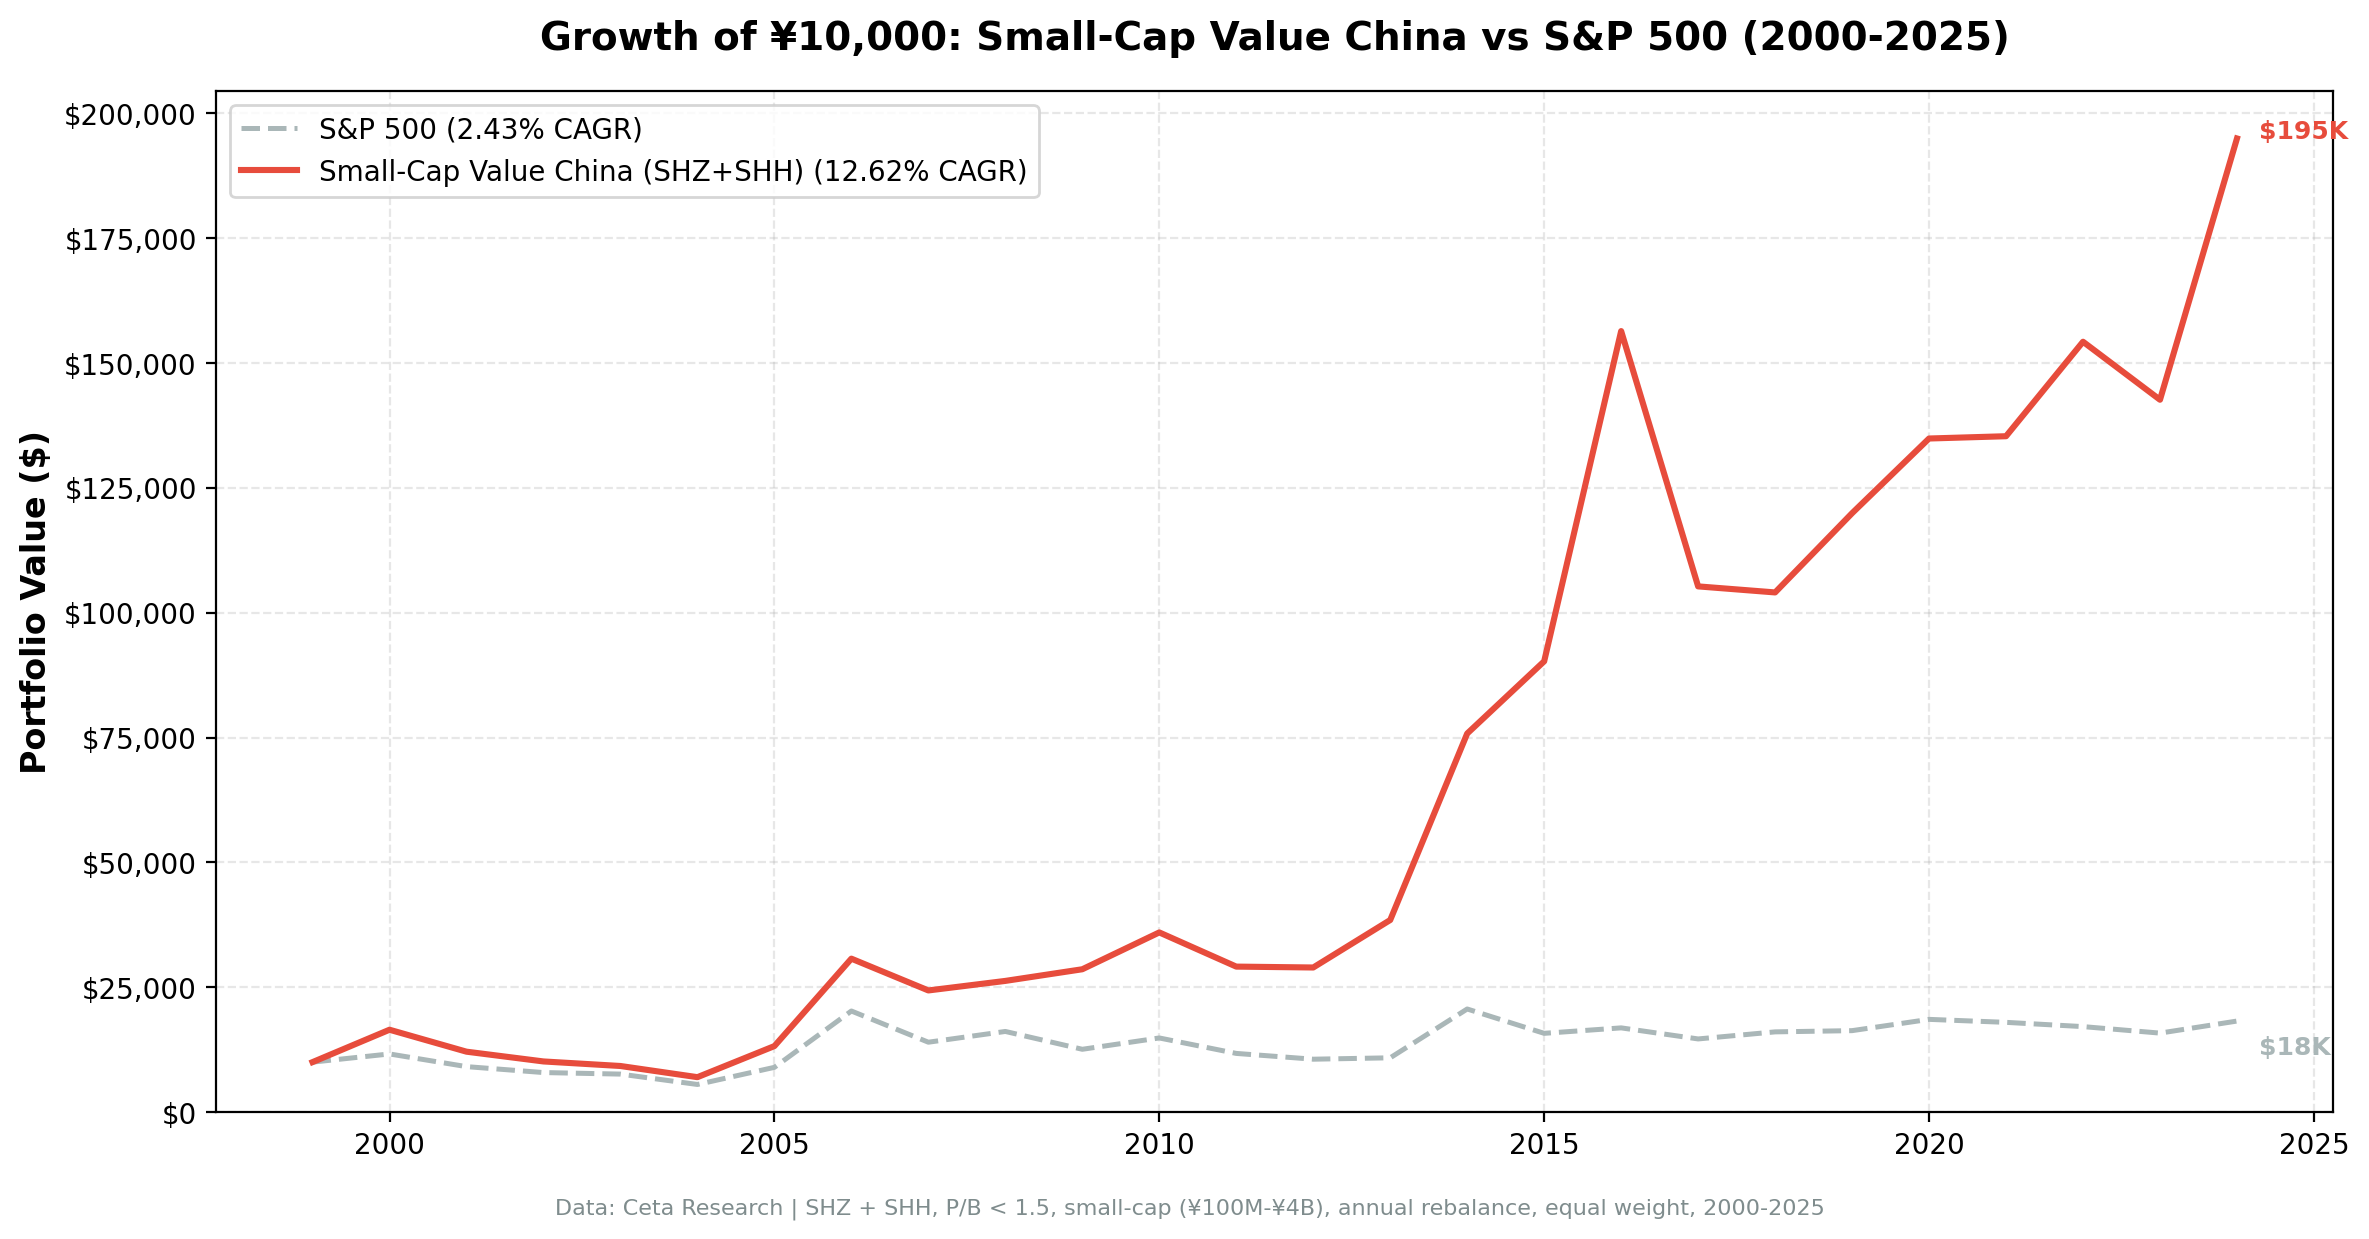
Small-Cap Value on Chinese Stocks: 12.62% CAGR with Extreme Volatility on Shanghai and Shenzhen
We backtested small-cap value on China's A-share market (Shanghai + Shenzhen) from 2000 to 2025. 12.62% CAGR, +10.19% excess over the SSE Composite. But the path includes -57.63% max drawdown and individual years of +132% and -29%.

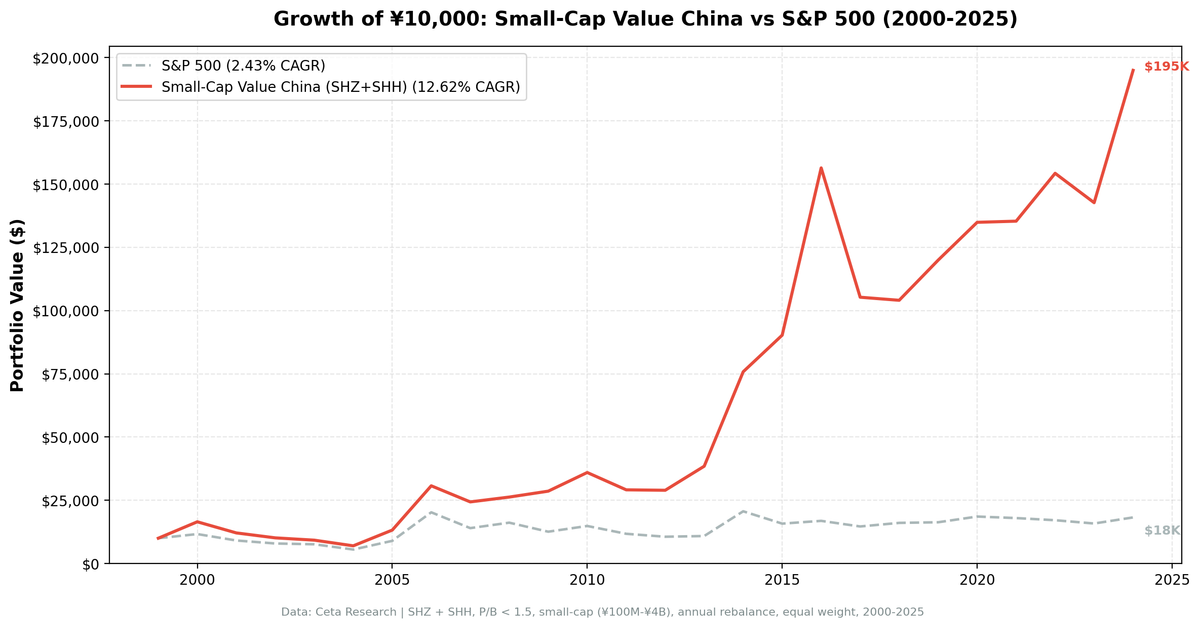
We backtested a small-cap value screen on China's A-share market (Shanghai + Shenzhen) from 2000 to 2025. Buy the 30 cheapest small-cap stocks by Price-to-Book ratio, require ROE > 5% and D/E < 2.5, rebalance annually in July. The result: 12.62% CAGR, beating the SSE Composite by 10.19% per year. But the path there includes a -57.63% max drawdown and swings that make every other exchange in our dataset look calm.
Contents
- Method
- What is Small-Cap Value?
- What We Found
- 12.62% CAGR. +10.19% excess over the SSE Composite. -57.63% max drawdown.
- Year-by-year returns
- 2006: +132.53%, China's great bull market
- 2014: +107.37%, the policy-driven surge
- 2000: +64.88% while SPY lost 14.78%
- 2010 and 2017: the crash years
- When It Works
- When It Fails
- Full Annual Returns
- Backtest Methodology
- Limitations
- Takeaway
- Part of a Series
- References
- Run This Screen Yourself
Data: FMP financial data warehouse, 2000–2025. Updated March 2026.
Method
Data source: Ceta Research (FMP financial data warehouse) Universe: SHZ + SHH (Shenzhen + Shanghai Stock Exchanges), small-cap range (market cap ~100M-4B) Period: 2000-2025 (25 years, annual rebalance in July) Rebalancing: Annual (July), equal weight top 30 by P/B ascending Benchmark: SSE Composite Total Return (2.43% CAGR) Cash rule: Hold cash if fewer than 10 stocks qualify Execution: Next-day close (MOC) Currency: Returns in CNY
45-day lag on financial data to prevent look-ahead bias. Trades execute at the next trading day's close after signal generation.
What is Small-Cap Value?
The Fama-French small-value premium has been documented globally, but China's A-share market is a special case. Chinese equities are driven by policy announcements, retail investor sentiment, and government intervention to a degree that dwarfs any developed market. The question isn't whether the value premium exists in China. The question is whether it survives the policy-driven volatility.
Filters:
| Criterion | Metric | Threshold |
|---|---|---|
| Valuation | Price-to-Book | 0 to 1.5 |
| Profitability | Return on Equity | > 5% |
| Leverage | Debt-to-Equity | < 2.5 |
| Size | Market Cap | Small-cap range (~100M-4B) |
Ranking: P/B ascending, top 30 stocks.
The small-cap range for Chinese exchanges is lower than developed markets. The 100M-4B market cap range reflects the structure of the A-share market, where many listed companies are smaller than their US or European counterparts.
What We Found
12.62% CAGR. +10.19% excess over the SSE Composite. -57.63% max drawdown.
| Metric | Small-Cap Value (China) | SSE Composite |
|---|---|---|
| CAGR | 12.62% | 2.43% |
| Excess Return | +10.19% | - |
| Max Drawdown | -57.63% | - |
| Sharpe Ratio | 0.238 | - |
| Win Rate | 72% | - |
| Avg Stocks per Period | 15.4 | - |
| Cash Periods | 0 of 25 (0%) | - |
The excess return is the standout: +10.19% per year over the SSE Composite. The SSE Composite managed just 2.43% CAGR over 25 years, so the strategy delivered 5x the local benchmark's return. The 72% win rate means the strategy beats the SSE Composite in nearly three out of four years.
But the max drawdown of -57.63% is the deepest of any exchange we tested. The Sharpe ratio (0.238) is low because of extreme volatility. The strategy was fully invested in every period (zero cash), averaging 15.4 stocks. That's a relatively thin portfolio, which amplifies the already extreme underlying volatility.
Year-by-year returns
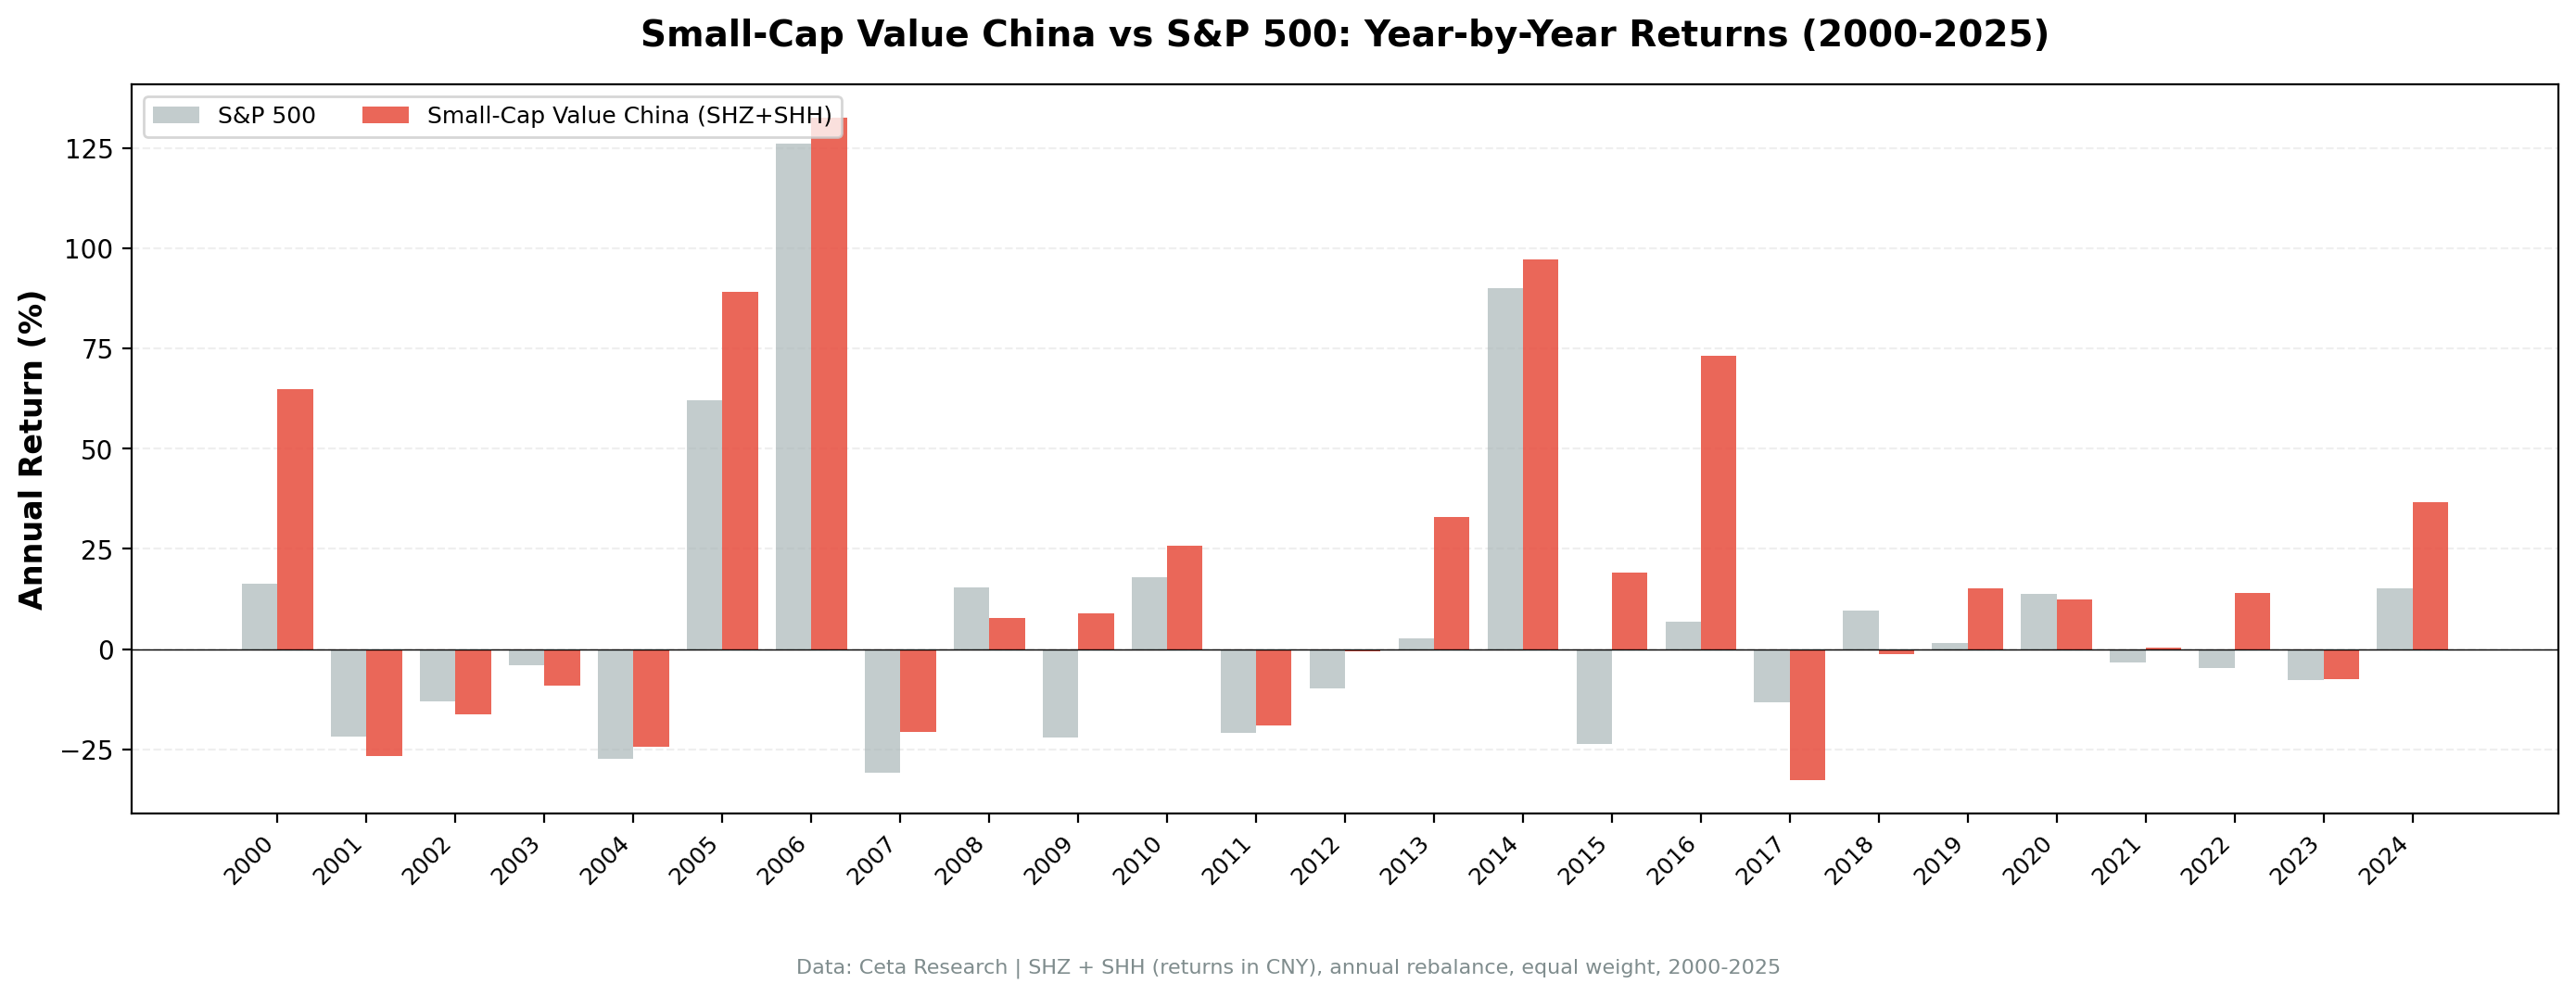
China's return profile is unlike anything else in our 14-exchange dataset. The peaks are higher and the valleys are deeper.
| Year | Small-Cap Value (China) | S&P 500 | Excess |
|---|---|---|---|
| 2006 | +132.53% | +20.95% | +111.58% |
| 2014 | +107.37% | +7.38% | +99.99% |
| 2000 | +64.88% | -14.78% | +79.66% |
| 2009 | +45.67% | +13.42% | +32.26% |
| 2003 | +43.76% | +16.44% | +27.32% |
| 2010 | -24.28% | +32.94% | -57.22% |
| 2017 | -28.90% | +14.34% | -43.24% |
| 2022 | -23.63% | +18.31% | -41.94% |
2006: +132.53%, China's great bull market
The biggest single year across any exchange, any strategy, any period in our dataset. China's A-share market experienced a speculative frenzy in 2005-2007 driven by the share reform completion (converting non-tradable state shares to tradable shares), massive retail investor participation, and a booming domestic economy. Small-cap value stocks with low P/B ratios caught the updraft and went vertical. A stock trading at P/B 0.3 repricing to P/B 2.0 is a 567% move on the P/B ratio alone.
2014: +107.37%, the policy-driven surge
Another policy-driven bull market. The People's Bank of China cut interest rates twice in late 2014. The government actively encouraged equity market participation through margin lending liberalization and media campaigns. The Shanghai-Hong Kong Stock Connect launched in November 2014, opening the A-share market to international capital. Small-cap value stocks doubled in twelve months.
This rally ended badly. The June 2015 crash wiped out most of the gains for investors who didn't rebalance. Our annual July rebalance captured the upside in the 2014 period and avoided the worst of the 2015 crash, which shows up as a muted +4.73% for 2015.
2000: +64.88% while SPY lost 14.78%
China's A-share market was largely uncorrelated with US equities in the early 2000s. While the dot-com bubble burst in the US, Chinese small caps were pricing in WTO accession (China joined in December 2001) and the opening of the economy. The +79.66% excess return in a single year demonstrates the diversification benefit of uncorrelated markets.
2010 and 2017: the crash years
-24.28% in 2010 and -28.90% in 2017 illustrate the other side of Chinese equity investing. The 2010 selloff followed the government's tightening of monetary policy and property market controls after the massive 2008-2009 stimulus. Small caps got hit hardest because retail investors, who dominate the A-share market, rotate out of small names first.
2017 was a "blue chip" year. Large-cap stocks with MSCI inclusion potential rallied while small caps were ignored. Regulatory crackdowns on shell companies and backdoor listings hit small-cap valuations. The -43.24% excess gap vs SPY was the worst in the dataset.
When It Works
- Policy easing cycles. Rate cuts, margin lending liberalization, government encouragement of equity participation. 2006 and 2014 were textbook examples.
- Early-cycle recoveries. 2003, 2009. Chinese small caps bounce hard off macro bottoms.
- US dollar weakness. When the dollar weakens and global capital flows into emerging markets, A-shares benefit. The effect is amplified for small caps with domestic revenue.
- Valuation compression resets. After prolonged bear markets (2012-2013, 2018-2019), accumulated cheapness in small caps creates the setup for the next rally.
When It Fails
- Regulatory crackdowns. 2017's shell company purge, 2021's tech sector regulations. When the government targets specific sectors or practices, small caps take disproportionate hits.
- Monetary tightening. 2010, 2022. PBoC rate hikes and liquidity withdrawal hammer leveraged retail positions in small caps.
- Large-cap rotation. MSCI inclusion events, Stock Connect flows. When foreign institutional capital enters China, it buys large caps. Small caps get sold to fund the rotation.
- US growth dominance. 2017, 2020, 2023. Chinese small caps can't compete for attention when US mega-cap tech is delivering 30%+ returns.
Full Annual Returns
| Year | Small-Cap Value | S&P 500 | Excess |
|---|---|---|---|
| 2000 | +64.88% | -14.78% | +79.66% |
| 2001 | +6.12% | -20.77% | +26.89% |
| 2002 | -24.16% | +3.29% | -27.45% |
| 2003 | +43.76% | +16.44% | +27.32% |
| 2004 | -23.95% | +7.94% | -31.89% |
| 2005 | -11.78% | +8.86% | -20.64% |
| 2006 | +132.53% | +20.95% | +111.58% |
| 2007 | +7.65% | -13.71% | +21.36% |
| 2008 | -28.62% | -26.14% | -2.49% |
| 2009 | +45.67% | +13.42% | +32.26% |
| 2010 | -24.28% | +32.94% | -57.22% |
| 2011 | -22.18% | +4.10% | -26.28% |
| 2012 | +21.83% | +20.85% | +0.98% |
| 2013 | +29.73% | +24.50% | +5.23% |
| 2014 | +107.37% | +7.38% | +99.99% |
| 2015 | +4.73% | +3.36% | +1.37% |
| 2016 | +7.30% | +17.73% | -10.42% |
| 2017 | -28.90% | +14.34% | -43.24% |
| 2018 | -4.85% | +10.91% | -15.76% |
| 2019 | +2.50% | +7.12% | -4.62% |
| 2020 | +6.47% | +40.68% | -34.21% |
| 2021 | +0.61% | -10.17% | +10.78% |
| 2022 | -23.63% | +18.31% | -41.94% |
| 2023 | +5.06% | +24.60% | -19.54% |
| 2024 | +15.05% | +14.67% | +0.38% |
Backtest Methodology
| Parameter | Choice |
|---|---|
| Universe | SHZ + SHH, small-cap range (~100M-4B) |
| Signal | P/B 0-1.5, ROE > 5%, D/E < 2.5 |
| Portfolio | Top 30 by P/B ascending, equal weight |
| Rebalancing | Annual (July) |
| Cash rule | Hold cash if < 10 qualify |
| Benchmark | SSE Composite Total Return |
| Execution | Next-day close (MOC) |
| Period | 2000-2025 (25 years) |
| Data | Point-in-time (45-day lag) |
Limitations
Extreme volatility. The Sharpe ratio (0.238) is low despite the high excess return (+10.19%). The volatility of the A-share market means the returns come with a rough ride.
Policy dependency. China's equity market is uniquely driven by government policy. Interest rate decisions, margin lending rules, IPO suspensions, and regulatory campaigns can swing the market 20-30% in a quarter. This isn't captured by historical volatility measures, which assume returns are drawn from a stable distribution.
Deep negative years. The 12.62% CAGR requires holding through -28.90% years (2017) and -24.28% years (2010) without capitulating. That's a psychological challenge most investors can't sustain.
Thin portfolio. 15.4 stocks on average, well below the 30-stock target. The P/B < 1.5 and ROE > 5% filters are restrictive in China's market structure. Many A-share companies have high P/B ratios (retail speculation) or negative ROE (state-owned enterprises with poor profitability).
A-share market structure. Retail investors dominate trading volume (~80%). This creates momentum-driven boom-bust cycles that overwhelm fundamental signals. The P/B value screen works over the full 25-year period, but the path is far rougher than in institutional-dominated markets.
Capital controls. Foreign investors face QFII/RQFII quotas and Stock Connect restrictions. The backtest assumes frictionless access, but real-world implementation involves regulatory hurdles for non-Chinese investors.
Survivorship bias. A-share delistings, suspensions, and shell company purges mean the historical universe is incomplete.
Takeaway
China delivered 12.62% CAGR and +10.19% excess return over the SSE Composite. Those numbers are real and substantial. The SSE Composite managed just 2.43% CAGR, making this one of the largest excess returns of any exchange we tested. But no other exchange in our dataset required this much volatility to achieve similar results.
The A-share market's policy-driven nature creates two signature patterns. Bull markets are explosive: +132.53% in 2006, +107.37% in 2014. Bear markets are brutal: -57.63% max drawdown. The small-cap value premium exists in China, but it's buried under layers of policy risk, retail speculation, and regulatory uncertainty.
The 72% win rate against the SSE Composite is strong. The strategy beats its local benchmark in nearly three out of four years, reflecting the consistent premium over a market that has largely gone nowhere over 25 years.
For investors who can tolerate extreme volatility and have a genuine 10+ year horizon, Chinese small-cap value offers diversification and high absolute returns. For most investors, the UK, Taiwan, or US versions of this screen deliver comparable or better excess returns with a fraction of the volatility.
Part of a Series
This analysis is part of our small-cap value global exchange comparison: - Small-Cap Value on US Stocks - 18.28% CAGR, the flagship - Small-Cap Value on UK Stocks - Best risk-adjusted (0.750 Sharpe) - Small-Cap Value on Indian Stocks - 20.89% CAGR, highest globally - Small-Cap Value: 14-Exchange Global Comparison - All 14 beat their local benchmark
References
- Fama, E. & French, K. (1993). "Common Risk Factors in the Returns on Stocks and Bonds." Journal of Financial Economics, 33(1), 3-56.
- Israel, R. & Moskowitz, T. (2013). "The Role of Shorting, Firm Size, and Time on Market Anomalies." Journal of Financial Economics, 108(2), 275-301.
- Carpenter, J., Lu, F. & Whitelaw, R. (2021). "The Real Value of China's Stock Market." Journal of Financial Economics, 139(3), 679-696.
Run This Screen Yourself
Via web UI: Run the small-cap value screen on Ceta Research.
Get your API key at cetaresearch.com. The full backtest code (Python + DuckDB) is on GitHub.
Data: Ceta Research, FMP financial data warehouse. Universe: SHZ + SHH small caps. Annual rebalance (July), equal weight top 30, 2000-2025. Returns in CNY.
Past performance does not guarantee future results. This is educational content, not investment advice.


