
Small-Cap Value on Japanese Stocks: 8.13% CAGR and the Original Fama-French Value Market
We backtested small-cap value on Japanese stocks (JPX) from 2000 to 2025. 8.13% CAGR vs 3.31% for the Nikkei 225. Japan was the original Fama-French value market, and the premium still shows up: +4.82% annual excess, 0.364 Sharpe.

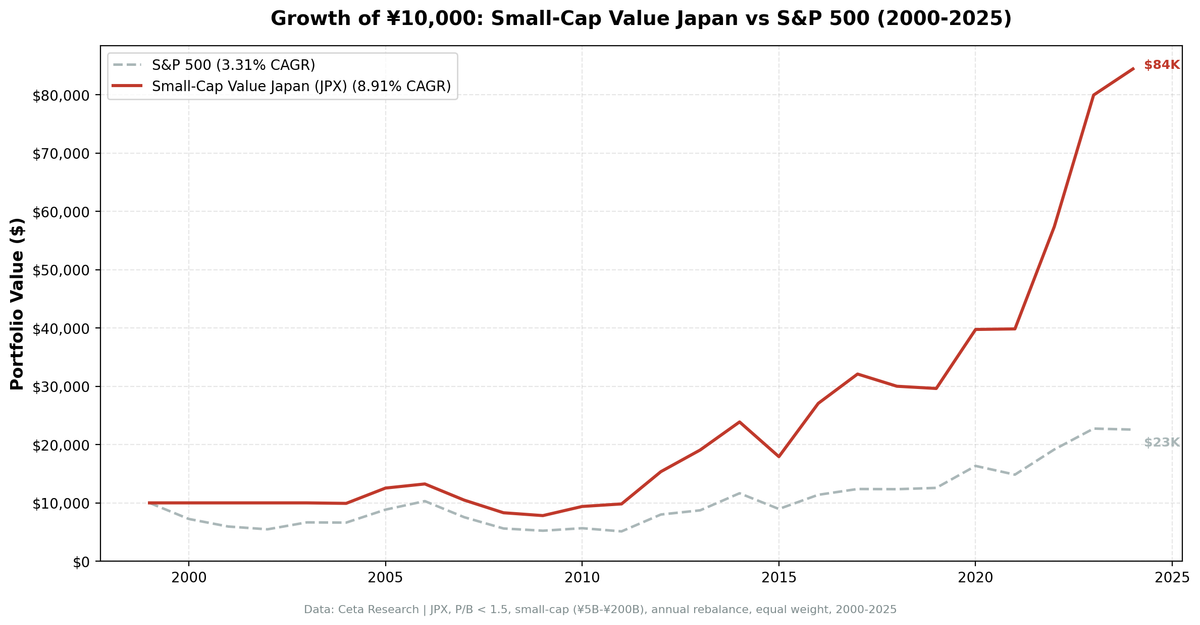
We backtested a small-cap value screen on the Tokyo Stock Exchange (JPX) from 2000 to 2025. Buy the 30 cheapest small-cap stocks by Price-to-Book ratio, require ROE > 5% and D/E < 2.5, rebalance annually in July. The result: 8.13% CAGR vs 3.31% for the Nikkei 225, with +4.82% annual excess return. Japan was the original proving ground for value investing research, and the premium still shows up in the data.
Contents
- Method
- What is Small-Cap Value?
- What We Found
- 8.13% CAGR. +4.82% excess return per year over the Nikkei 225.
- Year-by-year returns
- 2022: +54.73%, the best single year
- 2016: +48.56% on the Abenomics tailwind
- 2005: +33.44% during the mid-2000s recovery
- Where it struggles: 2015 and 2019
- When It Works
- When It Fails
- Full Annual Returns
- Backtest Methodology
- Limitations
- Takeaway
- Part of a Series
- References
- Run This Screen Yourself
Data: FMP financial data warehouse, 2000–2025. Updated March 2026.
Method
Data source: Ceta Research (FMP financial data warehouse) Universe: JPX (Tokyo Stock Exchange), small-cap range (market cap ~5B-200B) Period: 2000-2025 (25 years, annual rebalance in July) Rebalancing: Annual (July), equal weight top 30 by P/B ascending Benchmark: Nikkei 225 Total Return (3.31% CAGR) Cash rule: Hold cash if fewer than 10 stocks qualify Execution: Next-day close (MOC) Currency: Returns in JPY
45-day lag on financial data to prevent look-ahead bias. Trades execute at the next trading day's close after signal generation.
What is Small-Cap Value?
Japan holds a special place in value investing history. Fama and French (1993) found that the value premium was even stronger in Japan than in the US. Chan, Hamao, and Lakonishok (1991) documented that Japanese stocks with low P/B ratios outperformed growth stocks by wider margins than their American counterparts. This screen tests whether that premium persists in the small-cap segment of JPX.
Filters:
| Criterion | Metric | Threshold |
|---|---|---|
| Valuation | Price-to-Book | 0 to 1.5 |
| Profitability | Return on Equity | > 5% |
| Leverage | Debt-to-Equity | < 2.5 |
| Size | Market Cap | Small-cap range (~5B-200B) |
Ranking: P/B ascending, top 30 stocks.
Three filters working together. P/B < 1.5 finds stocks near or below book value. ROE > 5% removes distressed firms cheap for good reasons. D/E < 2.5 keeps overleveraged balance sheets out. In Japan, where corporate cash hoarding and cross-shareholdings distort book values, these quality filters matter more than in most markets.
What We Found

8.13% CAGR. +4.82% excess return per year over the Nikkei 225.
| Metric | Small-Cap Value (Japan) | Nikkei 225 |
|---|---|---|
| CAGR | 8.13% | 3.31% |
| Excess vs Nikkei | +4.82% | - |
| Max Drawdown | -43.35% | - |
| Sharpe Ratio | 0.364 | - |
| Win Rate | 64% | - |
| Avg Stocks per Period | 27.8 | - |
| Cash Periods | 4 of 25 (16%) | - |
The excess return (+4.82% per year over the Nikkei 225) is substantial. The Sharpe ratio of 0.364 reflects a meaningful risk-adjusted premium over the local market.
The max drawdown (-43.35%) is deep. Japan's lost decades, the deflationary grind from 1990 through the early 2000s, weighed on all Japanese equities including small-cap value. The strategy had to fight structural headwinds. But relative to the Nikkei 225's meager 3.31% CAGR, the strategy delivered nearly triple the return.
Year-by-year returns
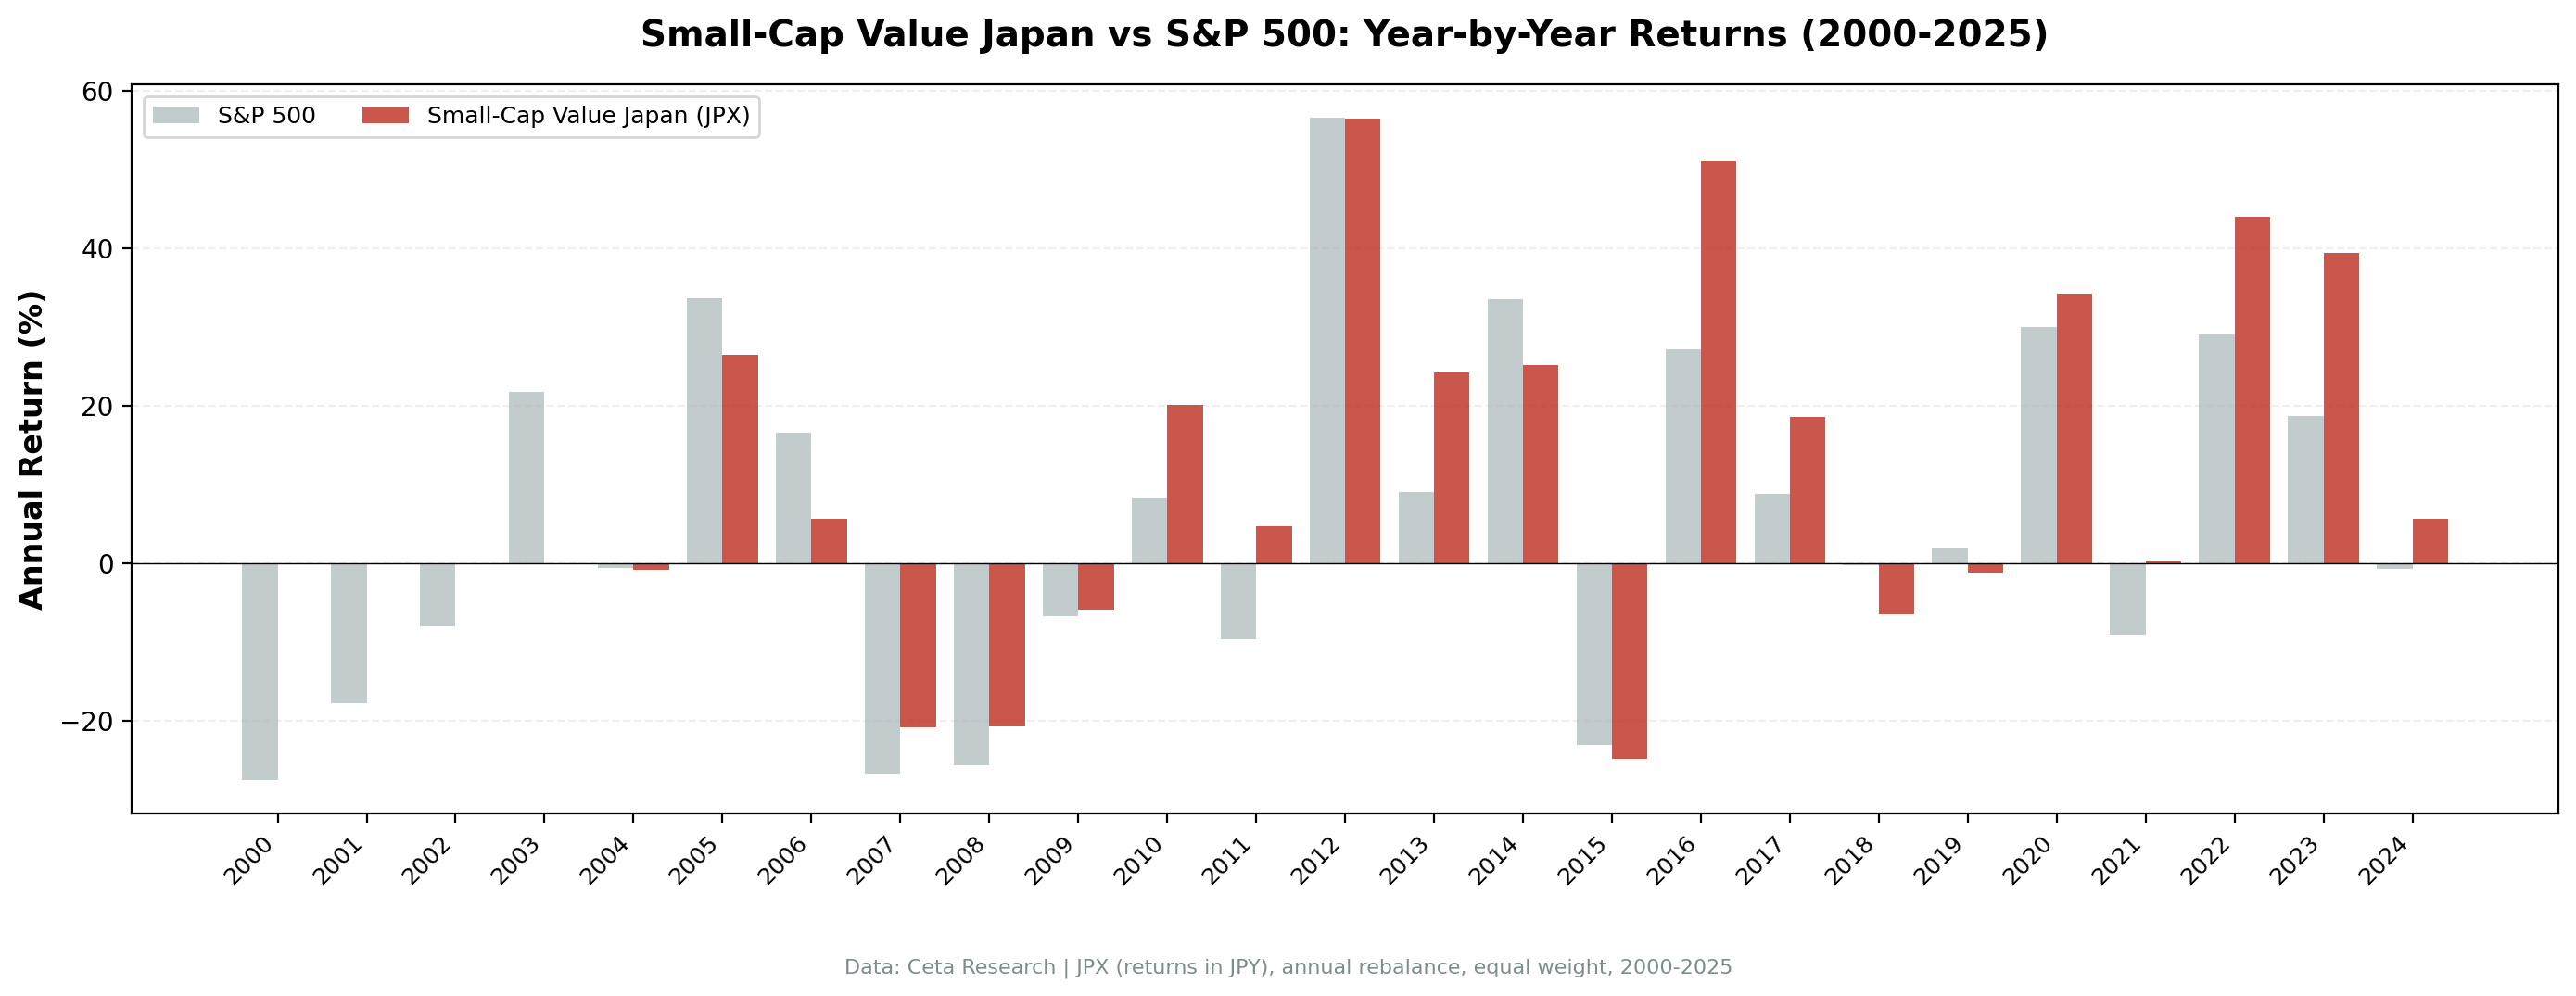
The highlights and lowlights tell the story of Japan's boom-bust cycles.
| Year | Small-Cap Value (Japan) | S&P 500 | Excess |
|---|---|---|---|
| 2005 | +33.44% | +8.86% | +24.59% |
| 2016 | +48.56% | +17.73% | +30.82% |
| 2022 | +54.73% | +18.31% | +36.43% |
| 2013 | +27.12% | +24.50% | +2.62% |
| 2015 | -21.35% | +3.36% | -24.71% |
| 2019 | -10.36% | +7.12% | -17.48% |
| 2009 | -2.99% | +13.42% | -16.41% |
2022: +54.73%, the best single year
Japan's small-cap value stocks surged in 2022 while global markets struggled. The weak yen boosted export-oriented manufacturers. Many small Japanese industrials generate revenue in USD and EUR while reporting in JPY. Their earnings expanded mechanically as the yen fell from 115 to 150. Meanwhile, low P/B stocks in Japan were already deeply undervalued after years of neglect. The rerating was sharp.
2016: +48.56% on the Abenomics tailwind
The Bank of Japan's negative interest rate policy and corporate governance reform push drove a broad rerating of Japanese equities. Small-cap value was the primary beneficiary. Companies that had hoarded cash and traded below book value for a decade suddenly looked attractive to both domestic and foreign investors. The governance reforms pressured management to improve ROE and return capital, exactly what this screen selects for.
2005: +33.44% during the mid-2000s recovery
Japan's deflationary trap briefly loosened. Corporate earnings recovered, banks cleaned up bad loans, and domestic demand stabilized. Small-cap value stocks that had been priced for permanent stagnation repriced quickly when the macro environment improved.
Where it struggles: 2015 and 2019
The worst years were 2015 (-21.35%) and 2019 (-10.36%). Both were years where US growth stocks dominated global returns. When capital flows into mega-cap tech, small-cap value in Japan gets ignored entirely. The 2015 drawdown also coincided with China's stock market crash and devaluation fears, which hit Japanese exporters hard.
When It Works
- Yen weakness. Export-heavy small industrials earn more in local currency terms when the yen falls. 2022 was the clearest example.
- Governance reform waves. Abenomics, the Tokyo Stock Exchange's 2023 P/B reform push. When Japan pressures companies to improve capital efficiency, sub-book-value stocks rerate.
- Global risk-off environments. 2022 saw Japan outperform while US and European markets fell. Japan's low correlation to global growth-stock selloffs provides diversification.
- Post-crisis recoveries. 2005, 2012, 2016. When compressed valuations normalize, the cheapest stocks move the most.
When It Fails
- US growth rallies. 2019, 2020, 2023. When mega-cap tech drives global returns, Japanese small-cap value gets left behind.
- China shocks. 2015's China devaluation scare hit Japanese exporters. Japan's trade dependence on China means Chinese economic weakness transmits directly.
- Yen strength. The inverse of the tailwind. When the yen strengthens, export earnings compress and small-cap industrials underperform.
- Deflation resumption. Japan's structural deflationary risk suppresses nominal returns. If deflation returns, P/B compression can continue rather than reverse.
Full Annual Returns
| Year | Small-Cap Value | S&P 500 | Excess |
|---|---|---|---|
| 2000 | 0.00% (cash) | -14.78% | +14.78% |
| 2001 | 0.00% (cash) | -20.77% | +20.77% |
| 2002 | 0.00% (cash) | +3.29% | -3.29% |
| 2003 | 0.00% (cash) | +16.44% | -16.44% |
| 2004 | +4.68% | +7.94% | -3.26% |
| 2005 | +33.44% | +8.86% | +24.59% |
| 2006 | +4.41% | +20.95% | -16.54% |
| 2007 | -21.35% | -13.71% | -7.64% |
| 2008 | -14.79% | -26.14% | +11.35% |
| 2009 | -2.99% | +13.42% | -16.41% |
| 2010 | +10.84% | +32.94% | -22.10% |
| 2011 | -4.89% | +4.10% | -8.99% |
| 2012 | +21.70% | +20.85% | +0.85% |
| 2013 | +27.12% | +24.50% | +2.62% |
| 2014 | +14.15% | +7.38% | +6.77% |
| 2015 | -21.35% | +3.36% | -24.71% |
| 2016 | +48.56% | +17.73% | +30.82% |
| 2017 | +25.44% | +14.34% | +11.10% |
| 2018 | +1.93% | +10.91% | -8.98% |
| 2019 | -10.36% | +7.12% | -17.48% |
| 2020 | +24.49% | +40.68% | -16.19% |
| 2021 | +10.19% | -10.17% | +20.36% |
| 2022 | +54.73% | +18.31% | +36.43% |
| 2023 | +15.80% | +24.60% | -8.80% |
| 2024 | +1.56% | +14.67% | -13.11% |
Backtest Methodology
| Parameter | Choice |
|---|---|
| Universe | JPX, small-cap range (~5B-200B) |
| Signal | P/B 0-1.5, ROE > 5%, D/E < 2.5 |
| Portfolio | Top 30 by P/B ascending, equal weight |
| Rebalancing | Annual (July) |
| Cash rule | Hold cash if < 10 qualify |
| Benchmark | Nikkei 225 Total Return |
| Execution | Next-day close (MOC) |
| Period | 2000-2025 (25 years) |
| Data | Point-in-time (45-day lag) |
Limitations
Four cash periods. 2000-2003 had insufficient qualifying stocks, likely due to data coverage gaps for Japanese small caps in FMP's historical data. The strategy missed the dot-com crash entirely (a benefit) but also missed the 2003 recovery.
Same-currency comparison. Returns in JPY, benchmarked against the Nikkei 225 (also in JPY). This is an apples-to-apples comparison.
Cross-shareholding distortion. Japanese companies historically hold stakes in each other, inflating book values. The P/B signal is noisier in Japan than in markets without this practice. Governance reforms have reduced cross-shareholdings, but the distortion still existed in the earlier years.
Max drawdown is real. -43.35% is a deep drawdown. Japan's structural headwinds (deflation, aging demographics, slow growth) create a challenging backdrop for all Japanese equities.
Win rate is 64%. The strategy beats the Nikkei 225 in roughly two out of three years. The excess return is spread across multiple outperformance years, not concentrated in just a few.
Survivorship bias. JPX has seen delistings and mergers over 25 years. Current profiles may not fully represent the historical universe.
Takeaway
Japan produced a strong +4.82% annual excess return over the Nikkei 225. Measured against the local benchmark, the outperformance is clear. The Fama-French value premium was discovered partly using Japanese data, and 25 years later, the signal still exists.
The Sharpe ratio (0.364) reflects the risk-adjusted premium. Japan's small-cap value stocks delivered meaningful returns in a market where the Nikkei 225 managed just 3.31% CAGR. The "lost decades" dragged absolute performance, but the value premium persisted through deflation, stagnation, and demographic decline.
For investors seeking Japan exposure, small-cap value provides a systematic edge over broad Japanese equity indices. The yen sensitivity cuts both ways, and the 64% win rate means the strategy beats the Nikkei in nearly two out of three years. The strategy works over full cycles, particularly when governance reform or yen weakness creates catalysts for sub-book-value stocks to rerate.
Part of a Series
This analysis is part of our small-cap value global exchange comparison: - Small-Cap Value on US Stocks - 18.28% CAGR, the flagship - Small-Cap Value on UK Stocks - Best risk-adjusted (0.750 Sharpe) - Small-Cap Value on Indian Stocks - 20.89% CAGR, highest globally - Small-Cap Value: 14-Exchange Global Comparison - All 14 beat their local benchmark
References
- Fama, E. & French, K. (1993). "Common Risk Factors in the Returns on Stocks and Bonds." Journal of Financial Economics, 33(1), 3-56.
- Chan, L., Hamao, Y. & Lakonishok, J. (1991). "Fundamentals and Stock Returns in Japan." Journal of Finance, 46(5), 1739-1764.
- Israel, R. & Moskowitz, T. (2013). "The Role of Shorting, Firm Size, and Time on Market Anomalies." Journal of Financial Economics, 108(2), 275-301.
Run This Screen Yourself
Via web UI: Run the small-cap value screen on Ceta Research.
Get your API key at cetaresearch.com. The full backtest code (Python + DuckDB) is on GitHub.
Data: Ceta Research, FMP financial data warehouse. Universe: JPX small caps. Annual rebalance (July), equal weight top 30, 2000-2025. Returns in JPY.
Past performance does not guarantee future results. This is educational content, not investment advice.


