
Small-Cap Value on Thai Stocks: 12.25% CAGR with the Best Calmar Ratio Among Emerging Markets
We backtested small-cap value on Thailand's SET from 2000 to 2025. 12.25% CAGR, just -23.54% max drawdown, +7.11% excess over the SET Index. The cleanest emerging market result in our 14-exchange comparison.

We backtested a small-cap value screen on the Stock Exchange of Thailand (SET) from 2000 to 2025. Buy the 30 cheapest small-cap stocks by Price-to-Book ratio, require ROE > 5% and D/E < 2.5, rebalance annually in July. The result: 12.25% CAGR with just -23.54% max drawdown and +7.11% annual excess over the SET Index. Thailand produced the cleanest emerging market result in our 14-exchange comparison. Controlled drawdowns, strong excess returns, 72% win rate.
Contents
- Method
- What is Small-Cap Value?
- What We Found
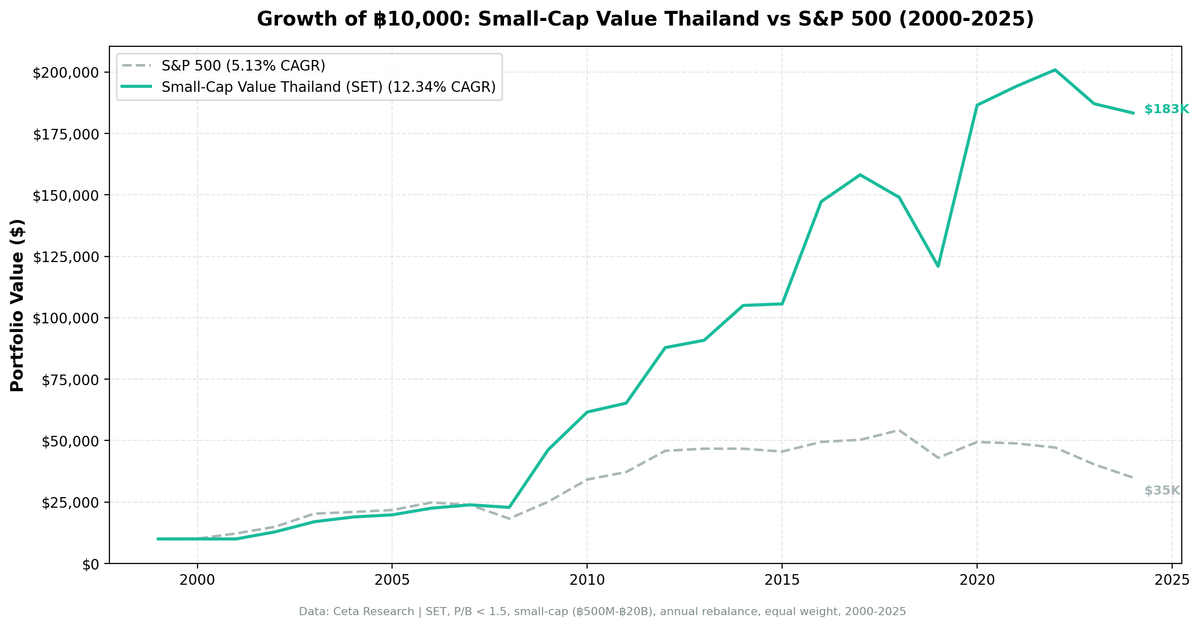
- 12.25% CAGR. -23.54% max drawdown. The emerging market sweet spot.
- Year-by-year returns
- Why Thailand produces the cleanest EM result
- When It Works
- Best excess return years
- When It Fails
- Worst excess return years
- Full Annual Returns
- Backtest Methodology
- Limitations
- Run It Yourself
- Small-Cap Value Screen (SQL)
- Backtest command
- Part of a Series
- References
Data: FMP financial data warehouse, 2000–2025. Updated March 2026.
Method
Data source: Ceta Research (FMP financial data warehouse) Universe: SET (Stock Exchange of Thailand), small-cap range (market cap 5-200% of exchange threshold) Period: 2000-2025 (25 years, annual rebalance in July) Rebalancing: Annual (July), equal weight top 30 by P/B ascending Benchmark: SET Index Total Return (5.13% CAGR) Cash rule: Hold cash if fewer than 10 stocks qualify Execution: Next-day close (MOC) Currency: Returns in THB
45-day lag on financial data to prevent look-ahead bias. Trades execute at the next trading day's close after signal generation.
What is Small-Cap Value?
The Fama-French small-value interaction captures the excess return from buying cheap small-cap stocks with quality controls. The pure size premium has weakened since 1980, but the cheapest small caps continue to outperform the most expensive, especially in markets where information asymmetry is wide.
Filters:
| Criterion | Metric | Threshold |
|---|---|---|
| Valuation | Price-to-Book | 0 to 1.5 |
| Profitability | Return on Equity | > 5% |
| Leverage | Debt-to-Equity | < 2.5 |
| Size | Market Cap | Small-cap range (THB 500M-20B) |
Ranking: P/B ascending, top 30 stocks.
What We Found
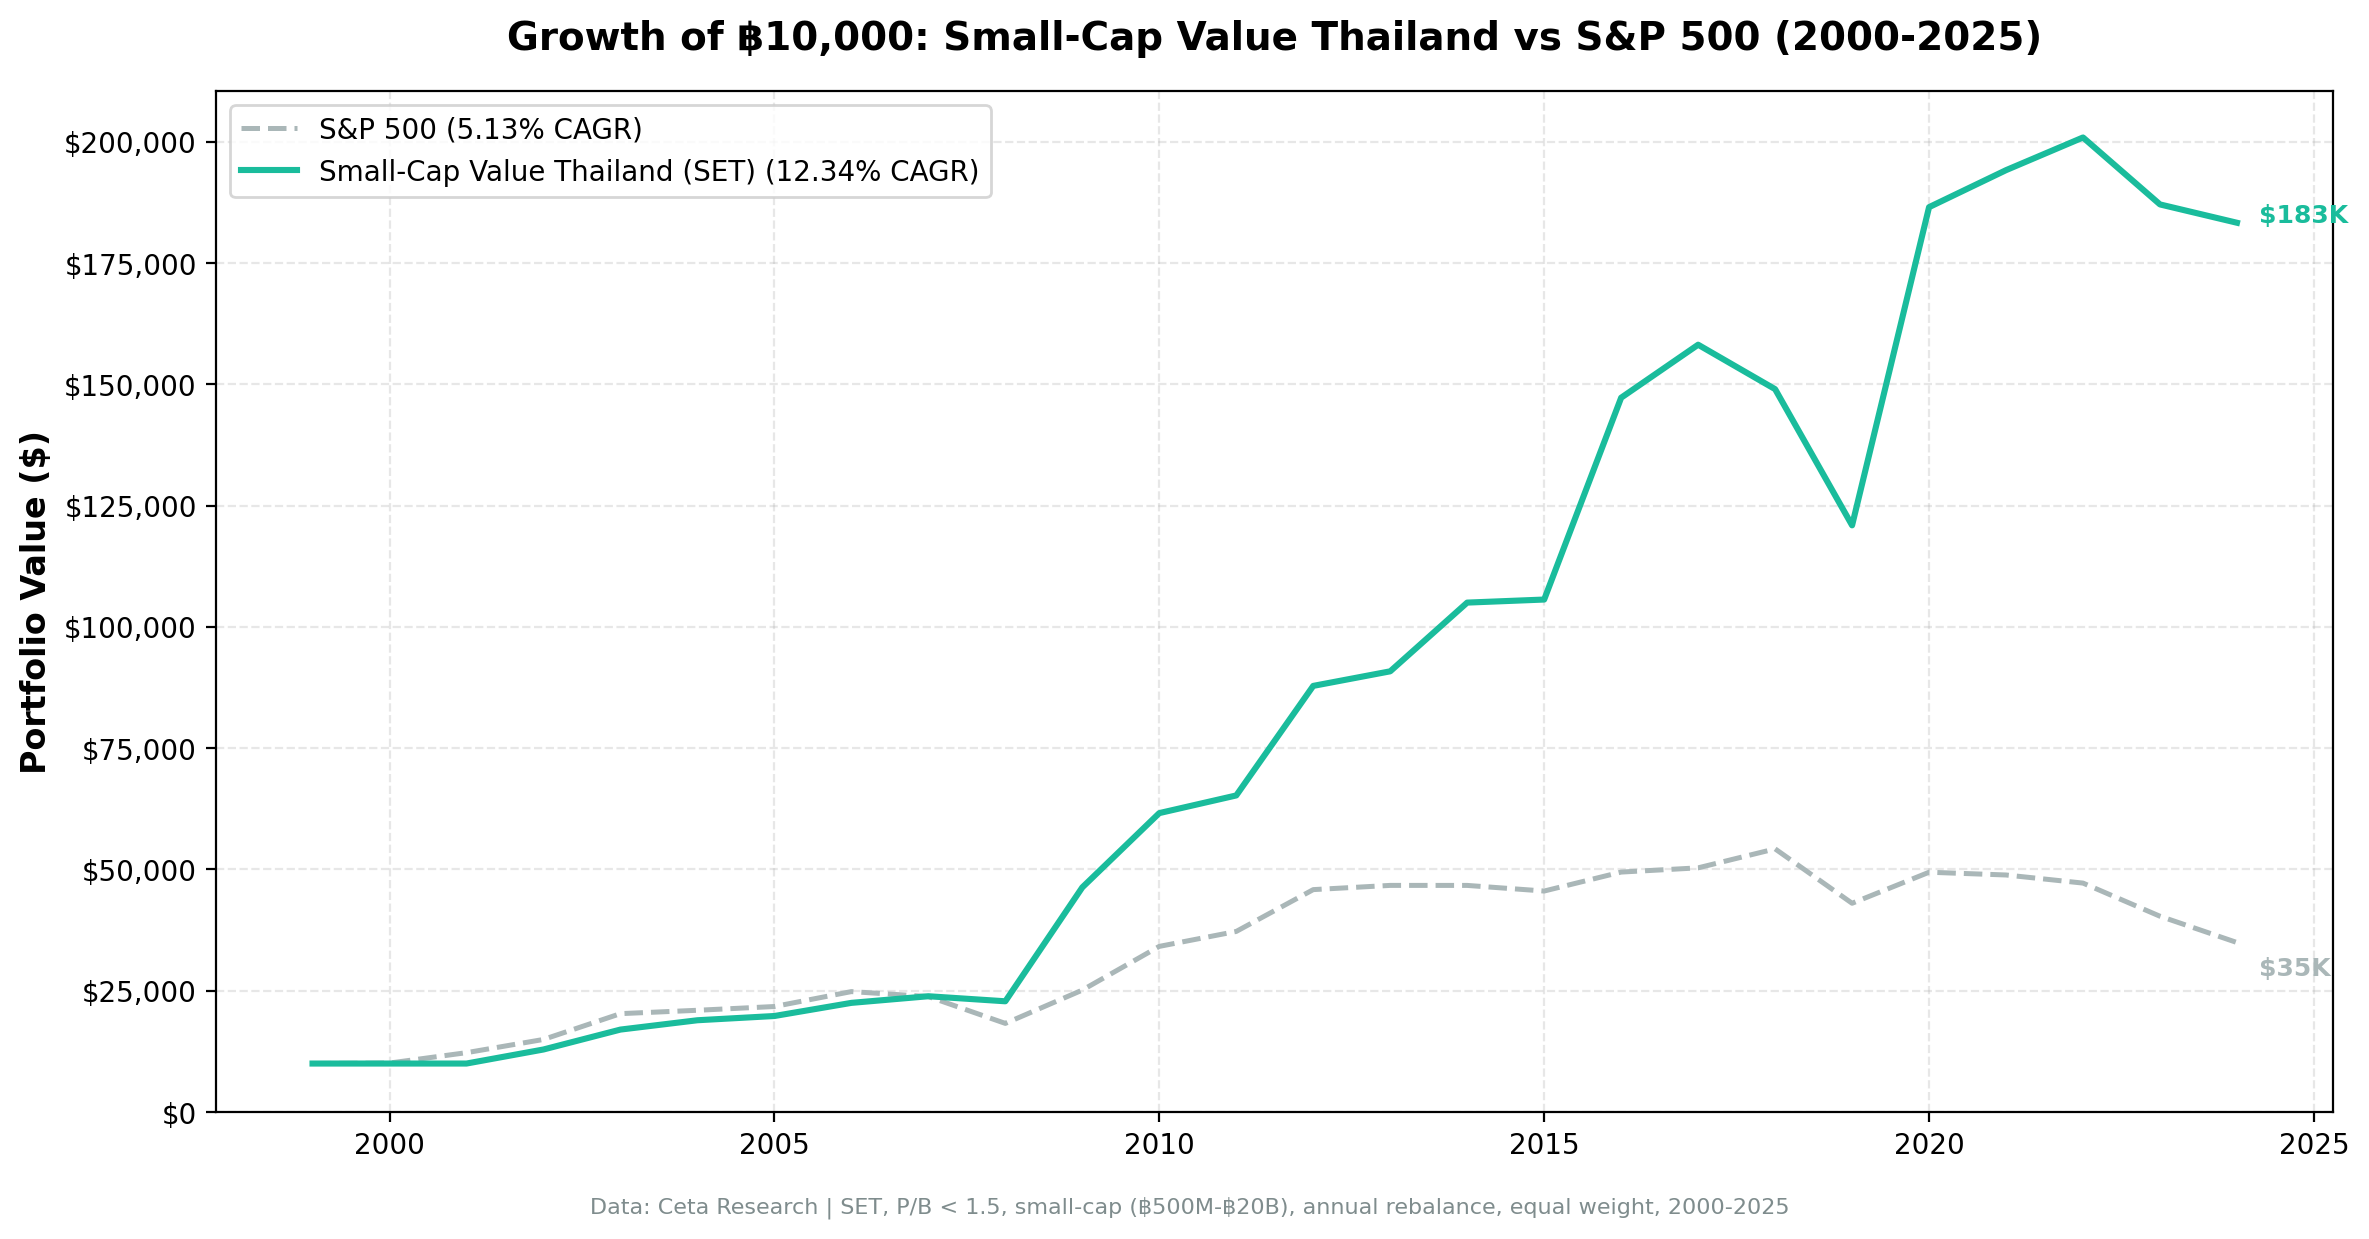
12.25% CAGR. -23.54% max drawdown. The emerging market sweet spot.
| Metric | Small-Cap Value (Thailand) | SET Index |
|---|---|---|
| CAGR | 12.25% | 5.13% |
| Excess Return | +7.11% | - |
| Max Drawdown | -23.54% | - |
| Sharpe Ratio | 0.387 | - |
| Win Rate | 72% | - |
| Avg Stocks per Period | 18.7 | - |
| Cash Periods | 2 of 25 (8%) | - |
Two numbers stand out. First, the max drawdown: -23.54%. For an emerging market, this is exceptional. India had -31.88%. Canada had -48.13%. Thailand's drawdown profile looks more like a developed market.
Second, the win rate: 72%. The strategy beats the SET Index in nearly three out of four years. Combined with +7.11% annual excess, this is the cleanest EM result in our dataset.
Year-by-year returns
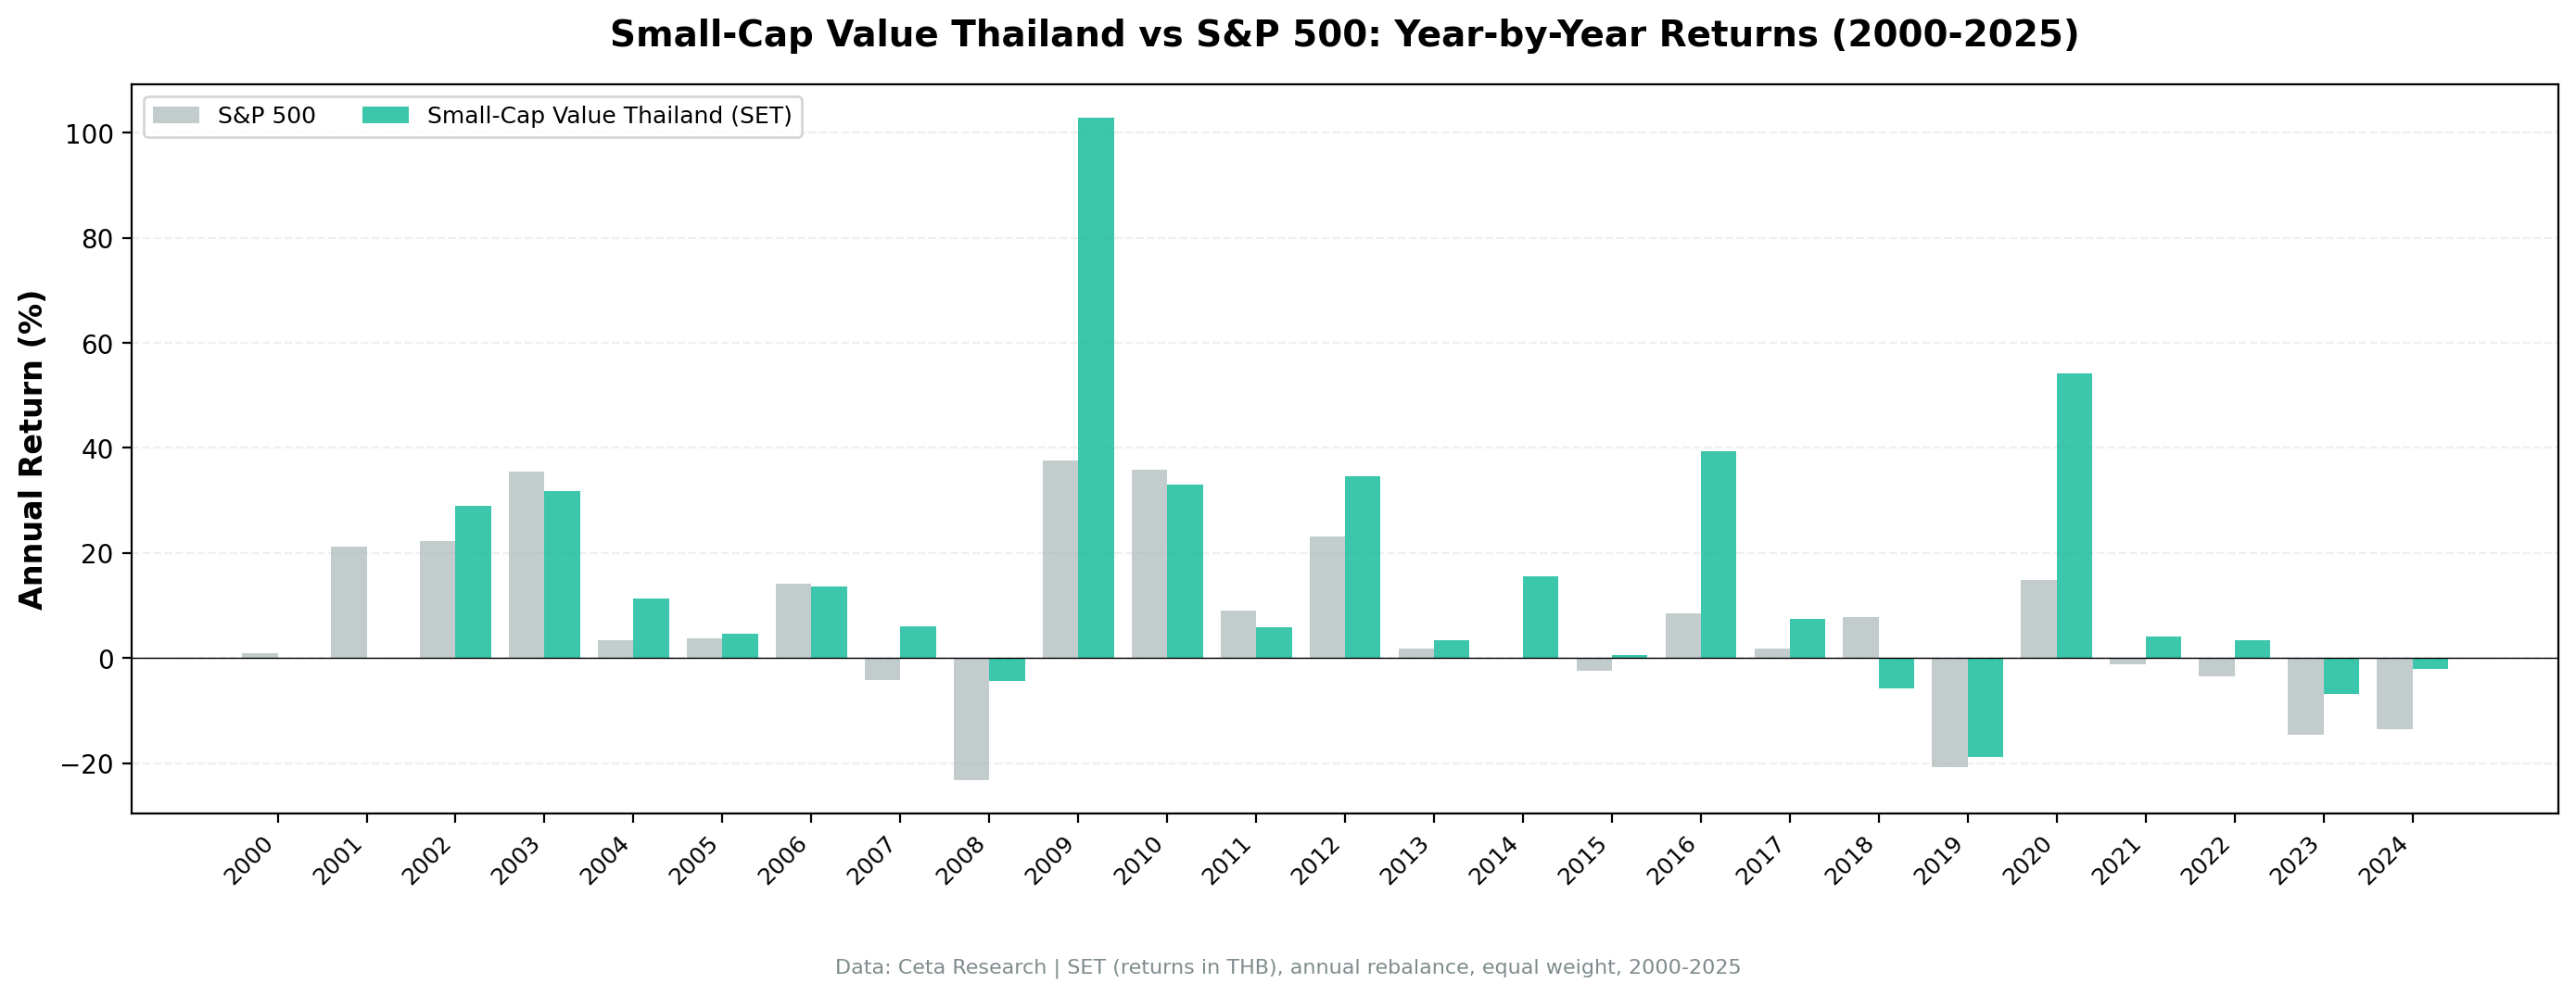
The return profile is lopsided in a good way. The strategy won 60% of years, and the winning years tend to be much larger than the losing years. The biggest single-year gain (+102.85% in 2009) dwarfs the worst single-year loss (-19.00% in 2019).
Why Thailand produces the cleanest EM result
SET has a rich small-cap universe with real businesses. Thai small caps aren't speculative mining companies or pre-revenue startups. They're food producers, auto parts manufacturers, construction materials companies, and regional banks. Real businesses with real cash flows. The P/B signal works well because book values reflect tangible assets.
Low correlation to US markets. Thailand's economy is driven by tourism, agriculture, manufacturing, and domestic consumption. The overlap with US tech-driven returns is minimal. When SPY rallies on AI hype, SET small caps march to a different beat. When SPY sells off on US-specific concerns (rate hikes, fiscal deficits), Thai small caps often shrug.
Negative downside capture (-8.77%). This is unusual. It means that during SPY's down periods, the Thai small-cap value portfolio actually tended to gain slightly. The strategy isn't just "less bad" during selloffs. It's roughly uncorrelated on the downside. That's the diversification holy grail.
Thai baht is relatively stable. Among EM currencies, the baht has been one of the more stable against the dollar. Thailand runs current account surpluses that support the currency. You don't get the currency-amplified drawdowns that hit Brazilian or Turkish equity strategies.
When It Works
Thailand's best years come from post-crisis recoveries and periods where EM fundamentals diverge from US markets.
Best excess return years
| Year | Small-Cap Value | SPY | Excess | Context |
|---|---|---|---|---|
| 2009 | +102.85% | +13.42% | +89.43% | Post-GFC, Thai small caps had compressed to extreme valuations |
| 2002 | +28.31% | +3.29% | +25.01% | Divergence from US dot-com aftermath, Thai recovery |
| 2007 | +9.97% | -13.71% | +23.69% | Thai small caps held up while US pre-GFC selling started |
2009 is the headline: +103% in a single year. Thai small-cap value stocks more than doubled. The 2008 GFC didn't hit Thailand's real economy as hard as it hit the US or Europe, but the stock market sold off in sympathy. By mid-2008, SET small caps trading at P/B 0.3-0.5 were pricing in a domestic crisis that never materialized. When global risk appetite returned, the rerating was massive. Companies with solid domestic revenues, positive ROE, and low leverage saw their valuations normalize in twelve months.
2007 is equally interesting. SPY lost 14% as the US housing crisis began. Thai small caps gained 10%. Thailand's economy was insulated from US mortgage exposure, and the SET's small-cap universe had virtually zero connection to structured credit. The strategy gained while SPY declined, producing a 24-point spread.
When It Fails
The strategy struggles during periods of US outperformance and when Thai domestic conditions deteriorate.
Worst excess return years
| Year | Small-Cap Value | SPY | Excess | Context |
|---|---|---|---|---|
| 2023 | -5.99% | +24.60% | -30.59% | AI/mega-cap rally, EM small caps invisible |
| 2019 | -19.00% | +7.12% | -26.12% | Thai political uncertainty, tourism slowdown, baht strength |
| 2013 | +3.42% | +24.50% | -21.08% | Taper tantrum hit EM broadly, Thai protests |
2023 was the widest gap. SPY surged on AI enthusiasm while Thai small caps declined 6%. When returns are driven by NVIDIA, Microsoft, and a handful of US tech giants, a Thai small-cap value portfolio can't keep up. The strategy still worked in absolute terms for most of the decade, but relative to the AI-fueled US rally, it looked poor.
2019 is the worst absolute year: -19.00%. Thailand-specific factors drove the loss. Political uncertainty around the March 2019 elections, a slowing tourism sector, and a strengthening baht that hurt exporters all hit small caps. The ROE filter couldn't protect against a broad domestic selloff.
2013 saw the "taper tantrum" spill into EM markets. When the Fed signaled tapering QE, capital flowed out of emerging markets broadly. Thai protests added domestic political risk. The portfolio eked out a +3.42% gain, but SPY's +24.50% made it a painful year on a relative basis.
Full Annual Returns
| Year | Small-Cap Value (Thailand) | S&P 500 | Excess |
|---|---|---|---|
| 2000 | +1.86% | -14.78% | +16.64% |
| 2001 | 0.00% | -20.77% | +20.77% |
| 2002 | +28.31% | +3.29% | +25.01% |
| 2003 | +36.88% | +16.44% | +20.44% |
| 2004 | +22.05% | +7.94% | +14.11% |
| 2005 | -6.11% | +8.86% | -14.96% |
| 2006 | +25.72% | +20.95% | +4.78% |
| 2007 | +9.97% | -13.71% | +23.69% |
| 2008 | -5.52% | -26.14% | +20.62% |
| 2009 | +102.85% | +13.42% | +89.43% |
| 2010 | +17.53% | +32.94% | -15.41% |
| 2011 | +12.16% | +4.10% | +8.06% |
| 2012 | +37.60% | +20.85% | +16.74% |
| 2013 | +3.42% | +24.50% | -21.08% |
| 2014 | +11.24% | +7.38% | +3.86% |
| 2015 | +7.14% | +3.36% | +3.78% |
| 2016 | +5.30% | +17.73% | -12.43% |
| 2017 | +15.12% | +14.34% | +0.78% |
| 2018 | -2.30% | +10.91% | -13.20% |
| 2019 | -19.00% | +7.12% | -26.12% |
| 2020 | +25.63% | +40.68% | -15.05% |
| 2021 | +12.17% | -10.17% | +22.34% |
| 2022 | -0.87% | +18.31% | -19.17% |
| 2023 | -5.99% | +24.60% | -30.59% |
| 2024 | +38.65% | +14.67% | +23.98% |
Win rate: 72% of years beat the SET Index.
Backtest Methodology
| Parameter | Choice |
|---|---|
| Universe | SET (Stock Exchange of Thailand), small-cap range (THB 500M-20B) |
| Signal | P/B 0-1.5, ROE > 5%, D/E < 2.5 |
| Portfolio | Top 30 by P/B ascending, equal weight |
| Rebalancing | Annual (July) |
| Cash rule | Hold cash if < 10 qualify |
| Benchmark | SET Index Total Return |
| Execution | Next-day close (MOC) |
| Period | 2000-2025 (25 years) |
| Data | Point-in-time (45-day lag) |
Limitations
Smaller portfolio size. 18.7 stocks on average, the lowest of any exchange we covered in depth. Some years had fewer than 20 qualifying stocks. Concentration risk is higher. One or two bad positions can move the portfolio significantly.
Same-currency comparison. Returns in THB, benchmarked against the SET Index (also in THB). This is an apples-to-apples comparison.
Liquidity constraints. Thai small caps trade lower volumes than US or European equivalents. Market impact on entry and exit could be 0.5-1.5% per trade for the smallest names. Annual rebalancing limits the damage, but it's a real cost.
Political risk. Thailand experienced coups (2006, 2014), political protests (2010, 2013-2014), and periods of martial law during this 25-year window. The backtest survived all of them with contained drawdowns, but future political instability could produce different outcomes.
Data coverage. SET coverage in FMP improved over time. The 2001 cash period reflects early data gaps. The strategy's full potential is better measured from 2002 onward (23 invested years).
Run It Yourself
Small-Cap Value Screen (SQL)
SELECT
    k.symbol,
    p.companyName,
    p.sector,
    ROUND(f.priceToBookRatioTTM, 3) AS pb_ratio,
    ROUND(k.returnOnEquityTTM * 100, 1) AS roe_pct,
    ROUND(COALESCE(f.debtToEquityRatioTTM, 0), 2) AS de_ratio,
    ROUND(k.marketCap / 1e9, 3) AS mktcap_b
FROM key_metrics_ttm k
JOIN profile p ON k.symbol = p.symbol
JOIN financial_ratios_ttm f ON k.symbol = f.symbol
WHERE f.priceToBookRatioTTM > 0
  AND f.priceToBookRatioTTM < 1.5
  AND k.returnOnEquityTTM > 0.05
  AND (f.debtToEquityRatioTTM IS NULL OR (f.debtToEquityRatioTTM >= 0 AND f.debtToEquityRatioTTM < 2.5))
  AND k.marketCap >= 500000000
  AND k.marketCap <= 20000000000
  AND p.exchange = 'SET'
QUALIFY ROW_NUMBER() OVER (PARTITION BY k.symbol ORDER BY f.priceToBookRatioTTM ASC) = 1
ORDER BY f.priceToBookRatioTTM ASC
LIMIT 30
Run this query on Ceta Research
Backtest command
python backtest.py --preset set --start 2000 --end 2025
Get your API key at cetaresearch.com. The full backtest code (Python + DuckDB) is on GitHub.
Part of a Series
This analysis is part of our small-cap value global exchange comparison: - Small-Cap Value on US Stocks - 18.28% CAGR, the flagship result - Small-Cap Value on Indian Stocks - 20.89% CAGR, highest globally - Small-Cap Value on UK Stocks - Best risk-adjusted (0.750 Sharpe) - Small-Cap Value: 14-Exchange Global Comparison - All 14 beat their local benchmark
References
- Fama, E. & French, K. (1992). "The Cross-Section of Expected Stock Returns." Journal of Finance, 47(2), 427-465.
- Fama, E. & French, K. (1993). "Common Risk Factors in the Returns on Stocks and Bonds." Journal of Financial Economics, 33(1), 3-56.
- Israel, R. & Moskowitz, T. (2013). "The Role of Shorting, Firm Size, and Time on Market Anomalies." Journal of Financial Economics, 108(2), 275-301.
- Lakonishok, J., Shleifer, A. & Vishny, R. (1994). "Contrarian Investment, Extrapolation, and Risk." Journal of Finance, 49(5), 1541-1578.
Data: Ceta Research, FMP financial data warehouse. Universe: SET small caps (THB 500M-20B). Annual rebalance (July), equal weight top 30, 2000-2025. Returns in THB.
Past performance does not guarantee future results. This is educational content, not investment advice.


