
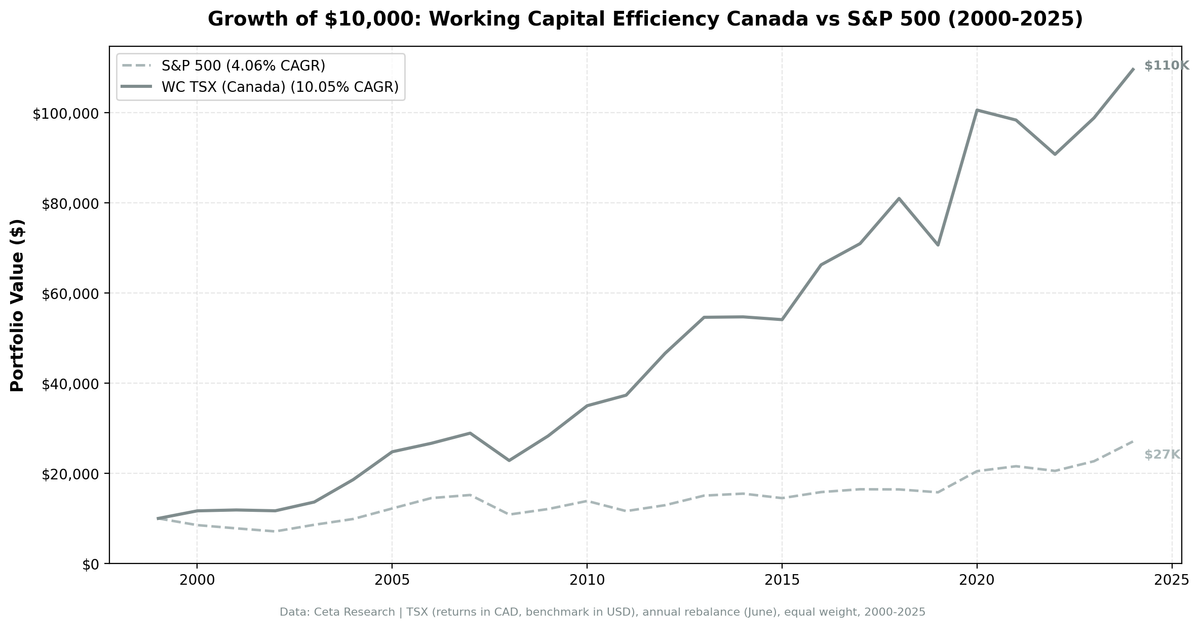
Working Capital Efficiency in Canada: 10.1% CAGR With the Lowest Drawdown We Tested
Canada produced the most defensive working capital efficiency portfolio across all 14 exchanges we tested. Max drawdown was -21.0% vs -28.80% for the TSX Composite. 10.05% CAGR beats the TSX by 5.99% per year.

Canada produced the most defensive working capital efficiency portfolio across all 14 exchanges we tested. The max drawdown was -21.0%, roughly 8 percentage points shallower than the TSX Composite's -28.80%.
Contents
- Why Canada?
- Methodology
- The Numbers
- The Drawdown Story
- When It Works
- When It Struggles
- Run It Yourself
- Limitations
- Part of a Series
The CAGR of 10.05% beats the TSX Composite by 5.99% per year. The risk-adjusted profile is strong: a Sortino ratio of 1.226, zero cash periods, and a down capture of just 5.4%. The portfolio barely moved when the Canadian market fell.
Data: FMP financial data warehouse, 2000–2025. Updated April 2026.
Why Canada?
The TSX is dominated by financials, energy, and materials. These sectors tend to have capital-intensive operations. When the working capital efficiency screen filters for companies with lean operations, it naturally selects the subset of Canadian companies that manage cash flow best within capital-heavy industries. These tend to be well-managed mid-cap industrials, consumer companies, and technology firms that benefit from Canada's stable economic environment.
Canada's market is also smaller than the US, with fewer speculative growth companies. The WC/Revenue signal faces less noise from the kind of high-growth, cash-burning companies that dilute the signal in the US.
Methodology
Universe: TSX (Toronto Stock Exchange) Period: 2000-2025 (25 years, 25 annual periods) Portfolio: Top 30 by WC/Revenue ASC, equal weight. Cash if fewer than 10 qualify. Rebalancing: Annual (June) Costs: Size-tiered transaction costs applied Point-in-time: 45-day lag on financial data Data: Ceta Research (FMP financial data warehouse)
Benchmark: TSX Composite (^GSPTSE). Both portfolio and benchmark returns are in CAD, making the comparison currency-neutral.
Signal SQL:
WITH bs AS (
  SELECT b.* FROM balance_sheet b
  JOIN (SELECT symbol, MAX(date) AS max_d
        FROM balance_sheet WHERE period = 'FY' GROUP BY symbol) lat
    ON b.symbol = lat.symbol AND b.date = lat.max_d
  WHERE b.period = 'FY'
),
inc AS (
  SELECT i.* FROM income_statement i
  JOIN (SELECT symbol, MAX(date) AS max_d
        FROM income_statement WHERE period = 'FY' GROUP BY symbol) lat
    ON i.symbol = lat.symbol AND i.date = lat.max_d
  WHERE i.period = 'FY'
),
km AS (
  SELECT k.* FROM key_metrics_ttm k
  JOIN (SELECT symbol, MAX(fetchedAtEpoch) AS max_e
        FROM key_metrics_ttm GROUP BY symbol) lat
    ON k.symbol = lat.symbol AND k.fetchedAtEpoch = lat.max_e
),
fr AS (
  SELECT f.* FROM financial_ratios_ttm f
  JOIN (SELECT symbol, MAX(fetchedAtEpoch) AS max_e
        FROM financial_ratios_ttm GROUP BY symbol) lat
    ON f.symbol = lat.symbol AND f.fetchedAtEpoch = lat.max_e
)
SELECT bs.symbol, p.companyName, p.exchange,
    ROUND((bs.totalCurrentAssets - bs.totalCurrentLiabilities)
        / inc.revenue, 3) AS wc_to_revenue,
    ROUND(km.returnOnEquityTTM * 100, 1) AS roe_pct,
    ROUND(fr.operatingProfitMarginTTM * 100, 1) AS opm_pct,
    ROUND(km.marketCap / 1e9, 2) AS mktcap_b
FROM bs
JOIN inc ON bs.symbol = inc.symbol
JOIN profile p ON bs.symbol = p.symbol
JOIN km ON bs.symbol = km.symbol
JOIN fr ON bs.symbol = fr.symbol
WHERE bs.totalCurrentAssets > bs.totalCurrentLiabilities
  AND (bs.totalCurrentAssets - bs.totalCurrentLiabilities)
      / inc.revenue < 0.50
  AND inc.revenue > 0
  AND km.returnOnEquityTTM > 0.08
  AND fr.operatingProfitMarginTTM > 0.10
  AND km.marketCap > 500000000
  AND p.exchange IN ('TSX')
ORDER BY wc_to_revenue ASC
LIMIT 30
The Numbers
| Metric | WC Canada | TSX Composite |
|---|---|---|
| CAGR | 10.05% | 4.06% |
| Excess CAGR | +5.99% | -- |
| Sharpe Ratio | 0.496 | 0.112 |
| Sortino Ratio | 1.226 | 0.173 |
| Max Drawdown | -21.0% | -28.80% |
| Total Return | 996% | 171% |
| Down Capture | 5.4% | -- |
| Up Capture | 130% | -- |
| Win Rate | 68% | -- |
Zero cash periods. The portfolio was fully invested in all 25 years, averaging 23.5 stocks. Enough Canadian companies consistently pass the quality filters to maintain a diversified portfolio.
The 5.4% down capture is the defensive metric. The portfolio barely participated in TSX downturns while capturing 130% of the upside.
Annual returns:
| Year | Portfolio | TSX Composite | Excess |
|---|---|---|---|
| 2000 | +16.8% | -14.8% | +31.6% |
| 2001 | +1.7% | -8.4% | +10.2% |
| 2002 | -1.6% | -8.7% | +7.1% |
| 2003 | +16.6% | +20.7% | -4.0% |
| 2004 | +36.5% | +14.9% | +21.6% |
| 2005 | +33.2% | +23.6% | +9.6% |
| 2006 | +7.6% | +18.9% | -11.3% |
| 2007 | +8.5% | +4.7% | +3.7% |
| 2008 | -21.0% | -28.5% | +7.5% |
| 2009 | +23.9% | +11.3% | +12.7% |
| 2010 | +23.7% | +14.8% | +8.9% |
| 2011 | +6.7% | -16.1% | +22.8% |
| 2012 | +24.9% | +11.2% | +13.7% |
| 2013 | +17.1% | +16.4% | +0.7% |
| 2014 | +0.2% | +2.9% | -2.7% |
| 2015 | -1.1% | -6.4% | +5.3% |
| 2016 | +22.5% | +9.2% | +13.2% |
| 2017 | +7.1% | +4.0% | +3.2% |
| 2018 | +14.1% | -0.2% | +14.3% |
| 2019 | -12.8% | -3.9% | -8.9% |
| 2020 | +42.4% | +29.7% | +12.7% |
| 2021 | -2.2% | +5.3% | -7.5% |
| 2022 | -7.7% | -4.8% | -3.0% |
| 2023 | +8.9% | +10.4% | -1.5% |
| 2024 | +10.9% | +19.3% | -8.4% |
The Drawdown Story
The max drawdown of -21.0% happened in 2008. The TSX Composite drew down -28.80% over the same crisis. That's nearly 8 percentage points of buffer.
During the dotcom bust, the portfolio delivered three years of relative outperformance: +31.6%, +10.2%, and +7.1% excess. Canadian working capital efficient companies weren't exposed to the US tech implosion.
In 2007, while the US market started falling, the Canadian portfolio returned +8.5%. Then in the worst of the financial crisis (2008), it fell -21.0% vs -28.5%. Even at its worst, it lost less.
The trade-off: in strong TSX rallies (2006, 2024), the portfolio lagged. You give up some upside for meaningfully less downside.
When It Works
Market corrections and bear markets (2000-2002, 2007-2008, 2011, 2018). The portfolio's low beta and defensive tilt shine during periods of market stress. Canadian quality companies with lean working capital held value when US indices fell.
Commodity-aligned periods (2004-2005, 2016, 2018). Canada's economy is resource-linked. When commodities did well, Canadian quality companies with efficient operations outperformed on both the revenue and stock price fronts.
When It Struggles
Weak relative periods (2006, 2019, 2021-2024). When the TSX rallied on commodity strength or the portfolio held defensive names during broad risk-on periods, results lagged. The 2019 drawdown of -12.8% vs the TSX's -3.9% was the worst year at -8.9% excess.
Recent underperformance (2021-2024). Four consecutive years of negative excess returns. The post-COVID rally was US-centric, driven by technology stocks that Canada's TSX has less exposure to. This is the longest stretch of underperformance in the backtest.
Run It Yourself
# Live screen (current Canada stocks)
python3 working-capital/screen.py --preset canada

# Historical backtest
python3 working-capital/backtest.py --preset canada --output results/canada.json --verbose
Limitations
TSX sector concentration. The TSX is heavy in financials and energy. The working capital screen filters many of these out (financials have structurally different working capital). This means the portfolio may over-represent the narrow band of TSX companies that pass quality filters, creating concentration risk.
Recent drag. Four years of negative excess returns (2021-2024) could signal a structural shift or just a cyclical one. We don't know yet.
Small market effect. With 23.5 average stocks from a smaller exchange, the portfolio is more concentrated than the US version. Individual company outcomes matter more.
Part of a Series
- Working Capital Efficiency in the US (flagship, full methodology)
- Working Capital Efficiency in Sweden (+6.5%/yr vs OMX30, best excess)
- Working Capital Efficiency in the UK (+5.0%/yr vs FTSE)
- Working Capital Efficiency in India (+2.8%/yr vs Sensex)
- 14-Exchange Global Comparison
Data: Ceta Research (FMP financial data warehouse), TSX, 2000-2025. Returns in CAD. Full methodology: METHODOLOGY.md
Past performance does not guarantee future results. This is educational content, not investment advice.


