
Working Capital Efficiency in Sweden: 8.7% CAGR vs OMX30's 2.2% (+6.5%/yr Excess)
Sweden produced strong excess returns for working capital efficiency. 8.70% CAGR vs 2.19% for the OMX Stockholm 30. +6.51% annual excess and a 76% win rate. Best excess return across all exchanges tested.

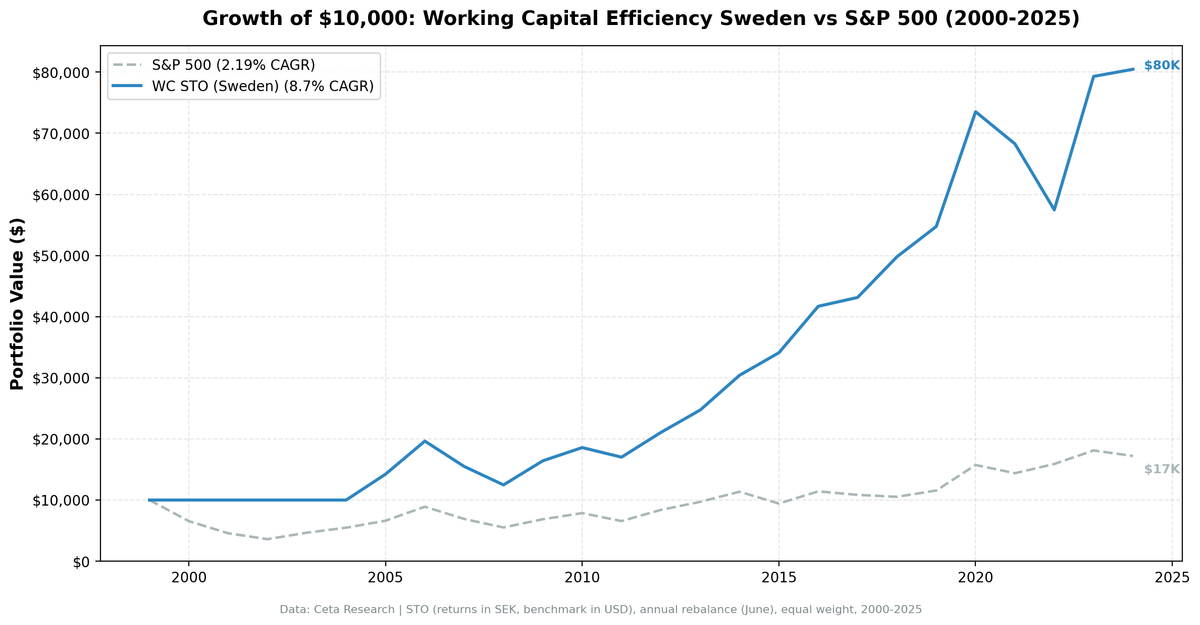
Sweden produced strong excess returns for working capital efficiency when measured against its local benchmark. The CAGR of 8.70% outperforms the OMX Stockholm 30 by 6.51% per year. The portfolio won 76% of years against the local index.
Contents
- Why Sweden?
- Methodology
- The Numbers
- What Drove the Returns
- Cash Periods
- Run It Yourself
- Limitations
- Part of a Series
The OMX30 returned just 2.19% CAGR over 25 years, making it one of the weaker major indices. But the portfolio's absolute 8.70% CAGR is solid on its own.
Data: FMP financial data warehouse, 2000–2025. Updated April 2026.
Why Sweden?
Sweden has an outsized number of high-quality industrial and technology companies for its market size. Companies like Atlas Copco, Hexagon, Alfa Laval, and Assa Abloy are global leaders in niche industrial segments. These companies run lean, capital-efficient operations with strong recurring revenue.
The Stockholm exchange (STO) also has relatively less sell-side coverage than US or UK markets, particularly for mid-cap industrials. The accrual anomaly predicts that less-followed markets offer more mispricing. Working capital efficiency captures that.
Methodology
Universe: STO (Stockholm Stock Exchange) Period: 2000-2025 (25 years, 25 annual periods) Portfolio: Top 30 by WC/Revenue ASC, equal weight. Cash if fewer than 10 qualify. Rebalancing: Annual (June) Costs: Size-tiered transaction costs applied Point-in-time: 45-day lag on financial data Data: Ceta Research (FMP financial data warehouse)
Benchmark: OMX Stockholm 30 (^OMXS30). Both portfolio and benchmark returns are in SEK, making the comparison currency-neutral.
Signal SQL:
WITH bs AS (
  SELECT b.* FROM balance_sheet b
  JOIN (SELECT symbol, MAX(date) AS max_d
        FROM balance_sheet WHERE period = 'FY' GROUP BY symbol) lat
    ON b.symbol = lat.symbol AND b.date = lat.max_d
  WHERE b.period = 'FY'
),
inc AS (
  SELECT i.* FROM income_statement i
  JOIN (SELECT symbol, MAX(date) AS max_d
        FROM income_statement WHERE period = 'FY' GROUP BY symbol) lat
    ON i.symbol = lat.symbol AND i.date = lat.max_d
  WHERE i.period = 'FY'
),
km AS (
  SELECT k.* FROM key_metrics_ttm k
  JOIN (SELECT symbol, MAX(fetchedAtEpoch) AS max_e
        FROM key_metrics_ttm GROUP BY symbol) lat
    ON k.symbol = lat.symbol AND k.fetchedAtEpoch = lat.max_e
),
fr AS (
  SELECT f.* FROM financial_ratios_ttm f
  JOIN (SELECT symbol, MAX(fetchedAtEpoch) AS max_e
        FROM financial_ratios_ttm GROUP BY symbol) lat
    ON f.symbol = lat.symbol AND f.fetchedAtEpoch = lat.max_e
)
SELECT bs.symbol, p.companyName, p.exchange,
    ROUND((bs.totalCurrentAssets - bs.totalCurrentLiabilities)
        / inc.revenue, 3) AS wc_to_revenue,
    ROUND(km.returnOnEquityTTM * 100, 1) AS roe_pct,
    ROUND(fr.operatingProfitMarginTTM * 100, 1) AS opm_pct,
    ROUND(km.marketCap / 1e9, 2) AS mktcap_b
FROM bs
JOIN inc ON bs.symbol = inc.symbol
JOIN profile p ON bs.symbol = p.symbol
JOIN km ON bs.symbol = km.symbol
JOIN fr ON bs.symbol = fr.symbol
WHERE bs.totalCurrentAssets > bs.totalCurrentLiabilities
  AND (bs.totalCurrentAssets - bs.totalCurrentLiabilities)
      / inc.revenue < 0.50
  AND inc.revenue > 0
  AND km.returnOnEquityTTM > 0.08
  AND fr.operatingProfitMarginTTM > 0.10
  AND km.marketCap > 500000000
  AND p.exchange IN ('STO')
ORDER BY wc_to_revenue ASC
LIMIT 30
The Numbers
| Metric | WC Sweden | OMX30 |
|---|---|---|
| CAGR | 8.70% | 2.19% |
| Excess CAGR | +6.51% | -- |
| Sharpe Ratio | 0.366 | -- |
| Max Drawdown | -36.48% | -- |
| Total Return | 705% | -- |
| Down Capture | 13% | -- |
| Up Capture | 95% | -- |
| Win Rate | 76% | -- |
5 cash periods (20%), all in the early years (2000-2004). From 2005 onward, the portfolio was always invested.
The 76% win rate (19 of 25 years) is among the strongest across all exchanges we tested. The 13% down capture means the portfolio barely participated in OMX30 downturns.
Annual returns:
| Year | Portfolio | OMX30 | Excess |
|---|---|---|---|
| 2000 | 0.0% (cash) | -34.5% | +34.5% |
| 2001 | 0.0% (cash) | -30.3% | +30.3% |
| 2002 | 0.0% (cash) | -21.3% | +21.3% |
| 2003 | 0.0% (cash) | +29.6% | -29.6% |
| 2004 | 0.0% (cash) | +17.6% | -17.6% |
| 2005 | +42.3% | +20.9% | +21.4% |
| 2006 | +38.0% | +34.6% | +3.5% |
| 2007 | -21.1% | -22.5% | +1.4% |
| 2008 | -19.5% | -20.1% | +0.7% |
| 2009 | +31.6% | +24.5% | +7.1% |
| 2010 | +13.2% | +14.5% | -1.4% |
| 2011 | -8.4% | -16.5% | +8.1% |
| 2012 | +23.8% | +27.9% | -4.1% |
| 2013 | +17.4% | +15.7% | +1.8% |
| 2014 | +23.0% | +17.1% | +5.9% |
| 2015 | +12.1% | -17.1% | +29.2% |
| 2016 | +22.3% | +21.2% | +1.1% |
| 2017 | +3.5% | -5.0% | +8.4% |
| 2018 | +15.4% | -3.0% | +18.4% |
| 2019 | +9.9% | +9.8% | +0.2% |
| 2020 | +34.3% | +36.1% | -1.8% |
| 2021 | -7.2% | -8.5% | +1.4% |
| 2022 | -15.8% | +10.4% | -26.2% |
| 2023 | +38.0% | +13.9% | +24.1% |
| 2024 | +1.5% | -5.0% | +6.5% |
What Drove the Returns
The Nordic industrial boom (2005-2006, 2013-2016). Swedish industrials thrived during global expansion cycles. The portfolio returned +42.3% in 2005 and +38.0% in 2006 vs OMX30's +20.9% and +34.6%. Swedish quality companies compound well when the global economy expands.
Financial crisis resilience (2007-2008). -21.1% in 2007 and -19.5% in 2008, tracking the OMX30 closely (-22.5% and -20.1%). The portfolio didn't amplify the drawdown. The recovery in 2009 (+31.6%) was swift.
2015 and 2018: standout years. +12.1% in 2015 while the OMX30 fell 17.1% (+29.2% excess). Then +15.4% in 2018 while the OMX30 fell 3.0% (+18.4% excess). These are the best single-year outperformances.
The 2022 drag. -15.8% while the OMX30 returned +10.4%. The -26.2% excess was the worst year, driven by rate-sensitive Swedish growth stocks underperforming while the OMX30 held up on large-cap exporters.
Cash Periods
2000-2004 were cash periods (5 of 25, 20%). FMP's Stockholm exchange data for the early 2000s was thinner. Fewer Swedish companies had the coverage depth for the quality filters to work. From 2005 onward, the portfolio was consistently invested.
The cash periods help the early numbers (the portfolio avoided the 2000-2002 downturn) but hurt 2003-2004, when the portfolio sat in cash during market rallies.
Run It Yourself
# Live screen (current Sweden stocks)
python3 working-capital/screen.py --preset sweden

# Historical backtest
python3 working-capital/backtest.py --preset sweden --output results/sweden.json --verbose
Limitations
Weak benchmark flatters the excess. The OMX30's 2.19% CAGR is weak. Against SPY (7.64%), the portfolio's 8.70% CAGR would show just +1.06% excess. The +6.51% partly reflects a weak local index.
Small market. A few large Swedish industrials (Atlas Copco, Sandvik, Volvo) may dominate portfolio returns in certain years.
Cash periods in early years. 5 of 25 periods (20%) had no investment. The portfolio avoided the OMX30's severe 2000-2002 drawdowns (-34.5%, -30.3%, -21.3%) by being in cash, then missed the 2003-2004 recovery.
Concentration in industrials. Sweden's stock market is industrial-heavy. The working capital screen reinforces this by selecting the most efficient industrials. If the industrial sector undergoes a structural decline, the portfolio would be disproportionately affected.
Part of a Series
- Working Capital Efficiency in the US (flagship, full methodology)
- Working Capital Efficiency in Canada (lowest drawdown, -21.0%)
- Working Capital Efficiency in the UK (+5.0%/yr vs FTSE)
- Working Capital Efficiency in India (+2.8%/yr vs Sensex)
- 14-Exchange Global Comparison
Data: Ceta Research (FMP financial data warehouse), STO, 2000-2025. Returns in SEK, benchmarked against OMX Stockholm 30. Full methodology: METHODOLOGY.md
Past performance does not guarantee future results. This is educational content, not investment advice.


