
Yield Gap US: When Earnings Yields Outrun Bond Yields (2000-2025)


Contents
The idea behind the yield gap is simple: stocks have an earnings yield (1/PE), and bonds have a yield. When stocks yield more than bonds, equities offer a wide margin of safety. When that gap narrows, the margin shrinks. We built a screen around this relationship, buy stocks where the earnings yield exceeds the risk-free rate by at least 3 percentage points, filter for quality, and hold annually. Here are the 25-year results on US stocks.
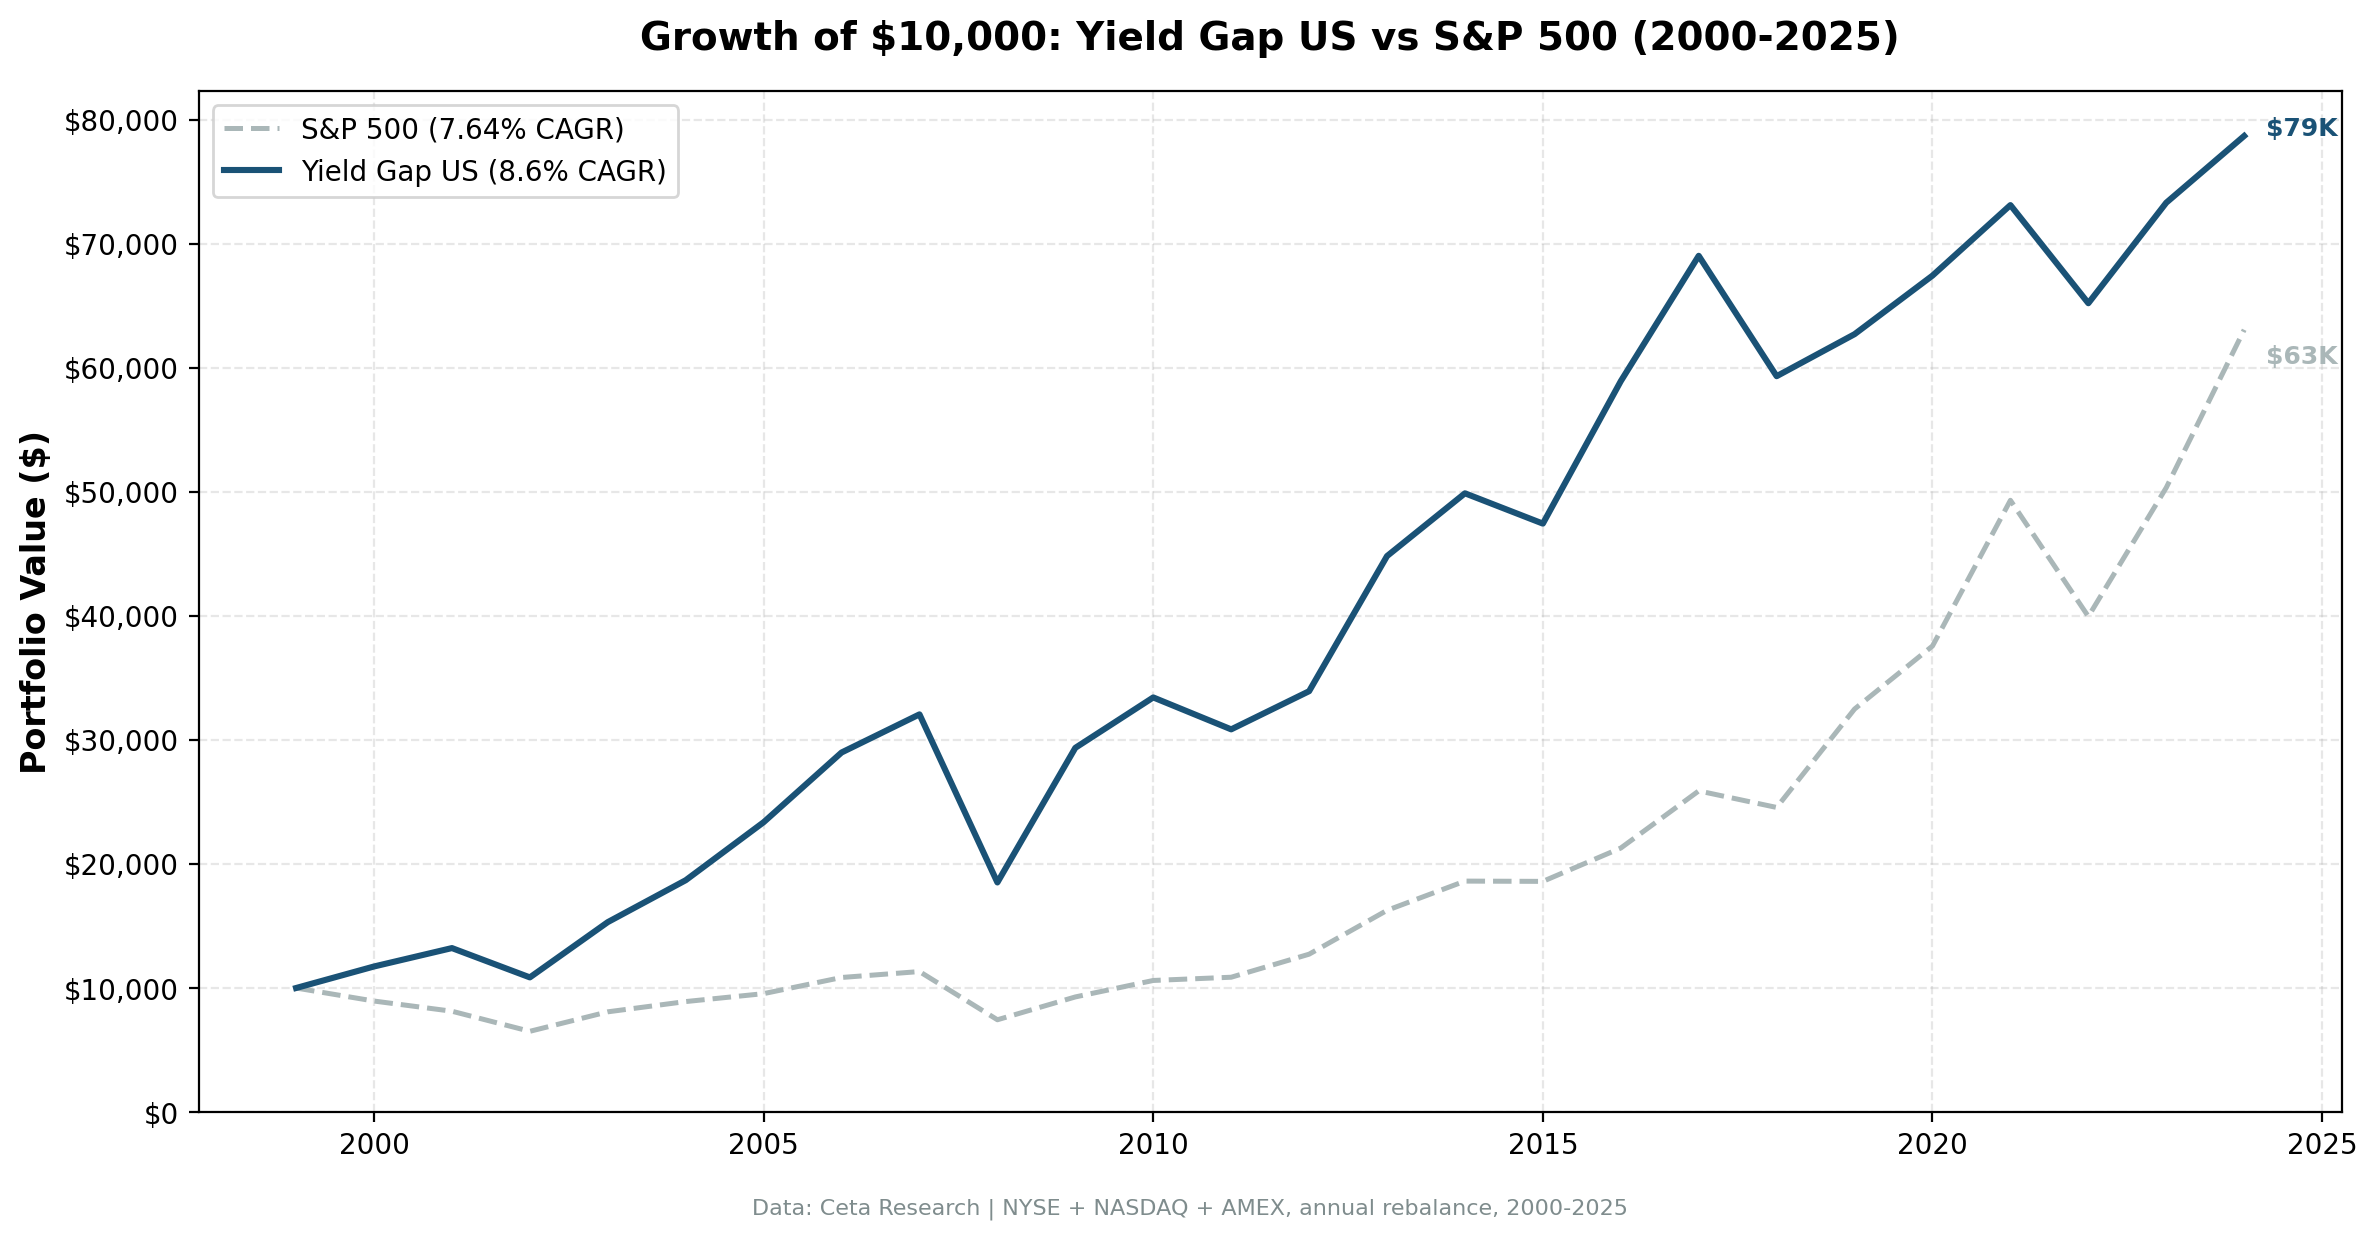
A $10,000 investment in January 2000 grew to $78,693 under this strategy. The same investment in SPY grew to $63,066.
The Strategy
The yield gap compares a stock's earnings yield to the prevailing risk-free rate. For US stocks, we use a 2% long-run risk-free rate assumption (conservative, matching long-term historical averages for the Fed Funds rate in non-crisis periods).
Signal: - Earnings yield > max(6%, rfr + 3%), for the US, this is simply EY > 6% (PE < ~16.7x) - Earnings yield < 50% (cap for distress or data errors) - ROE > 8% (return on equity, filters out low-quality value traps) - D/E < 2.0 (debt-to-equity, filters out leveraged distress)
Portfolio construction: - Top 30 stocks by highest earnings yield (widest gap first), equal weight - Annual rebalance, January - Holds cash if fewer than 10 stocks qualify
The earnings yield threshold of 6% means we're only buying stocks with PE ratios below roughly 16.7x. The ROE and D/E filters separate cheap companies from cheap companies with problems. High earnings yields on leveraged, low-return businesses often reflect permanently impaired franchises, not temporary mispricing.
Methodology
- Universe: NYSE, NASDAQ, and AMEX (full exchange, not index-constrained)
- Market cap filter: $1B+ USD at each rebalance date
- Data period: January 2000 through December 2025 (25 annual periods)
- Rebalancing: Annual (January)
- Portfolio size: Up to 30 stocks, equal weight. Cash if fewer than 10 qualify.
- Point-in-time data: FY filings applied with a 45-day lag (avoids look-ahead bias)
- Transaction costs: Size-tiered model based on market cap at time of trade
- Benchmark: SPY (S&P 500 ETF)
- Data source: Ceta Research FMP financial data warehouse
Full methodology at github.com/ceta-research/backtests/blob/main/METHODOLOGY.md.
Results
| Metric | Yield Gap US | SPY |
|---|---|---|
| CAGR | 8.60% | 7.64% |
| Total return (25yr) | 686.9% | 530.7% |
| Max drawdown | -42.27% | -45.50% |
| Sharpe ratio | 0.327 | — |
| Down capture vs SPY | 61.1% | — |
| Win rate vs SPY | 48.0% | — |
| Cash periods | 0 of 25 years | — |
| Avg stocks (invested) | 22.0 | — |
The down-capture of 61.1% is the headline number. In years when SPY fell, this portfolio on average fell only 61% as much. That's meaningful protection without holding any cash.
The 48% win rate tells you this isn't a consistent annual beater, it underperforms SPY in more than half of individual years. The edge comes from better bear market performance compounding over time.
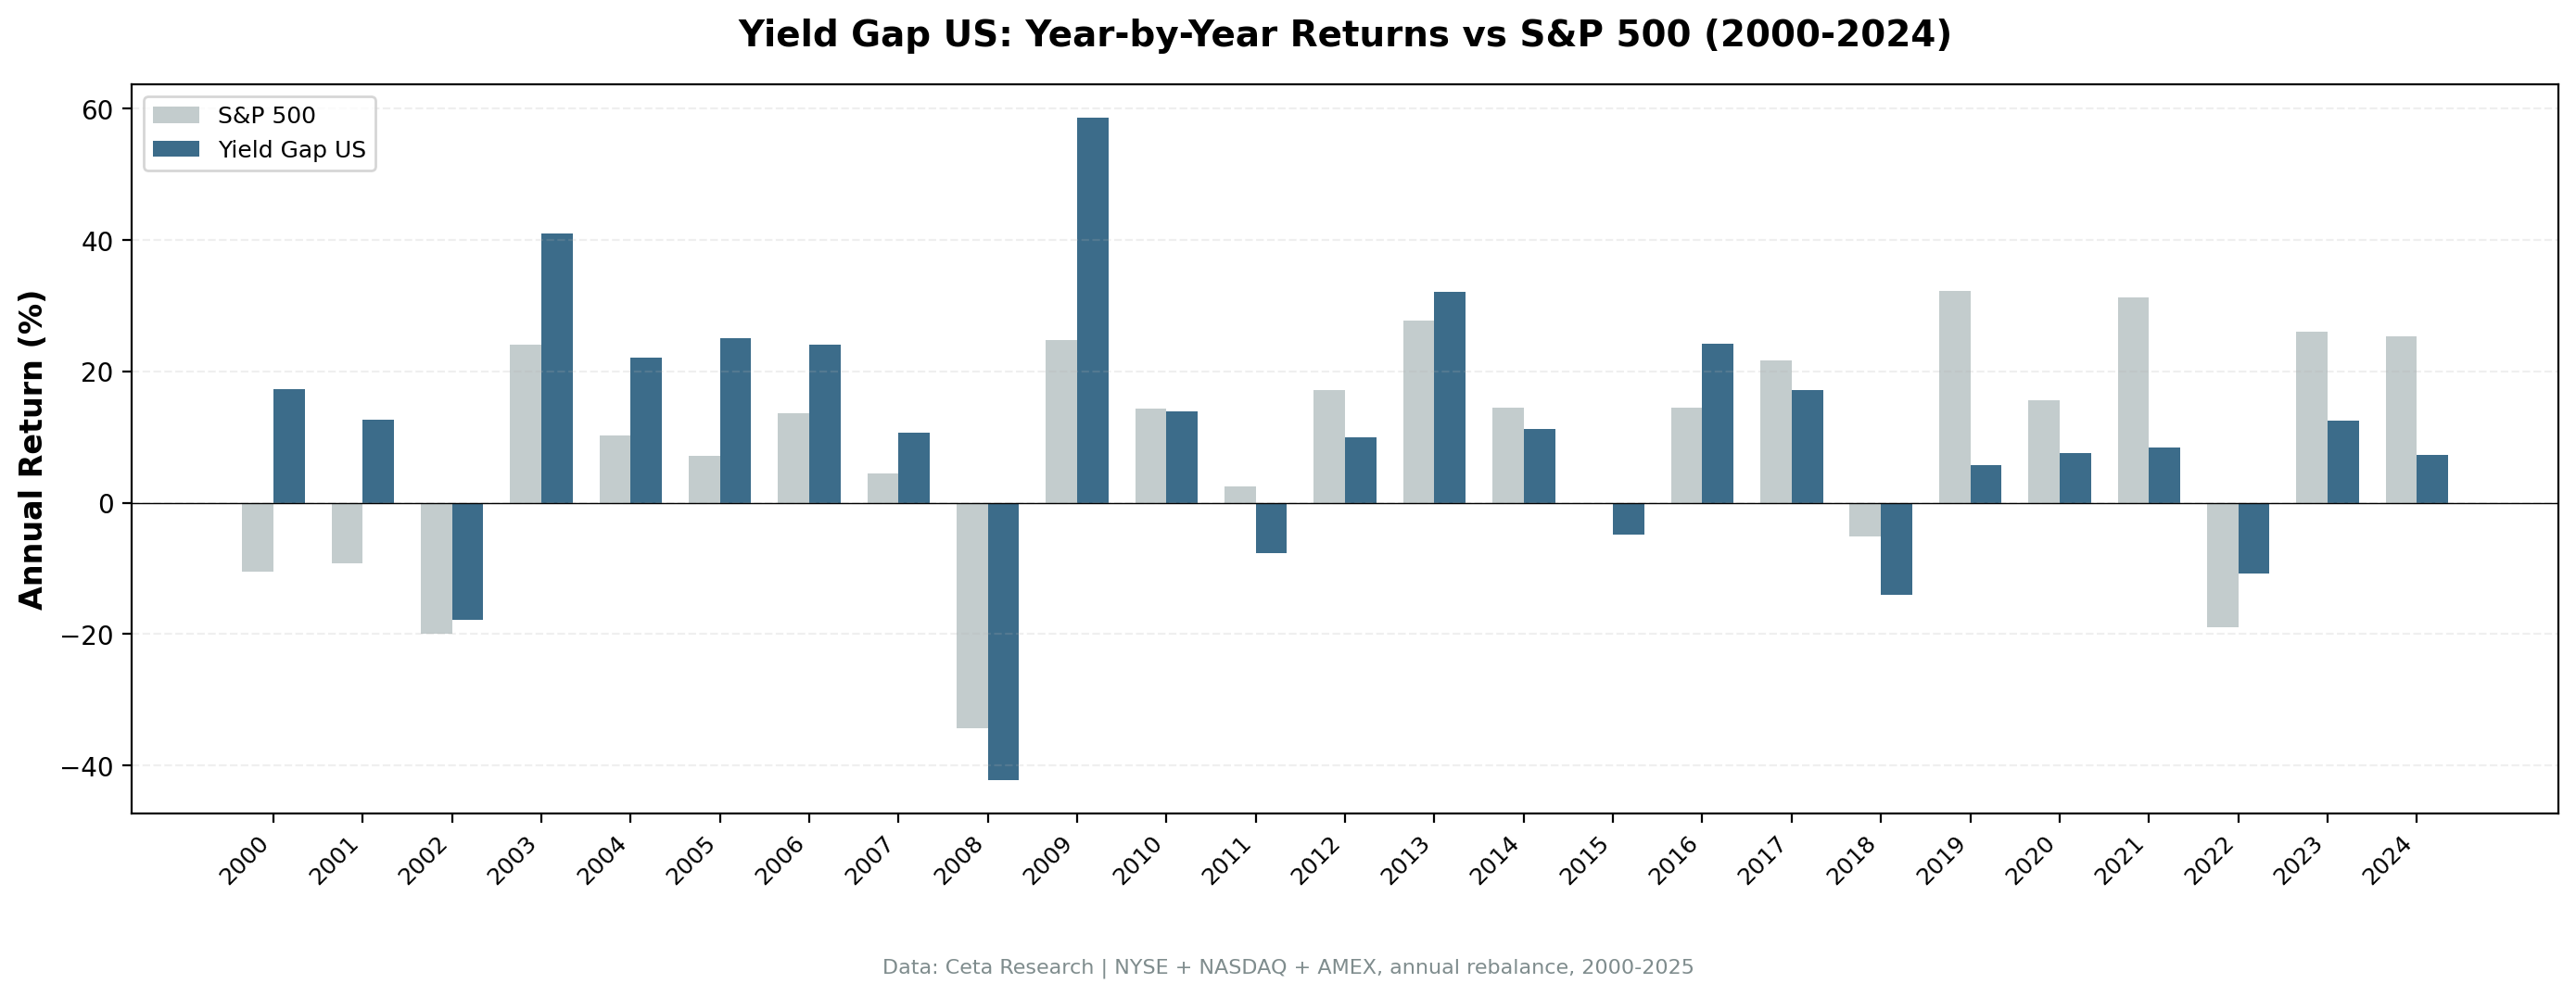
Annual returns:
| Year | Portfolio | SPY | Excess |
|---|---|---|---|
| 2000 | +17.36% | -10.50% | +27.86% |
| 2001 | +12.64% | -9.17% | +21.81% |
| 2002 | -17.88% | -19.92% | +2.04% |
| 2003 | +41.05% | +24.12% | +16.93% |
| 2004 | +22.06% | +10.24% | +11.82% |
| 2005 | +25.02% | +7.17% | +17.85% |
| 2006 | +24.05% | +13.65% | +10.40% |
| 2007 | +10.61% | +4.40% | +6.21% |
| 2008 | -42.27% | -34.31% | -7.96% |
| 2009 | +58.64% | +24.73% | +33.91% |
| 2010 | +13.84% | +14.31% | -0.47% |
| 2011 | -7.70% | +2.46% | -10.16% |
| 2012 | +9.97% | +17.09% | -7.12% |
| 2013 | +32.11% | +27.77% | +4.34% |
| 2014 | +11.29% | +14.50% | -3.21% |
| 2015 | -4.90% | -0.12% | -4.78% |
| 2016 | +24.21% | +14.45% | +9.76% |
| 2017 | +17.15% | +21.64% | -4.49% |
| 2018 | -14.06% | -5.15% | -8.91% |
| 2019 | +5.71% | +32.31% | -26.60% |
| 2020 | +7.53% | +15.64% | -8.11% |
| 2021 | +8.43% | +31.26% | -22.83% |
| 2022 | -10.82% | -18.99% | +8.17% |
| 2023 | +12.43% | +26.00% | -13.57% |
| 2024 | +7.34% | +25.28% | -17.94% |
When It Works
The dotcom bust (2000-2007). This is where the strategy earned most of its excess return. From 2000 to 2007, the Yield Gap US compounded at roughly 18% annually while SPY struggled. The logic held: high-PE growth stocks imploded, while value stocks with high earnings yields were already priced conservatively. The strategy had zero overlap with the tech bubble.
2000 alone: +17.36% vs -10.50% for SPY. A 27.86-point spread in the first year of the backtest.
Post-crash recoveries. After 2008, the portfolio returned +58.64% vs +24.73% for SPY. Cheap stocks had been sold down further than their fundamentals warranted during the panic, and the earnings-yield screen caught the deepest discounts.
Bear markets generally. 2002 (-17.88% vs -19.92%), 2022 (-10.82% vs -18.99%), 2011 (-7.70% vs +2.46%, underperformed but still defensive). The 61% down-capture is consistent across multiple bear market episodes.
When It Struggles
Tech-driven bull markets (2019-2021, 2023-2024). The worst three-year run for this strategy was 2019-2021: +5.71%, +7.53%, +8.43% vs SPY's +32.31%, +15.64%, +31.26%. A strategy requiring PE < 16.7x has exactly zero exposure to high-growth technology compounders. In years when a handful of AI and mega-cap names drive the index, the portfolio sits entirely on the sidelines of that rally.
2024 was the most painful single year: +7.34% vs +25.28% SPY (-17.94% relative). The market's returns were highly concentrated in a few names trading at 30-50x earnings, stocks that never qualify for this screen.
The tension in the strategy. A low-PE screen is, by construction, a bet that the market overweights growth and underweights value. That bet paid off massively in 2000-2007. It has been a persistent drag since 2017, when technology companies began demonstrating that high PE ratios can be justified by compounding earnings growth. Whether that regime continues or reverts is an open question, and it's the key risk in running this strategy.
Part of a Series: Global | UK | Sweden | India | Canada
Run It Yourself
Current yield gap screen (live data):
SELECT
 k.symbol,
 p.companyName,
 p.exchange,
 p.sector,
 ROUND(k.earningsYieldTTM * 100, 2) AS earnings_yield_pct,
 ROUND(1.0 / NULLIF(k.earningsYieldTTM, 0), 1) AS implied_pe,
 ROUND(k.returnOnEquityTTM * 100, 2) AS roe_pct,
 ROUND(fr.debtToEquityRatioTTM, 2) AS debt_to_equity,
 ROUND(k.freeCashFlowYieldTTM * 100, 2) AS fcf_yield_pct,
 ROUND(k.marketCap / 1e9, 2) AS mktcap_b
FROM key_metrics_ttm k
JOIN profile p ON k.symbol = p.symbol
JOIN financial_ratios_ttm fr ON k.symbol = fr.symbol
WHERE k.earningsYieldTTM > 0.06 -- EY > 6% (PE < 16.7x)
 AND k.earningsYieldTTM < 0.50
 AND k.returnOnEquityTTM > 0.08 -- ROE > 8%
 AND (fr.debtToEquityRatioTTM IS NULL
 OR (fr.debtToEquityRatioTTM >= 0 AND fr.debtToEquityRatioTTM < 2.0))
 AND k.marketCap > 1000000000 -- $1B+ market cap
 AND (p.industry IS NULL OR p.industry NOT LIKE 'Asset Management%')
 AND (p.industry IS NULL OR p.industry NOT LIKE 'Shell Companies%')
 AND (p.industry IS NULL OR p.industry NOT LIKE 'Closed-End Fund%')
 AND p.exchange IN ('NYSE', 'NASDAQ', 'AMEX')
ORDER BY k.earningsYieldTTM DESC
LIMIT 30
Run this query on Ceta Research Data Explorer
Run the full historical backtest:
git clone https://github.com/ceta-research/backtests.git
cd backtests
pip install -r requirements.txt
python3 yield-gap/backtest.py --preset us --output results.json --verbose
Limitations
Look-ahead bias: FY financial statements are applied with a 45-day filing lag. We're confident in the point-in-time logic, but backtests are always susceptible to subtle data timing issues.
Survivorship bias: FMP includes delisted stocks, which reduces but doesn't eliminate survivorship bias. Companies that failed spectacularly may still be partially underrepresented if they were delisted before full FY data was captured.
Fixed risk-free rate: We use a 2% long-run average US risk-free rate. The actual Federal Funds rate ranged from 0.07% to 5.33% during this period. In high-rate environments (2022-2024), the 6% EY threshold becomes relatively less generous, and the portfolio may miss the full tightening of credit conditions.
Transaction costs: Size-tiered cost model. Real-world costs for smaller positions in the screen could be higher than modeled.
Regime dependence: The strategy's cumulative outperformance was largely built in 2000-2007. An investor who started in 2010 would have experienced roughly 14 years of underperformance. Whether value mean-reverts from here or growth continues to compound is the central question.
Data: Ceta Research (FMP financial data warehouse), January 2000 through December 2025. Full methodology: github.com/ceta-research/backtests/blob/main/METHODOLOGY.md.
Academic references: Campbell, J.Y. & Vuolteenaho, T. (2004). "Bad Beta, Good Beta." American Economic Review, 94(5). Damodaran, A. (2012). "Equity Risk Premiums (ERP): Determinants, Estimation and Implications." Stern School of Business.


